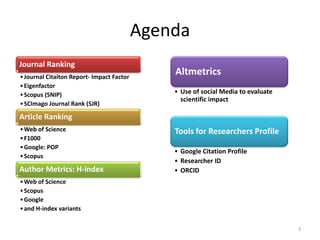
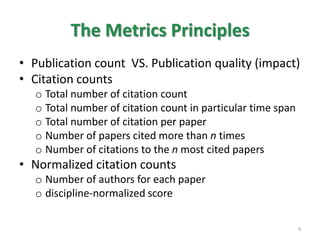
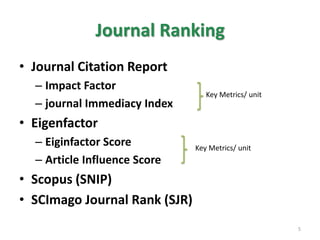
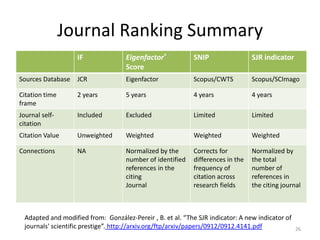
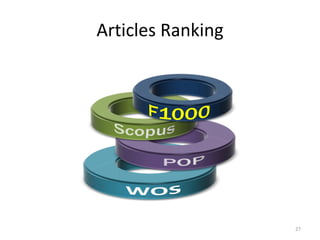
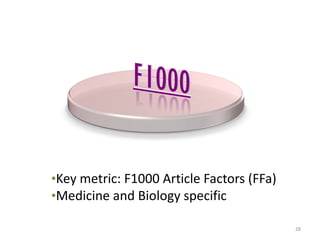
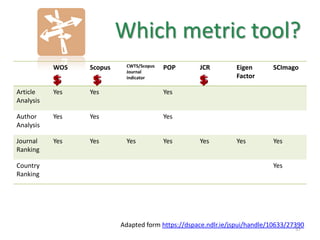
Research Metrics: Measuring
Scientific Output
Nazi Torabi
Research & Instructional Librarian
Allyn & Betty Taylor Library
April 25, 2013
http://www.slideshare.net/ntorabi/
1
1. To provide an overview of various
bibliometrics products/tools
2. Have a good understanding of limitation of
each product
3. How to calculate your own h-index
Objectives
2
Agenda
Journal Ranking
•Journal Citaiton Report- Impact Factor
•Eigenfactor
•Scopus (SNIP)
•SCImago Journal Rank (SJR)
Article Ranking
•Web of Science
•F1000
•Google: POP
•Scopus
Author Metrics: H-index
•Web of Science
•Scopus
•Google
•and H-index variants
Altmetrics
• Use of social Media to evaluate
scientific impact
Tools for Researchers Profile
• Google Citation Profile
• Researcher ID
• ORCID
3
The Metrics Principles
• Publication count VS. Publication quality (impact)
• Citation counts
o Total number of citation count
o Total number of citation count in particular time span
o Total number of citation per paper
o Number of papers cited more than n times
o Number of citations to the n most cited papers
• Normalized citation counts
o Number of authors for each paper
o discipline-normalized score
4
Journal Ranking
• Journal Citation Report
– Impact Factor
– journal Immediacy Index
• Eigenfactor
– Eiginfactor Score
– Article Influence Score
• Scopus (SNIP)
• SCImago Journal Rank (SJR)
5
Key Metrics/ unit
Key Metrics/ unit
•“IF of a journal is the average number of citations received
per paper published in that journal during the two preceding
years.”Source
•IF provides Journal ranking by discipline
•JCR provides citing pattern analysis in discipline
6
Impact Factor
Number of times articles published in 2008 and 2009
were cited by indexed journals during 2010
Total number of "citable items" published by that
journal in 2008 and 2009
2010 Journal IF =
i.e. An Impact Factor of 1.0 in 2013 for a
journal means that, on average, the articles
published in 2011 and 2012 in that journal
have been cited one time.
•Self-citation is included.
•Citable items are usually articles, reviews, proceedings, or notes; not
editorials or Letters-to-the-Editor. 7
Journal Immediacy Index
i.e. The journal Immediacy Index indicates
how quickly articles in a journal are cited.
Number of times articles published in 2010 were cited
by indexed journals during 2010
Total number of "citable items" published by that
journal in 2010
2010 Journal
Immediacy =
Index
JCR
8
Journal: CHEMBIOCHEM
9
JCR Video on how to find IF
For 2011, the journal CHEMBIOCHEM
has an Impact Factor of 3.944.
Category Name
Total Journals
in Category
Journal Rank
in Category
Quartile
in Category
BIOCHEMISTRY &
MOLECULAR
BIOLOGY
290 84 Q2
CHEMISTRY,
MEDICINAL
59 6 Q1
10
IF & its shortcomings
• Citation pattern is discipline specific
– Time span
– Citation frequency
– differences in citation norms
• Sleeping beauties
• Review Journals
• Self-Citation!
• Negative citations
• Title and journal format changes
• A questionable validity
11
Probability density function for journals in subject
categories of ENERGY & FUELS – data from JCR
-5 -4 -3 -2 -1 0 1 2 3 4 5
Normal distribution
Pareto distribution
12
IF is based on the
arithmetic mean
number of citations
per paperThe reality of
citation patterns is
a Pareto
distribution
Articles on validity of IF
• Dissecting our impact factor. Nature Materials
10, 645 (2011) doi:10.1038/nmat3114
• Bollen, Johan, et al. "A principal component
analysis of 39 scientific impact measures."
PloS one 4.6 (2009): e6022.
• Priem, Jason, and Bradely H. Hemminger.
"Scientometrics 2.0: New metrics of scholarly
impact on the social Web." First Monday 15.7
(2010).
13
Eigenfactor.org
14
Citation Networks & Network Effects
15
Scholarship is the
flow of idea.
16
High School Dating
Network
Bearman, Peter S., James Moody, and Katherine Stovel.
"Chains of Affection: The Structure of Adolescent
Romantic and Sexual Networks." American Journal of
Sociology 110, no. 1 (July 2004): 44-91.
17
Which network you would rather be
part of?
West, J (2010). The EigenfactorTM Metrics: a network approach to
assessing scholarly journals.
http://mediazone.brighttalk.com/comm/ReedElsevier/ad0fb0ef1d-
21688-4348-23066
18
A B
The Rich gets Richer
•Journals are ranked according to the citation network.
•Journals are influential when they are cited by other influential
journals.
•“The Eigenfactor™ score of a journal is an estimate of the
percentage of time that researchers spend with that journal.”
19
http://well-formed.eigenfactor.org/radial.html
20
Article Influence™ Score
Journal’s Eigenfactor Score (5yrs)
Number of articles in the journal
Article Influence™ =
Score
21
IF vs. Eigenfactor
22
e.g. of Article Influence™ Score
23
http://www.eigenfactor.org/
More on Journal Ranking
SJR
• SCImago Journal Rank is
weighted by the prestige of
a journal. Subject field,
quality and reputation of
the journal have a direct
effect on the value of a
citation.
• SJR normalizes for
differences in citation
behavior between subject
fields.
SNIP
• Source Normalized Impact
per Paper measures
contextual citation impact
by weighting citations based
on the total number of
citations in a subject field.
• It corrects for differences in
the frequency of citation
across research fields.
24
4 years of data is required to calculate SJR and SNIP
http://www.youtube.com/watch?v=ZQQIYBBMiUg&list=UUtm20B-NV4ShpVGj_5A8ukQ&index=8
Scopus
25
Journal Ranking Summary
IF Eigenfactor®
Score
SNIP SJR indicator
Sources Database JCR Eigenfactor Scopus/CWTS Scopus/SCImago
Citation time
frame
2 years 5 years 4 years 4 years
Journal self-
citation
Included Excluded Limited Limited
Citation Value Unweighted Weighted Weighted Weighted
Connections NA Normalized by the
number of identified
references in the
citing
Journal
Corrects for
differences in the
frequency of
citation across
research fields
Normalized by
the total
number of
references in
the citing journal
Adapted and modified from: González-Pereir , B. et al. “The SJR indicator: A new indicator of
journals' scientific prestige”. http://arxiv.org/ftp/arxiv/papers/0912/0912.4141.pdf 26
Articles Ranking
27
•Key metric: F1000 Article Factors (FFa)
•Medicine and Biology specific
28
F1000 factors
The F1000 Article Factor (FFa) is calculated from the highest rating
awarded by a Faculty Member (FM) plus an increment for each
additional rating from other FMs.
For example, a single article that has been evaluated by three Faculty
Members, who rated it ‘Recommended’, ‘Must Read’ and ‘Must Read’,
will have its FFa calculated thus:
8 (highest rating ‘Must Read’) + 2 (increment for ‘Must Read’) + 1 (increment for ‘Recommended’) = 11.
Rating Value Increment
Exceptional 10 3
Must Read 8 2
Recommended 6 1
29
30
31
Citation overview from Scopus
• The Citation Overview Results page lists
documents that cited the document you selected
from the Citation Overview.
• You can include up to 5000 documents in a
Citation Tracker. If you select more than 5000
documents only the first 5000 are included.
• More
http://trainingdesk.elsevier.com/videos/scopus-
analyze-results-tool
32
33
34
35
Harzing's Publish or Perish
Publish or Perish is a software program that retrieves and
analyzes academic citations. It uses Google Scholar to
obtain the raw citations, then analyzes these and
presents the following statistics:
o Total number of papers
o Total number of citations
o Average number of citations per paper
o Average number of citations per author
o Average number of papers per author
o Average number of citations per year
o h-index and related parameters
o An analysis of the number of authors per paper.
36Download and install Publish or Perish at http://www.harzing.com/pop.htm#download
37
Google Scholar vs. WOS dataset
• Transparency
• Coverage
o Better coverage for unique citations
o Not limited to journal articles published in ISI listed
journals
o Greater geographical coverage for non-US/UK based
journals
o Better coverage of non-English sources
• Includes more comprehensive data for junior
academics
38
Google Scholar vs. WOS dataset cont’
• Accounts for minor citation errors
• Does not account for duplications
• Includes non-scholarly citations such as
student handbooks, library guides or editorial
notes.
• Unclear coverage
o uneven coverage across different fields of study
o older materials are not well covered
39
A researcher’s H-index is the largest possible number n
for which n of the researcher’s publications have been
cited at least n times.
i.e. If a researcher has an h-index of 25 if 25 of their
papers have been cited at least 25 times (See the graph
in the handout).
40
h-Index example
Researcher A Researcher B Researcher C Researcher D
Citations for most-cited
article
3 5 14 8
Citations for second most-
cited article
3 5 1 3
Citations for third most-cited
article
3 5 0 2
Citations for fourth most-
cited article
3 0 0 1
Citations for fifth most-cited
article
3 0 0 1
Average citations per paper 3 3 3 3
H-index 3 3 1 2
41
Jarvey, P. (2012). Making Research Count: Analyzing Canadian Academic Publishing Cultures
Citation Report from WOS
The Citation Report provides aggregate citation
statistics for a set of search results. These
statistics include:
o The total number of times all items have been cited
o The average number of times an item has been cited
o The number of times an item has been cited each year
o The average number of times an item has been cited
in a year
o More info
42
43
Finding H-Index
• Scopus
• Google
44
Why h-Index
• It considers both productivity and impact.
• It is not influenced by a small number of very
successful articles, which may not be
representative of a researcher’s career output.
The H-index similarly discounts the value of
papers that are not influential.
• The H-index is simpler and easier to
understand than many other compound
bibliometric metrics.
45
h-index shortcomings
• Early career researchers
• Number of authors
• Order of authorship
• Sleeping beauties
• the time since publication of individual articles
• Databases are not error free
• Inconsistency between different metric tools (See
the handout).
• The balance between number of publications vs.
number of citations each receives
46
Adapted from Jarvey, P. (2012). Making Research Count: Analyzing Canadian Academic Publishing Cultures
number of publications vs. number of
citations each receives
47
Researcher A : 5 articles published – each cited 5 times
Researcher B : 2 articles published – each cited 20 times
Researcher A (5, 5, 5, 5, 5 ) = h-index = 5
Researcher B (20, 20) = h-index = 20
Selected h-index Variants
• g-index: more weight is given to the highest cited
papers
• individual h-index: accounts for co-authorship in
calculating impact by giving less weight to such papers
• contemporary h-index: less weight to older cited
papers
• i10 index : from Google Scholars, indicates the number
of papers which have at least ten citations
• age-weighted citation rate: accounts for the age of
papers
Tarma Software Research (2010). Publish or Perish User’s Manual
http://www.harzing.com/pophelp/metrics.htm#gindex
48
• “altmetrics is the creation and study of
new metrics based on the Social Web
for analyzing, and informing
scholarship.”
http://altmetrics.org/manifesto/
PLoS Impact Explorer
ImpactStory
• Open Source
• Metrics are computed based on the data sources
aggregated from various social media tools
• The first 1000 items you register are free
• Covers diverse products including slides, articles,
software, dataset, etc
• It does not provide comprehensive impact
• It is in Beta format
• e.g. http://impactstory.org/collection/fdtpk4
51
Usage - Downloads, views, book holdings, ILL, document delivery
Captures - Favorites, bookmarks, saves, readers, groups, watchers
Mentions - blog posts, news stories, Wikipedia articles, comments, reviews
Social media - Tweets, +1's, likes, shares, ratings
Citations - PubMed, Scopus, patents
52
53
Google Scholar Researchers Profiles
http://www.google.ca/intl/en/scholar/citations.html
55
Open Researcher and Contributor ID
56
• Open Researcher ID - is an initiative
to provide researchers and scholars with a
persistent, unique identifier.
http://about.orcid.org/
http://trainingdesk.elsevier.com/videos/scopus-
creating-an-orcid-record-from-your-scopus-
author-id
WOS Scopus CWTS/Scopus
Journal
indicator
POP JCR Eigen
Factor
SCImago
Article
Analysis
Yes Yes Yes
Author
Analysis
Yes Yes Yes
Journal
Ranking
Yes Yes Yes Yes Yes Yes Yes
Country
Ranking
Yes
Which metric tool?
Adapted form https://dspace.ndlr.ie/jspui/handle/10633/27390
57
More info:
• Guide
http://researchguides.library.syr.edu/content.php?p
id=194034&sid=3337810
• MyRI Bibliometrics Toolkit
http://www.youtube.com/user/NDLRMyRI/videos
http://www.ndlr.ie/myri/
• Research Trends
http://www.researchtrends.com/?s=bibliometric&x
=6&y=7&cat=-1
58
Questions
Need library related assistance?
Please don’t hesitate to contact us:
Nazi Torabi
519-661-2111 x88992
ntorabi@uwo.ca
59
http://www.lib.uwo.ca/chat/

Research metrics Apr2013

  • 1.
    Research Metrics: Measuring ScientificOutput Nazi Torabi Research & Instructional Librarian Allyn & Betty Taylor Library April 25, 2013 http://www.slideshare.net/ntorabi/ 1
  • 2.
    1. To providean overview of various bibliometrics products/tools 2. Have a good understanding of limitation of each product 3. How to calculate your own h-index Objectives 2
  • 3.
    Agenda Journal Ranking •Journal CitaitonReport- Impact Factor •Eigenfactor •Scopus (SNIP) •SCImago Journal Rank (SJR) Article Ranking •Web of Science •F1000 •Google: POP •Scopus Author Metrics: H-index •Web of Science •Scopus •Google •and H-index variants Altmetrics • Use of social Media to evaluate scientific impact Tools for Researchers Profile • Google Citation Profile • Researcher ID • ORCID 3
  • 4.
    The Metrics Principles •Publication count VS. Publication quality (impact) • Citation counts o Total number of citation count o Total number of citation count in particular time span o Total number of citation per paper o Number of papers cited more than n times o Number of citations to the n most cited papers • Normalized citation counts o Number of authors for each paper o discipline-normalized score 4
  • 5.
    Journal Ranking • JournalCitation Report – Impact Factor – journal Immediacy Index • Eigenfactor – Eiginfactor Score – Article Influence Score • Scopus (SNIP) • SCImago Journal Rank (SJR) 5 Key Metrics/ unit Key Metrics/ unit
  • 6.
    •“IF of ajournal is the average number of citations received per paper published in that journal during the two preceding years.”Source •IF provides Journal ranking by discipline •JCR provides citing pattern analysis in discipline 6
  • 7.
    Impact Factor Number oftimes articles published in 2008 and 2009 were cited by indexed journals during 2010 Total number of "citable items" published by that journal in 2008 and 2009 2010 Journal IF = i.e. An Impact Factor of 1.0 in 2013 for a journal means that, on average, the articles published in 2011 and 2012 in that journal have been cited one time. •Self-citation is included. •Citable items are usually articles, reviews, proceedings, or notes; not editorials or Letters-to-the-Editor. 7
  • 8.
    Journal Immediacy Index i.e.The journal Immediacy Index indicates how quickly articles in a journal are cited. Number of times articles published in 2010 were cited by indexed journals during 2010 Total number of "citable items" published by that journal in 2010 2010 Journal Immediacy = Index JCR 8
  • 9.
  • 10.
    For 2011, thejournal CHEMBIOCHEM has an Impact Factor of 3.944. Category Name Total Journals in Category Journal Rank in Category Quartile in Category BIOCHEMISTRY & MOLECULAR BIOLOGY 290 84 Q2 CHEMISTRY, MEDICINAL 59 6 Q1 10
  • 11.
    IF & itsshortcomings • Citation pattern is discipline specific – Time span – Citation frequency – differences in citation norms • Sleeping beauties • Review Journals • Self-Citation! • Negative citations • Title and journal format changes • A questionable validity 11
  • 12.
    Probability density functionfor journals in subject categories of ENERGY & FUELS – data from JCR -5 -4 -3 -2 -1 0 1 2 3 4 5 Normal distribution Pareto distribution 12 IF is based on the arithmetic mean number of citations per paperThe reality of citation patterns is a Pareto distribution
  • 13.
    Articles on validityof IF • Dissecting our impact factor. Nature Materials 10, 645 (2011) doi:10.1038/nmat3114 • Bollen, Johan, et al. "A principal component analysis of 39 scientific impact measures." PloS one 4.6 (2009): e6022. • Priem, Jason, and Bradely H. Hemminger. "Scientometrics 2.0: New metrics of scholarly impact on the social Web." First Monday 15.7 (2010). 13
  • 14.
  • 15.
    Citation Networks &Network Effects 15
  • 16.
  • 17.
    High School Dating Network Bearman,Peter S., James Moody, and Katherine Stovel. "Chains of Affection: The Structure of Adolescent Romantic and Sexual Networks." American Journal of Sociology 110, no. 1 (July 2004): 44-91. 17
  • 18.
    Which network youwould rather be part of? West, J (2010). The EigenfactorTM Metrics: a network approach to assessing scholarly journals. http://mediazone.brighttalk.com/comm/ReedElsevier/ad0fb0ef1d- 21688-4348-23066 18 A B
  • 19.
    The Rich getsRicher •Journals are ranked according to the citation network. •Journals are influential when they are cited by other influential journals. •“The Eigenfactor™ score of a journal is an estimate of the percentage of time that researchers spend with that journal.” 19
  • 20.
  • 21.
    Article Influence™ Score Journal’sEigenfactor Score (5yrs) Number of articles in the journal Article Influence™ = Score 21
  • 22.
  • 23.
    e.g. of ArticleInfluence™ Score 23 http://www.eigenfactor.org/
  • 24.
    More on JournalRanking SJR • SCImago Journal Rank is weighted by the prestige of a journal. Subject field, quality and reputation of the journal have a direct effect on the value of a citation. • SJR normalizes for differences in citation behavior between subject fields. SNIP • Source Normalized Impact per Paper measures contextual citation impact by weighting citations based on the total number of citations in a subject field. • It corrects for differences in the frequency of citation across research fields. 24 4 years of data is required to calculate SJR and SNIP http://www.youtube.com/watch?v=ZQQIYBBMiUg&list=UUtm20B-NV4ShpVGj_5A8ukQ&index=8 Scopus
  • 25.
  • 26.
    Journal Ranking Summary IFEigenfactor® Score SNIP SJR indicator Sources Database JCR Eigenfactor Scopus/CWTS Scopus/SCImago Citation time frame 2 years 5 years 4 years 4 years Journal self- citation Included Excluded Limited Limited Citation Value Unweighted Weighted Weighted Weighted Connections NA Normalized by the number of identified references in the citing Journal Corrects for differences in the frequency of citation across research fields Normalized by the total number of references in the citing journal Adapted and modified from: González-Pereir , B. et al. “The SJR indicator: A new indicator of journals' scientific prestige”. http://arxiv.org/ftp/arxiv/papers/0912/0912.4141.pdf 26
  • 27.
  • 28.
    •Key metric: F1000Article Factors (FFa) •Medicine and Biology specific 28
  • 29.
    F1000 factors The F1000Article Factor (FFa) is calculated from the highest rating awarded by a Faculty Member (FM) plus an increment for each additional rating from other FMs. For example, a single article that has been evaluated by three Faculty Members, who rated it ‘Recommended’, ‘Must Read’ and ‘Must Read’, will have its FFa calculated thus: 8 (highest rating ‘Must Read’) + 2 (increment for ‘Must Read’) + 1 (increment for ‘Recommended’) = 11. Rating Value Increment Exceptional 10 3 Must Read 8 2 Recommended 6 1 29
  • 30.
  • 31.
  • 32.
    Citation overview fromScopus • The Citation Overview Results page lists documents that cited the document you selected from the Citation Overview. • You can include up to 5000 documents in a Citation Tracker. If you select more than 5000 documents only the first 5000 are included. • More http://trainingdesk.elsevier.com/videos/scopus- analyze-results-tool 32
  • 33.
  • 34.
  • 35.
  • 36.
    Harzing's Publish orPerish Publish or Perish is a software program that retrieves and analyzes academic citations. It uses Google Scholar to obtain the raw citations, then analyzes these and presents the following statistics: o Total number of papers o Total number of citations o Average number of citations per paper o Average number of citations per author o Average number of papers per author o Average number of citations per year o h-index and related parameters o An analysis of the number of authors per paper. 36Download and install Publish or Perish at http://www.harzing.com/pop.htm#download
  • 37.
  • 38.
    Google Scholar vs.WOS dataset • Transparency • Coverage o Better coverage for unique citations o Not limited to journal articles published in ISI listed journals o Greater geographical coverage for non-US/UK based journals o Better coverage of non-English sources • Includes more comprehensive data for junior academics 38
  • 39.
    Google Scholar vs.WOS dataset cont’ • Accounts for minor citation errors • Does not account for duplications • Includes non-scholarly citations such as student handbooks, library guides or editorial notes. • Unclear coverage o uneven coverage across different fields of study o older materials are not well covered 39
  • 40.
    A researcher’s H-indexis the largest possible number n for which n of the researcher’s publications have been cited at least n times. i.e. If a researcher has an h-index of 25 if 25 of their papers have been cited at least 25 times (See the graph in the handout). 40
  • 41.
    h-Index example Researcher AResearcher B Researcher C Researcher D Citations for most-cited article 3 5 14 8 Citations for second most- cited article 3 5 1 3 Citations for third most-cited article 3 5 0 2 Citations for fourth most- cited article 3 0 0 1 Citations for fifth most-cited article 3 0 0 1 Average citations per paper 3 3 3 3 H-index 3 3 1 2 41 Jarvey, P. (2012). Making Research Count: Analyzing Canadian Academic Publishing Cultures
  • 42.
    Citation Report fromWOS The Citation Report provides aggregate citation statistics for a set of search results. These statistics include: o The total number of times all items have been cited o The average number of times an item has been cited o The number of times an item has been cited each year o The average number of times an item has been cited in a year o More info 42
  • 43.
  • 44.
  • 45.
    Why h-Index • Itconsiders both productivity and impact. • It is not influenced by a small number of very successful articles, which may not be representative of a researcher’s career output. The H-index similarly discounts the value of papers that are not influential. • The H-index is simpler and easier to understand than many other compound bibliometric metrics. 45
  • 46.
    h-index shortcomings • Earlycareer researchers • Number of authors • Order of authorship • Sleeping beauties • the time since publication of individual articles • Databases are not error free • Inconsistency between different metric tools (See the handout). • The balance between number of publications vs. number of citations each receives 46 Adapted from Jarvey, P. (2012). Making Research Count: Analyzing Canadian Academic Publishing Cultures
  • 47.
    number of publicationsvs. number of citations each receives 47 Researcher A : 5 articles published – each cited 5 times Researcher B : 2 articles published – each cited 20 times Researcher A (5, 5, 5, 5, 5 ) = h-index = 5 Researcher B (20, 20) = h-index = 20
  • 48.
    Selected h-index Variants •g-index: more weight is given to the highest cited papers • individual h-index: accounts for co-authorship in calculating impact by giving less weight to such papers • contemporary h-index: less weight to older cited papers • i10 index : from Google Scholars, indicates the number of papers which have at least ten citations • age-weighted citation rate: accounts for the age of papers Tarma Software Research (2010). Publish or Perish User’s Manual http://www.harzing.com/pophelp/metrics.htm#gindex 48
  • 49.
    • “altmetrics isthe creation and study of new metrics based on the Social Web for analyzing, and informing scholarship.” http://altmetrics.org/manifesto/ PLoS Impact Explorer
  • 50.
    ImpactStory • Open Source •Metrics are computed based on the data sources aggregated from various social media tools • The first 1000 items you register are free • Covers diverse products including slides, articles, software, dataset, etc • It does not provide comprehensive impact • It is in Beta format • e.g. http://impactstory.org/collection/fdtpk4
  • 51.
    51 Usage - Downloads,views, book holdings, ILL, document delivery Captures - Favorites, bookmarks, saves, readers, groups, watchers Mentions - blog posts, news stories, Wikipedia articles, comments, reviews Social media - Tweets, +1's, likes, shares, ratings Citations - PubMed, Scopus, patents
  • 52.
  • 53.
  • 54.
    Google Scholar ResearchersProfiles http://www.google.ca/intl/en/scholar/citations.html
  • 55.
  • 56.
    Open Researcher andContributor ID 56 • Open Researcher ID - is an initiative to provide researchers and scholars with a persistent, unique identifier. http://about.orcid.org/ http://trainingdesk.elsevier.com/videos/scopus- creating-an-orcid-record-from-your-scopus- author-id
  • 57.
    WOS Scopus CWTS/Scopus Journal indicator POPJCR Eigen Factor SCImago Article Analysis Yes Yes Yes Author Analysis Yes Yes Yes Journal Ranking Yes Yes Yes Yes Yes Yes Yes Country Ranking Yes Which metric tool? Adapted form https://dspace.ndlr.ie/jspui/handle/10633/27390 57
  • 58.
    More info: • Guide http://researchguides.library.syr.edu/content.php?p id=194034&sid=3337810 •MyRI Bibliometrics Toolkit http://www.youtube.com/user/NDLRMyRI/videos http://www.ndlr.ie/myri/ • Research Trends http://www.researchtrends.com/?s=bibliometric&x =6&y=7&cat=-1 58
  • 59.
    Questions Need library relatedassistance? Please don’t hesitate to contact us: Nazi Torabi 519-661-2111 x88992 ntorabi@uwo.ca 59 http://www.lib.uwo.ca/chat/