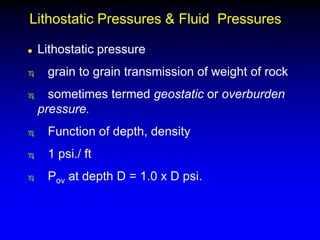
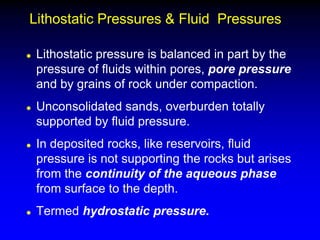
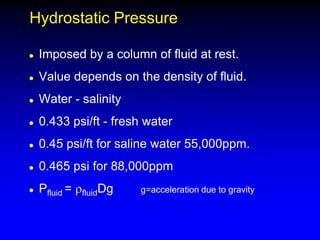
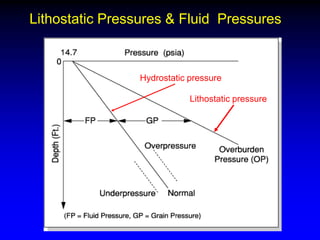
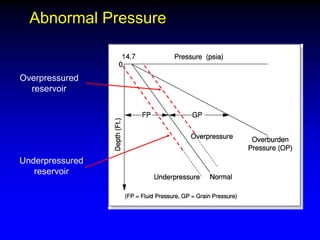
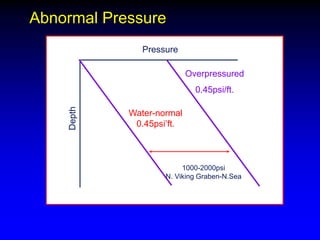
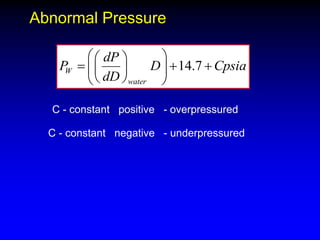
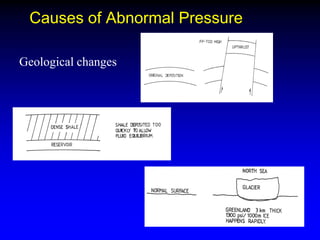
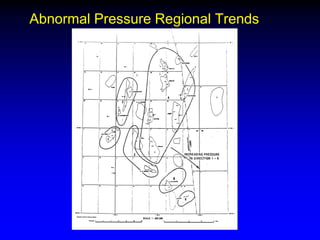
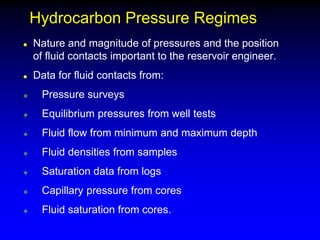
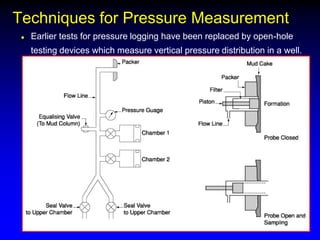
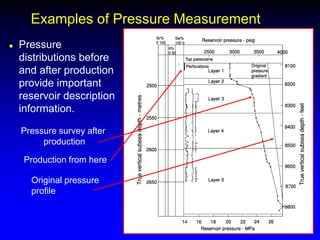
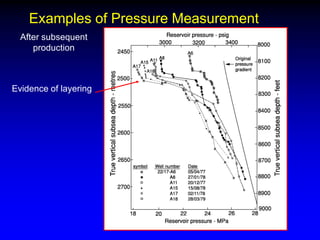
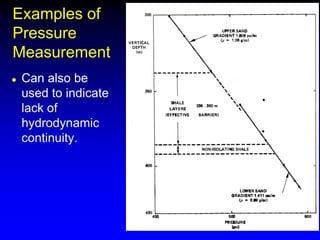
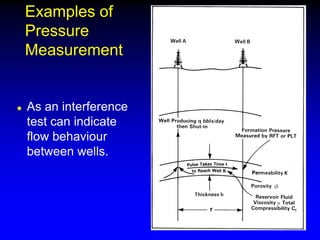
Reservoir Pressures
Reservoir Pressures
Adrian C Todd
Heriot
Heriot-
-Watt University
Watt University
INSTITUTE OF PETROLEUM ENGINEERING
Heriot
Heriot-
-Watt University
Watt University
INSTITUTE OF PETROLEUM ENGINEERING
Reservoir Pressures
Reservoir Pressures
 Magnitude and variation of pressures in a
reservoir are an important aspect of reservoir
understanding during exploration and
production phase
Reservoir Pressures
Reservoir Pressures
 Oil and gas occur at a range of sub-surface
depths.
 At these depths pressure exists as a result of:
– the depositional process
– the fluids contained.
Lithostatic Pressures & Fluid Pressures
 Lithostatic pressure
 grain to grain transmission of weight of rock
 sometimes termed geostatic or overburden
pressure.
 Function of depth, density
 1 psi./ ft
 Pov at depth D = 1.0 x D psi.
Lithostatic Pressures & Fluid Pressures
 Lithostatic pressure is balanced in part by the
pressure of fluids within pores, pore pressure
and by grains of rock under compaction.
 Unconsolidated sands, overburden totally
supported by fluid pressure.
 In deposited rocks, like reservoirs, fluid
pressure is not supporting the rocks but arises
from the continuity of the aqueous phase
from surface to the depth.
 Termed hydrostatic pressure.
Hydrostatic Pressure
 Imposed by a column of fluid at rest.
 Value depends on the density of fluid.
 Water - salinity
 0.433 psi/ft - fresh water
 0.45 psi/ft for saline water 55,000ppm.
 0.465 psi for 88,000ppm
 Pfluid = rfluidDg g=acceleration due to gravity
Lithostatic Pressures & Fluid Pressures
Hydrostatic pressure
Lithostatic pressure
Hydrodynamic Pressure
 Arises as a result of fluid movement.
 This is the fluid potential pressure gradient
which is caused by fluid flow
Fluid Pressure
Dictated by prevailing water pressure in vicinity of reservoir.
Normal situation
dP/dD is the hydrostatic gradient
Assumes continuity of water pressure from surface
and constant salinity
If pressure extrapolated to zero depth is atmospheric
pressure
- normal pressured reservoir
14.7
W
water
dP
P D psia
dD
 
 
 
 
 
 
 
Fluid Pressure-Normal Pressure
Atmos. Pressure
0 psig.
14.7psia.
Normal pressured
reservoir
Fluid Pressure-Abnormal Pressure
 Under certain conditions fluid pressures are not
normal.
 Overpressured reservoirs.
 Hydrostatic pressure greater than normal
pressure
 Underpressured reservoirs
 Hydrostatic pressure below normal pressure
Abnormal Pressure
Overpressured
reservoir
Underpressured
reservoir
Abnormal Pressure
Pressure
Water-normal
0.45psi’ft.
Overpressured
0.45psi/ft.
1000-2000psi
N. Viking Graben-N.Sea
Abnormal Pressure
14.7
W
water
dP
P D Cpsia
dD
 
 
  
 
 
 
 
C - constant positive - overpressured
C - constant negative - underpressured
Causes of Abnormal Pressure
 Thermal effects-expansion or contraction of
water
 Rapid burial of sediments
 Geological changes.
 Osmotic effects via salinity differences
Causes of Abnormal Pressure
Geological changes
Abnormal Pressure Regional Trends
North Sea
Examples
Fluid Pressures-Hydrocarbon Systems
 Hydrocarbon pressure regimes different since
densities of oil and gas are less than water.
0.45 /
water
dP
psi ft
dD
 

 
 
0.35 /
oil
dP
psi ft
dD
 

 
 
0.08 /
dP
gas psi ft
dD
 

 
 
Pressure
Depth
0
Pressure distribution for an oil reservoir with a
gas-cap and oil water contact.
Impermeable
bed
Path of well
Pressure
Gradient in
aquifer
Gradient in oil
column
Gradient in gas
column
Over pressured
reservoir
Pressure distribution for an oil reservoir with a
gas-cap and oil water contact.
Hydrocarbon Pressure Regimes
 Nature and magnitude of pressures and the position
of fluid contacts important to the reservoir engineer.
 Data for fluid contacts from:
 Pressure surveys
 Equilibrium pressures from well tests
 Fluid flow from minimum and maximum depth
 Fluid densities from samples
 Saturation data from logs
 Capillary pressure from cores
 Fluid saturation from cores.
Techniques for Pressure Measurement
 Earlier tests for pressure logging have been replaced by open-hole
testing devices which measure vertical pressure distribution in a well.
Examples of Pressure Measurement
 Pressure
distributions before
and after production
provide important
reservoir description
information.
Production from here
Original pressure
profile
Pressure survey after
production
Examples of Pressure Measurement
After subsequent
production
Evidence of layering
Examples of
Pressure
Measurement
 Can also be
used to indicate
lack of
hydrodynamic
continuity.
Examples of
Pressure
Measurement
 As an interference
test can indicate
flow behaviour
between wells.
Reservoir Temperature
 Earth temperature increases from surface to centre
 Heatflow outwards generates a geothermal gradient.
 Conforms to local and regional gradients as influenced by
lithology, and more massive phenomena.
 Obtained from wellbore temperature surveys.
 Reservoir geothermal gradients around 1.6oF/100ft (
0.029K/m).
 Because of large thermal capacity and surface area of
porous reservoir, flow processes in a reservoir occur at
constant temperature.
 Local conditions , eg around the well can be influenced by
transient cooling or heating effects of injected fluids.
Res Eng PP Ch2(2).pdf

Res Eng PP Ch2(2).pdf

  • 1.
    Reservoir Pressures Reservoir Pressures AdrianC Todd Heriot Heriot- -Watt University Watt University INSTITUTE OF PETROLEUM ENGINEERING Heriot Heriot- -Watt University Watt University INSTITUTE OF PETROLEUM ENGINEERING
  • 2.
    Reservoir Pressures Reservoir Pressures Magnitude and variation of pressures in a reservoir are an important aspect of reservoir understanding during exploration and production phase
  • 3.
    Reservoir Pressures Reservoir Pressures Oil and gas occur at a range of sub-surface depths.  At these depths pressure exists as a result of: – the depositional process – the fluids contained.
  • 4.
    Lithostatic Pressures &Fluid Pressures  Lithostatic pressure  grain to grain transmission of weight of rock  sometimes termed geostatic or overburden pressure.  Function of depth, density  1 psi./ ft  Pov at depth D = 1.0 x D psi.
  • 5.
    Lithostatic Pressures &Fluid Pressures  Lithostatic pressure is balanced in part by the pressure of fluids within pores, pore pressure and by grains of rock under compaction.  Unconsolidated sands, overburden totally supported by fluid pressure.  In deposited rocks, like reservoirs, fluid pressure is not supporting the rocks but arises from the continuity of the aqueous phase from surface to the depth.  Termed hydrostatic pressure.
  • 6.
    Hydrostatic Pressure  Imposedby a column of fluid at rest.  Value depends on the density of fluid.  Water - salinity  0.433 psi/ft - fresh water  0.45 psi/ft for saline water 55,000ppm.  0.465 psi for 88,000ppm  Pfluid = rfluidDg g=acceleration due to gravity
  • 7.
    Lithostatic Pressures &Fluid Pressures Hydrostatic pressure Lithostatic pressure
  • 8.
    Hydrodynamic Pressure  Arisesas a result of fluid movement.  This is the fluid potential pressure gradient which is caused by fluid flow
  • 9.
    Fluid Pressure Dictated byprevailing water pressure in vicinity of reservoir. Normal situation dP/dD is the hydrostatic gradient Assumes continuity of water pressure from surface and constant salinity If pressure extrapolated to zero depth is atmospheric pressure - normal pressured reservoir 14.7 W water dP P D psia dD              
  • 10.
    Fluid Pressure-Normal Pressure Atmos.Pressure 0 psig. 14.7psia. Normal pressured reservoir
  • 11.
    Fluid Pressure-Abnormal Pressure Under certain conditions fluid pressures are not normal.  Overpressured reservoirs.  Hydrostatic pressure greater than normal pressure  Underpressured reservoirs  Hydrostatic pressure below normal pressure
  • 12.
  • 13.
  • 14.
    Abnormal Pressure 14.7 W water dP P DCpsia dD                C - constant positive - overpressured C - constant negative - underpressured
  • 15.
    Causes of AbnormalPressure  Thermal effects-expansion or contraction of water  Rapid burial of sediments  Geological changes.  Osmotic effects via salinity differences
  • 16.
    Causes of AbnormalPressure Geological changes
  • 17.
  • 18.
  • 19.
    Fluid Pressures-Hydrocarbon Systems Hydrocarbon pressure regimes different since densities of oil and gas are less than water. 0.45 / water dP psi ft dD        0.35 / oil dP psi ft dD        0.08 / dP gas psi ft dD        Pressure Depth 0
  • 20.
    Pressure distribution foran oil reservoir with a gas-cap and oil water contact. Impermeable bed Path of well Pressure Gradient in aquifer Gradient in oil column Gradient in gas column Over pressured reservoir
  • 21.
    Pressure distribution foran oil reservoir with a gas-cap and oil water contact.
  • 22.
    Hydrocarbon Pressure Regimes Nature and magnitude of pressures and the position of fluid contacts important to the reservoir engineer.  Data for fluid contacts from:  Pressure surveys  Equilibrium pressures from well tests  Fluid flow from minimum and maximum depth  Fluid densities from samples  Saturation data from logs  Capillary pressure from cores  Fluid saturation from cores.
  • 23.
    Techniques for PressureMeasurement  Earlier tests for pressure logging have been replaced by open-hole testing devices which measure vertical pressure distribution in a well.
  • 24.
    Examples of PressureMeasurement  Pressure distributions before and after production provide important reservoir description information. Production from here Original pressure profile Pressure survey after production
  • 25.
    Examples of PressureMeasurement After subsequent production Evidence of layering
  • 26.
    Examples of Pressure Measurement  Canalso be used to indicate lack of hydrodynamic continuity.
  • 27.
    Examples of Pressure Measurement  Asan interference test can indicate flow behaviour between wells.
  • 28.
    Reservoir Temperature  Earthtemperature increases from surface to centre  Heatflow outwards generates a geothermal gradient.  Conforms to local and regional gradients as influenced by lithology, and more massive phenomena.  Obtained from wellbore temperature surveys.  Reservoir geothermal gradients around 1.6oF/100ft ( 0.029K/m).  Because of large thermal capacity and surface area of porous reservoir, flow processes in a reservoir occur at constant temperature.  Local conditions , eg around the well can be influenced by transient cooling or heating effects of injected fluids.