Chapter 3 -consolidation notes
•Download as DOCX, PDF•
3 likes•301 views

consolidation chapter notes for Shivaji University

Recommended
Recommended
More Related Content
What's hot
What's hot (20)
Similar to Chapter 3 -consolidation notes
Similar to Chapter 3 -consolidation notes (20)
More from DYPCET
More from DYPCET (17)
Recently uploaded
Recently uploaded (20)
Chapter 3 -consolidation notes
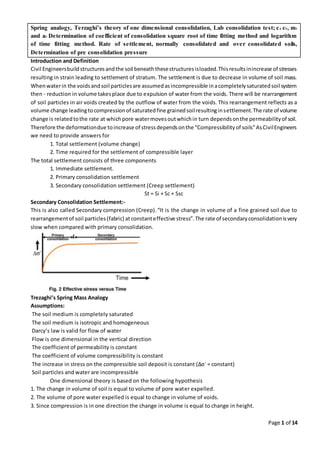
- 1. Page 1 of 14 Spring analogy, Terzaghi’s theory of one dimensional consolidation, Lab consolidation test; cc cv, mv and av Determination of coefficient of consolidation square root of time fitting method and logarithm of time fitting method. Rate of settlement, normally consolidated and over consolidated soils, Determination of pre consolidation pressure Introduction and Definition Civil Engineersbuildstructuresandthe soil beneaththesestructuresisloaded.Thisresultsinincrease of stresses resulting in strain leading to settlement of stratum. The settlement is due to decrease in volume of soil mass. Whenwaterin the voidsandsoil particlesare assumedasincompressible inacompletelysaturatedsoil system then - reduction in volume takesplace due to expulsion of water from the voids. There will be rearrangement of soil particles in air voids created by the outflow of water from the voids. This rearrangement reflects as a volume change leadingtocompressionof saturatedfine grainedsoilresultinginsettlement.The rate of volume change is relatedtothe rate at whichpore watermovesoutwhichin turn dependsonthe permeabilityof soil. Therefore the deformationdue toincrease of stressdependsonthe “Compressibilityof soils”AsCivilEngineers we need to provide answers for 1. Total settlement (volume change) 2. Time required for the settlement of compressible layer The total settlement consists of three components 1. Immediate settlement. 2. Primary consolidation settlement 3. Secondary consolidation settlement (Creep settlement) St = Si + Sc + Ssc Secondary Consolidation Settlement:- This is also called Secondary compression (Creep).“It is the change in volume of a fine grained soil due to rearrangementof soil particles(fabric) atconstanteffective stress”.The rate of secondaryconsolidationisvery slow when compared with primary consolidation. Trezaghi’s Spring Mass Analogy Assumptions: The soil medium is completely saturated The soil medium is isotropic and homogeneous Darcy’s law is valid for flow of water Flow is one dimensional in the vertical direction The coefficient of permeability is constant The coefficient of volume compressibility is constant The increase in stress on the compressible soil deposit is constant (∆σ´ = constant) Soil particles and water are incompressible One dimensional theory is based on the following hypothesis 1. The change in volume of soil is equal to volume of pore water expelled. 2. The volume of pore water expelled is equal to change in volume of voids. 3. Since compression is in one direction the change in volume is equal to change in height.
- 2. Page 2 of 14 T=0 σ = u and σ´=0 Soil=Spring Water= Water Void After application of load - primary consolidation Start 0<T<∞ σ = u + σ´ All the loadisresistedbywater flow is in upward direction reduction in volume Spring doesn’t carry any load Water carry external pressure T = ∞ All the load is resisted by spring Water doesn’t carry any load End of consolidation Soil solids carry external pressure Excess pore water pressure is zero End of primary consolidation Theory Terzaghi’s model consists of a cylindrical vessel with a piston attached to spring as shown. The space betweenspringsisfilledwithwater.The piston isperforated to allow for passage of water. Piezometers can be inserted at different locations to measure the pressure head due to excess pore water pressure. Terzaghi has correlated the spring mass compression process with the consolidation of saturatedclay subjected to external load σ. The springs and the surrounding water represent the saturated soil. The springs representthe soil skeleton networks of soil grainsand water in the vessels represents the water in the voids. In this arrangement the compression is one dimensional and flow will be in the vertical direction. When pressure σ is applied this will be borne by water surrounding the spring σ = u at time t =0 u is called excess hydrostatic pressure due to this water level in all the Piezometer reach the same height ‘h’ given by h = u/γw σ = u and σ´=0 at time t =0 and there will be no volume change. After some time ‘t’ there will be flow of water through perforation. Since the flow is in upward direction/segment there will be reduction in volume Due to this springs get compressed and they being to carry a portion of the applied load. Thissignifiesareductioninexcesshydrostaticpressure orpore water pressureandincrease in effective stress. Attime t= ∞ whennomore pore waterflowsoutthe excesshydrostaticpressurewillbe andthe entire load is carried by spring. σ = σ’ and u=0` at time t =∞ Lab consolidation test The test is conducted to determine the settlement due to primary consolidation. To determine : Rate of consolidation under normal load. Degree of consolidation at any time. Pressure-voidratiorelationship.
- 3. Page 3 of 14 Coefficient of consolidation at various pressures. Compression index. From the above information it will be possible for us to predict the time rate and extent of settlement of structures founded on fine-grained soils. It is also helpful in analyzing the stress history of soil. Since the settlement analysis of the foundation depends mainly on the values determined by the test, this test is very important for foundation design. Principal Involved Whenacompressiveloadisappliedtosoilmass,adecreaseinitsvolumetakesplace,the decreaseinvolume of soil mass under stress is known as compression and the property of soil mass pertaining to its tendency to decrease in volume under pressure is known as compressibility. In a saturated soil mass having its void filled withincompressible water,decrease involumeorcompressioncantake place whenwaterisexpelledoutof the voids. Such a compression resulting from a long time static load and the consequent escape of pore water is termed as consolidation. Procedure 1] Saturate two porous stones by keeping them submerged in the distilled water for 4 to 8 hrs. Wipe away excess water. 2] Assemble the consolidometer, with the soil specimen and porous stones at top and bottom of specimen, providingafilterpaperbetweenthe soil specimenandporousstone.Positionthe pressure padcentrallyon the top porous stone. 3] Mount the mould assembly on the loading frame, and center it such that the load applied is axial. 4] Positionthe dial gauge to measure the vertical compressionof the specimen.The dial gauge holdershould be setso that the dial gauge is in the beggingof itsreleasesrun,allowingsufficientmarginforthe swelling of the soil, if any. 5] Connectthe mouldassemblytothe waterreservoirandthe sample isallowedtosaturate.The level of the water in the reservoir should be at about the same level as the soil specimen. 6] Applyan initial loadtothe assembly.The magnitude of thisloadshouldbe chosenby trial,such that there is no swelling. 7] The loadshouldbe allowedtostanduntilthereisnochange indial gaugereadingsfortwoconsecutive hours or for a maximum of 24 hours. 8] Note the final dial readingunderthe initialload.Applyfirstloadof intensity0.1kg/cm2 startthe stopwatch simultaneously.Recordthe dial gauge readingsat varioustime intervals.The dial gauge readingsare taken until 90% consolidation is reached. Primary consolidation is gradually reached within 24 hrs. 9] At the endof the period,specifiedabove take the dial readingand time reading.Double the loadintensity and take the dial readings at various time intervals. Repeat this procedure for successive load increments. The usual loading intensity are as follows : a. 0.1, 0.2, 0.5, 1, 2, 4 and 8 kg/cm2.
- 4. Page 4 of 14 10] Afterthe lastloadingiscompleted,reduce the loadto half of the value of the lastloadand allow itto stand for 24 hrs. Reduce the load further in steps of half the previous intensitytill an intensityof 0.1 kg/cm2is reached. Take the final reading of the dial gauge. 11] Reduce the load to the initial load, keep it for 24 hrs and note the final readings of the dial gauge. 12] Quicklydismantle the specimenassemblyandremove the excesswateronthe soil specimeninoven,note the dry weight of it. Analysis: (1) Calculate the initial water content and specific gravity of the soil. (2) For eachpressure increment,constructasemi-logplotof the consolidationdial readingsversusthelogtime (in minutes). Determine the coefficient of consolidation (cv). (3) Calculate the voidratio at the endof primaryconsolidationforeach pressure increment.Plotlogpressure versusvoidratio.Basedonthisplot,calculate compressionindex,recompressionindex andpreconsolidation pressure (maximum past pressure). Determination of coefficient of consolidation (Cv) from laboratory data The coefficient of three graphical procedure are used Logarithm of time method Square root of time method Hyperbola method Log – time curve fitting method The basisforthismethodisthe theoretical (Uz) versuslogTv curve and experimental dial gauge reading and log(t) curves are similar. Steps i. Plot the dial reading of compression for a givenpressure increment versus time to log scale as shown in figure. ii. Plot two points P and Q on the upper portion of the consolidation curve (say compression line) corresponding to time t 1 and t 2 such that t2 = 4 t1 iii. Let x be the difference in dial reading between P and Q. locate R at a vertical distance x above point P iv. Draw a horizontal line RS the dial reading corresponding to this line is d 0 which corresponds with 0% consolidation. v. Project the straight line portion of primary and secondary consolidation to intersect at point T. The dial reading corresponding to T is d 100 and this corresponds to 100% consolidation. vi. Determine the point V on the consolidation curve which corresponds to the dial reading of d50 = (d0 +d100)/2 . The time corresponding to point V is t 50 i.e time for 50% consolidation. Square root of time method i. Plotthe dial readingandthe correspondingsquare-root-of-time 𝑡asshownin Figure ii. Draw the tangentPQ to the earlyportionof the plot. iii. Draw a line PRsuch that OR = (1.15)(OQ). iv. The abscissaof the pointS (i.e.,the intersectionof PRand the consolidationcurve) will give √𝑡90 ( i.e., the square-root-of-time for90%consolidation).
- 5. Page 5 of 14 v. The value of 𝑇 𝑣 for Uav = 90% 𝑖𝑠 0.848. so, Log – time curve fitting method
- 6. Page 6 of 14 Square root of time method
- 7. Page 7 of 14 Soil Compressibility A laboratorysoil specimenof dia60mmandheight20mmisextractedfromthe undisturbedsoil sample obtained from the field. This sample is subjected to 1D consolidation in the lad under various pressure increments.Eachpressure incrementismaintainedfor24 hrs and equilibriumvoidratioisrecordedbeforethe applicationof the nextpressure increment.Thenaplotof voidratio versuseffectivestressismade asshownin Fig7 and8. Whenthe sample isrecompressedfrompointDitfollowsDEandbeyondCitmergesalongBCFand it compresses as it moves along BCF Duringthe initial stages(atloweffective stress) samplefollowsrecompressionpath(portionAB) andundergoes lesscompression.Beyondthisisthe virgincompressionline(portionBC) alsocalledthe normalcompressionline and the sample undergoes large compression. 1. BC – Virgin compression curve also called normal consolidation line 2. From ‘C’ when the sample is unloaded, sample expands and traces path CD (expansion curve unloading) 3. Sample undergoesPermanentstraindue to irreversible soil structure and there is a small elastic recovery. 4. The deformation recovered is due to elastic rebound
- 8. Page 8 of 14 5. When the sample is reloaded-reloading curve lies above the rebound curve and makes an hysteresis loop between expansion and reloading curves. 6. The reloaded soils shows less compression. 7. Loading beyond ‘C’ makes the curve to merge smoothly into portion EF as if the soil is not unloaded. Preconsolidation Pressure σpc´ It is the maximum effective stress experienced by a soil in its stress history (past existence) For the soil loaded along the recompression curve AB the effective stress close to point B will be the preconsolidation pressure. If the soil iscompressedalongBCandunloadedalongCDandthenreloadedalongDCthe effectivestress close to point C will be the new preconsolidation pressure. Effect of Stress History It is based on the stress history (preconsolidation pressure) soils are classified as 1. Normally Consolidated Soils 2. Over Consolidated Soils 3. Under Consolidated Soils
- 9. Page 9 of 14 NormallyConsolidatedSoilsItisasoil depositthathasneversubjectedtoavertical effective stressgreaterthan the present vertical stress. Under Consolidated Soils A soil deposit that has not consolidated under the present overburden pressure (effective stress) iscalledUnderConsolidatedSoil.These soilsare susceptible tolargerdeformationandcause distress in buildings built on these deposits. Over ConsolidatedSoils It is a soil depositthathas beensubjectedtovertical effective stressgreaterthan the present vertical effective stress. Determination of Preconsolidation Pressure (Yield Stress) Step 1. Conduct an oedometer test on the undisturbed soil sample obtained from the field. Step 2. Plote - logσ´ plotas shown.The equilibriumvoidratioat the endof each of the pressure increments are used in obtaining e - log σ´ plot. Step 3. Select the point of maximum curvature (Point A) on the e - log σ´ curve Step 4. Draw a tangent at the point of maximum curvature (Point A) Step 5. Draw a horizontal line AC Step 6. Draw the bisector line AD between the tangent and horizontal line Step 7. Extend the normally consolidated line to intersect the bisector line at ‘O’ Step 8. The vertical effectivestresscorrespondingtopointof intersection(O) isthe preconsolidationpressure (σ´pc) Compressibility Characteristics The compressibilityof soils under one-dimensional compression can be described from the decrease in the volume of voids with the increase of effective stress. This relation of void ratio and effective stress can be depicted either as an arithmetic plot or a semi-log plot. It can be said that the compressibility of a soil decreases as the effective stress increases. This can be represented by the slope of the void ratio – effective stress relation, which is called the coefficient of compressibility, av. 𝑎 𝑣 = 𝑒1 − 𝑒2 𝜎2 ′ − 𝜎1 ′ O
- 10. Page 10 of 14 Co-efficient of volume compressibility (mv) It is the ratio of change in volume of a soil per unit initial volume due to unit increase in effective stress and is given by 𝑚 𝑣 = 𝑎 𝑣 1+ 𝑒 𝑜 Coefficientofcompression/compression index(Cc):It isthe slope of the normal consolidationline inaplotof void ratio-logarithm of effective stress (e - logσ´). It is given by Empirical correlations Cc = 0.009 (LL-10) Undisturbed clays Cc = 0.007 (LL-10) Remoulded soil sample Cc = 1.15 (e0-0.30) Upper bound values Cc = 0.30 (e0-0.27) Lower bound values The value of Cc is constant for a given soil. The compression index is used to determine primary consolidation settlement of normally consolidated soils. A high value of Cc indicates high compressibility and higher consolidation settlement.
- 11. Page 11 of 14 20 mm thick undisturbed sample of saturated clay is tested in laboratory with drainage allowed through top and bottom. Sample reaches 50% consolidation in 35 minutes. If clay layer from which sample was obtained is 3.0 m thick and is free to drain through top and bottom surfaces, calculate the time required for same degree of consolidation in the field. What is the time required if the drainage in the field is only through the top?
- 12. Page 12 of 14
- 13. Page 13 of 14
- 14. Page 14 of 14