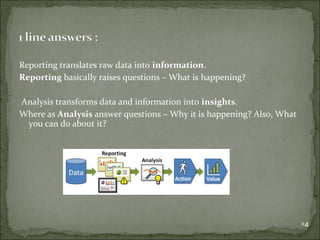
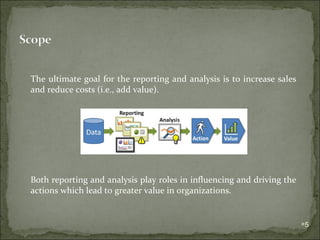
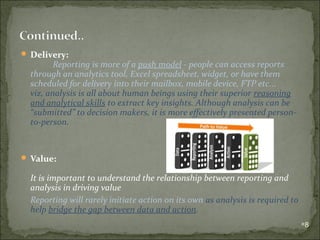
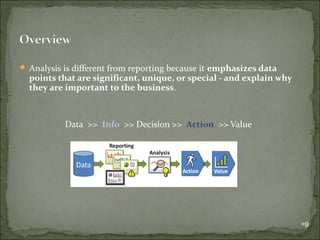
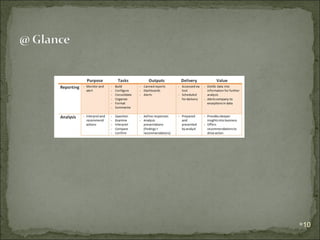
Abhijith Ramalingaiah
Did you know?
Looking for 1 line answers?
Scope
Slice & Dice
Overview
@ Glance!

2
Reports are like robot! can monitor and alert you. Analysis is like
parent – can figure out what’s going on (hungry, dirty diaper, no
pacifier, teething, tired, ear infection etc..
 Reporting & Analysis go hand-in-hand.

Reporting provides no or limited context about what’s
happening in the data.. Context is critical to good analysis. In order
to tell a meaningful story with the data to drive specific actions,
context becomes an essential component of the storyline.
3
Reporting translates raw data into information.
Reporting basically raises questions – What is happening?
Analysis transforms data and information into insights.
Where as Analysis answer questions – Why it is happening? Also, What
you can do about it?

4
The ultimate goal for the reporting and analysis is to increase sales
and reduce costs (i.e., add value).

Both reporting and analysis play roles in influencing and driving the
actions which lead to greater value in organizations.

5
Lets slice & dice for more clarity, by - Purpose, Tasks, Outputs,
Delivery & Value.
 Purpose:

Good reporting should raise questions about the business from its end
users.
The goal of analysis is to answer questions by interpreting the data at a
deeper level and providing actionable recommendations.
In summary, reporting shows you what is happening while analysis focuses on
explaining why it is happening and what you can do about it.

 Tasks:

Building, configuring, consolidating, organizing, formatting, and
summarizing.
Questioning, examining, interpreting, comparing, and confirming.

6
 Outputs:

Reporting follows a push approach, where reports are pushed to
users who are then expected to extract meaningful insights and take
appropriate actions for themselves (i.e., self-serve).
Three main types of reporting: canned reports, dashboards,
and alerts.
In contrast, analysis follows a pull approach, where particular
data is pulled by an analyst in order to answer specific business
questions.
Two main types: ad-hoc responses & analysis presentations.
7
 Delivery:

Reporting is more of a push model - people can access reports
through an analytics tool, Excel spreadsheet, widget, or have them
scheduled for delivery into their mailbox, mobile device, FTP etc...
viz, analysis is all about human beings using their superior reasoning
and analytical skills to extract key insights. Although analysis can be
“submitted” to decision makers, it is more effectively presented personto-person.

 Value:

It is important to understand the relationship between reporting and
analysis in driving value
Reporting will rarely initiate action on its own as analysis is required to
help bridge the gap between data and action.
8
 Analysis is different from reporting because it emphasizes data

points that are significant, unique, or special - and explain why
they are important to the business.

Data >> Info >> Decision >> Action >> Value

9
10
11

Reports vs analysis

  • 1.
  • 2.
    Did you know? Lookingfor 1 line answers? Scope Slice & Dice Overview @ Glance! 2
  • 3.
    Reports are likerobot! can monitor and alert you. Analysis is like parent – can figure out what’s going on (hungry, dirty diaper, no pacifier, teething, tired, ear infection etc..  Reporting & Analysis go hand-in-hand. Reporting provides no or limited context about what’s happening in the data.. Context is critical to good analysis. In order to tell a meaningful story with the data to drive specific actions, context becomes an essential component of the storyline. 3
  • 4.
    Reporting translates rawdata into information. Reporting basically raises questions – What is happening? Analysis transforms data and information into insights. Where as Analysis answer questions – Why it is happening? Also, What you can do about it? 4
  • 5.
    The ultimate goalfor the reporting and analysis is to increase sales and reduce costs (i.e., add value). Both reporting and analysis play roles in influencing and driving the actions which lead to greater value in organizations. 5
  • 6.
    Lets slice &dice for more clarity, by - Purpose, Tasks, Outputs, Delivery & Value.  Purpose: Good reporting should raise questions about the business from its end users. The goal of analysis is to answer questions by interpreting the data at a deeper level and providing actionable recommendations. In summary, reporting shows you what is happening while analysis focuses on explaining why it is happening and what you can do about it.  Tasks: Building, configuring, consolidating, organizing, formatting, and summarizing. Questioning, examining, interpreting, comparing, and confirming. 6
  • 7.
     Outputs: Reporting followsa push approach, where reports are pushed to users who are then expected to extract meaningful insights and take appropriate actions for themselves (i.e., self-serve). Three main types of reporting: canned reports, dashboards, and alerts. In contrast, analysis follows a pull approach, where particular data is pulled by an analyst in order to answer specific business questions. Two main types: ad-hoc responses & analysis presentations. 7
  • 8.
     Delivery: Reporting ismore of a push model - people can access reports through an analytics tool, Excel spreadsheet, widget, or have them scheduled for delivery into their mailbox, mobile device, FTP etc... viz, analysis is all about human beings using their superior reasoning and analytical skills to extract key insights. Although analysis can be “submitted” to decision makers, it is more effectively presented personto-person.  Value: It is important to understand the relationship between reporting and analysis in driving value Reporting will rarely initiate action on its own as analysis is required to help bridge the gap between data and action. 8
  • 9.
     Analysis isdifferent from reporting because it emphasizes data points that are significant, unique, or special - and explain why they are important to the business. Data >> Info >> Decision >> Action >> Value 9
  • 10.
  • 11.