Introduction
• Renal Dopplerultrasound is a routinely performed study
• It is a useful technique for evaluating a wide range of renal
pathologic conditions.
• An understanding of normal anatomy, important anatomic variants,
as well as basic physical concepts, are necessary for correct
interpretation of renal doppler ultrasound
• This presntation outlines the vascular anatomy, imaging
indications, and technique and briefly reviews some of the
common pathologies where it may be used by an interprofessional
team
3.
OBJECTIVES
At the endof the presentation participants should be able
to :
• Recap the anatomy of native renal vessels
• Understand the principles of renal doppler examination
• Apply the right technique for renal doppler examinations
• Understand renal doppler protocols
• Evaluate some vascular disorders
4.
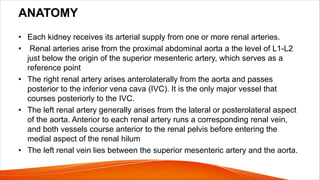
ANATOMY
• Each kidneyreceives its arterial supply from one or more renal arteries.
• Renal arteries arise from the proximal abdominal aorta a the level of L1-L2
just below the origin of the superior mesenteric artery, which serves as a
reference point
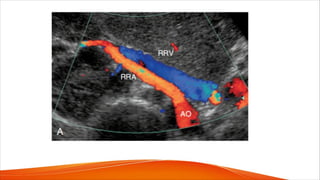
• The right renal artery arises anterolaterally from the aorta and passes
posterior to the inferior vena cava (IVC). It is the only major vessel that
courses posteriorly to the IVC.
• The left renal artery generally arises from the lateral or posterolateral aspect
of the aorta. Anterior to each renal artery runs a corresponding renal vein,
and both vessels course anterior to the renal pelvis before entering the
medial aspect of the renal hilum
• The left renal vein lies between the superior mesenteric artery and the aorta.
7.
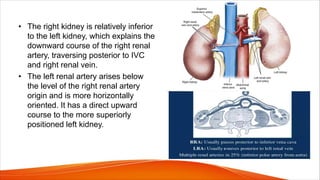
• The rightkidney is relatively inferior
to the left kidney, which explains the
downward course of the right renal
artery, traversing posterior to IVC
and right renal vein.
• The left renal artery arises below
the level of the right renal artery
origin and is more horizontally
oriented. It has a direct upward
course to the more superiorly
positioned left kidney.
9.
ANATOMICAL VARIANTS
• Themost common and most significant anatomic variants of the
renal venous system are:
• A circumaortic left renal vein, when one of the limbs of the left
renal vein courses anterior to the aorta and another runs posterior
to it;
• A retroaortic left renal vein, when the left main renal vein lies
posterior to the aorta. No other vessels course behind the aorta,
and when a vascular structure is seen behind the aorta, a renal
vein anomaly should be considered
• There could also be multiple renal veins
12.
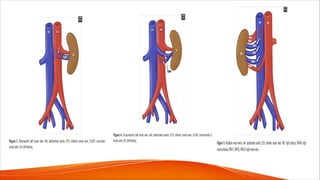
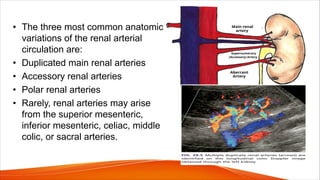
• The threemost common anatomic
variations of the renal arterial
circulation are:
• Duplicated main renal arteries
• Accessory renal arteries
• Polar renal arteries
• Rarely, renal arteries may arise
from the superior mesenteric,
inferior mesenteric, celiac, middle
colic, or sacral arteries.
14.
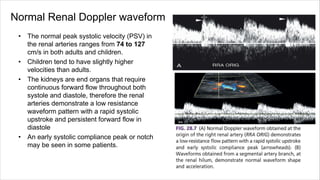
Normal Renal Dopplerwaveform
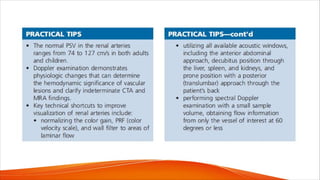
• The normal peak systolic velocity (PSV) in
the renal arteries ranges from 74 to 127
cm/s in both adults and children.
• Children tend to have slightly higher
velocities than adults.
• The kidneys are end organs that require
continuous forward flow throughout both
systole and diastole, therefore the renal
arteries demonstrate a low resistance
waveform pattern with a rapid systolic
upstroke and persistent forward flow in
diastole
• An early systolic compliance peak or notch
may be seen in some patients.
15.
INDICATIONS
• Young patientswith severe hypertension
• Patients with abrupt onset of hypertension rapidly accelerating hypertension, or malignant
• hypertension;
• Patients with refractory hypertension that is difficult to control despite a suitable treatment
program (a type of high blood pressure that remains uncontrolled even when taking five or
more antihypertensive medications at the highest tolerated doses.)
• Patients with concomitant hypertension and deteriorating renal function
• Patients with renal insufficiency and discrepant kidney size (implying renal artery stenosis)
• Patients with recurrent flash pulmonary edema(a sudden and severe form of acute heart
failure that can be life-threatening)
• Patients with diagnosed FMD
• Follow up of patients who have undergone Renal artery interventions, stent placements, graft
etc
17.
Other imaging modalities
•Catheter angiography is the gold standard for renal vessel examination but is
limited by use of contrast, radiation and its invasive nature
• CTA uses radiation and iondinated contrast which is contraindicated in
patients with low GFR
• MRA usually requires intravenous contrast material (gadoliniumbased
agents), which may be contraindicated in patients with renal failure, and is an
expensive and timeconsuming examination
• MRA cannot be performed on claustrophobic patients or on patients with
certain types of metallic implants.
• CTA and MRA provide superb anatomic information, but are limited in their
ability to assess overall renal function. They also have limited utility in those
patients who have undergone revascularization with stent placement.
18.
• Doppler sonographyhas significant benefits when compared with
these other imaging modalities; it is an inexpensive, noninvasive
and does not require contrast material.
• The Doppler examination is superior to other modalities because it
not only provides anatomic information but also allows evaluation
of physiologic factors.
• These physiologic changes can determine the hemodynamic
significance of a renal vascular lesion and can assess the need
for intervention
19.
Patient preparation
• Adequatepatient preparation is important to reduce the amount of bowel gas,
which produces scatter and attenuates the ultrasound beam.
• 12-hour fast before the examination is recommended
• Should be scheduled first thing in the morning, before patients have
breakfast, to improve visualization of vascular structures.
• Medication should not be given prior to performing the study.
• The examination is performed on a modern ultrasound unit, offering high-
resolution gray-scale imaging, and sensitive color, power, and pulsed Doppler
imaging.
• Harmonic imaging should be utilized during to improve resolution and
decrease artifacts.
20.
EQUIPMENTS
• The studyis performed using 2- to 5-MHz curved array transducers,
which provide the depth of penetration needed to visualize the abdominal
aorta and its major branches: celiac, mesenteric, and renal arteries.
• Color Doppler flow imaging for demonstrating patency of renal arteries
and detecting flow disturbances that indicate stenosis.
• A low pulse repetition frequency (PRF) setting may also produce an
aliased color flow signal in an area of normal velocity.
• Pulsed (spectral) Doppler analysis must be used in conjunction with color
flow imaging, as it provides quantitative information through the
measurement of blood flow velocities in the renal vessels.
21.
TECHNIQUE
• Optimize thegray-scale and color Doppler parameters to improve renal
artery visualization as well as the conspicuity of flow-reducing lesions.
• Adjust color Doppler parameters, including color gain, PRF (color velocity
scale), and wall filter, is performed in areas of laminar flow within either the
aorta or a normal segment of a renal artery.
• Adjustments in areas of normal blood flow allow the examiner to “screen” a
vessel quickly for stenosis because elevated velocities in stenotic regions
produce a color aliasing artifact that is readily apparent.
22.
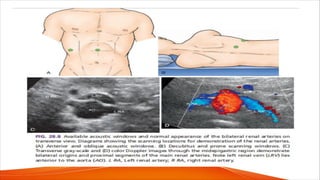
• Utilize allavailable acoustic windows to obtain velocity information from the
renal arteries.
• The renal arteries can be visualized from an anterior abdominal approach in:
v Supine position through the abdominal wall
v Oblique position
v Decubitus position through the liver, spleen, and either kidney,
v Prone position with a posterior (translumbar) approach through the patient’s
back
• The anterior abdominal approach is useful for evaluating the renal ostia,
providing optimal orientation of the renal vessels to facilitate accurate
sampling with spectral Doppler
23.
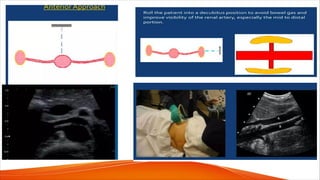
• A commonlimitation of the anterior approach is the presence of overlying
bowel gas that limits visualization of the renal arteries.
• This may be overcome by continuous gradual application of
transducer pressure that displaces the gas-containing bowel loops
away from the vessels of interest.
• If the anterior approach is not feasible other alternative windows are used.
• Deep abdominal vessels are frequently seen in the decubitus and prone
positions, using the liver and kidneys as acoustic windows to visualize the
renal arteries.
• Another method of identifying the main renal arteries, particularly their
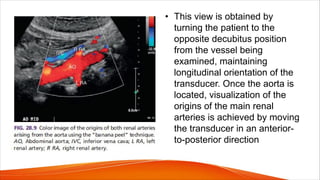
ostia, has been termed the “banana peel” view.
24.
• This viewis obtained by
turning the patient to the
opposite decubitus position
from the vessel being
examined, maintaining
longitudinal orientation of the
transducer. Once the aorta is
located, visualization of the
origins of the main renal
arteries is achieved by moving
the transducer in an anterior-
to-posterior direction
27.
• The spectralDoppler examination is performed with a small sample
volume so as to obtain flow information from only the vessel of interest
and minimize contamination from adjacent vessels.
• Doppler sampling is performed with angles of 60 degrees or less, as
angles of greater than 60 degrees will increase PSV measurements.
• . The spectral Doppler PRF is adjusted so that the waveforms are large
and easy to interpret without producing aliasing.
29.
PROTOCOL
• Renal arteryDoppler examination includes not only the evaluation of the
renal vasculature but also an examination of the kidneys.
STEP 1: Evaluate kidney size and pathology
B-mode
• Kidney size is an important factor in the decision-making process for
consideration of revascularization.
• The normal adult kidney usually measures greater than 8 cm in longitudinal
size, with an average length of 10 to 12 cm.
• The kidneys are generally symmetric in size with a normal allowable
variation in size of 2 cm between the contralateral sides.
• The kidneys are best examined with the patient in a decubitus position.
30.
• In additionto kidney length, we note renal parenchymal echogenicity
and thickness.
• The kidneys are assessed for atrophy,scarring,hydronephrosis, calculi,
and masses. Icidental discovery of occult renal cell carcinomas is not
uncommon
STEP 2: Survey the abdominal aorta.
• Perform a survey of the abdominal aorta from the celiac artery to the iliac
bifurcation and evaluate for atherosclerotic plaque.
• Do both gray-scale and color flow Doppler examination of the
abdominal aorta in a longitudinal plane.
• Gray-scale evaluation is important to assess for irregular plaque and
ostial lesions (i.e., at the origin of the aortic branches), which may be
obscured by color flow blooming.
31.
• The presenceof significant aortic plaque should increase suspicion for
ostial renal artery disease, particularly in older adults and diabetic patients.
• Look for flow abnormalities at the origins of the celiac and superior
mesenteric arteries, findings that may correlate with significant stenosis.
• The size and location of abdominal aortic aneurysms are noted, and their
relationship to the renal arteries is reported.
• Finally, angle-corrected PSV measurements are obtained in the
abdominal aorta at the level of the renal arteries.
• These aortic velocity measurements are used to determine the renal
artery to aorta velocity ratio (RAR)
32.
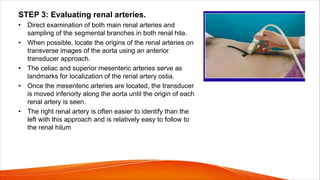
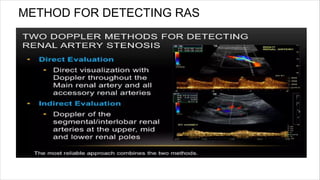
STEP 3: Evaluatingrenal arteries.
• Direct examination of both main renal arteries and
sampling of the segmental branches in both renal hila.
• When possible, locate the origins of the renal arteries on
transverse images of the aorta using an anterior
transducer approach.
• The celiac and superior mesenteric arteries serve as
landmarks for localization of the renal artery ostia.
• Once the mesenteric arteries are located, the transducer
is moved inferiorly along the aorta until the origin of each
renal artery is seen.
• The right renal artery is often easier to identify than the
left with this approach and is relatively easy to follow to
the renal hilum
34.
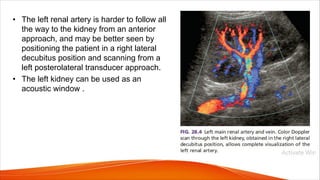
• The leftrenal artery is harder to follow all
the way to the kidney from an anterior
approach, and may be better seen by
positioning the patient in a right lateral
decubitus position and scanning from a
left posterolateral transducer approach.
• The left kidney can be used as an
acoustic window .
35.
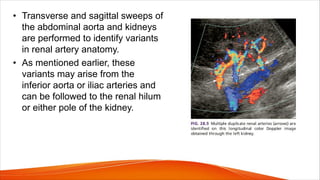
• Transverse andsagittal sweeps of
the abdominal aorta and kidneys
are performed to identify variants
in renal artery anatomy.
• As mentioned earlier, these
variants may arise from the
inferior aorta or iliac arteries and
can be followed to the renal hilum
or either pole of the kidney.
36.
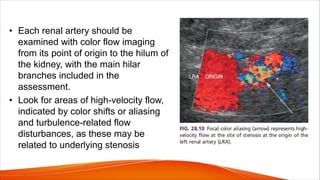
• Each renalartery should be
examined with color flow imaging
from its point of origin to the hilum of
the kidney, with the main hilar
branches included in the
assessment.
• Look for areas of high-velocity flow,
indicated by color shifts or aliasing
and turbulence-related flow
disturbances, as these may be
related to underlying stenosis
37.
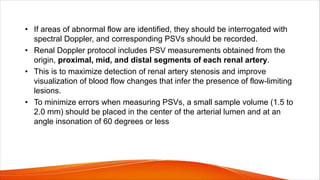
• If areasof abnormal flow are identified, they should be interrogated with
spectral Doppler, and corresponding PSVs should be recorded.
• Renal Doppler protocol includes PSV measurements obtained from the
origin, proximal, mid, and distal segments of each renal artery.
• This is to maximize detection of renal artery stenosis and improve
visualization of blood flow changes that infer the presence of flow-limiting
lesions.
• To minimize errors when measuring PSVs, a small sample volume (1.5 to
2.0 mm) should be placed in the center of the arterial lumen and at an
angle insonation of 60 degrees or less
38.
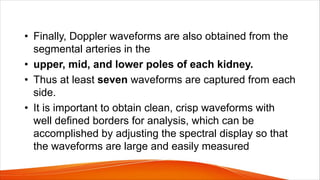
• Finally, Dopplerwaveforms are also obtained from the
segmental arteries in the
• upper, mid, and lower poles of each kidney.
• Thus at least seven waveforms are captured from each
side.
• It is important to obtain clean, crisp waveforms with
well defined borders for analysis, which can be
accomplished by adjusting the spectral display so that
the waveforms are large and easily measured
40.
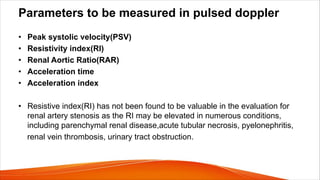
Parameters to bemeasured in pulsed doppler
• Peak systolic velocity(PSV)
• Resistivity index(RI)
• Renal Aortic Ratio(RAR)
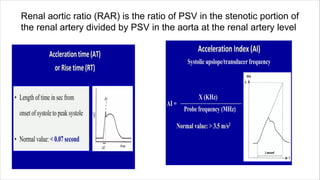
• Acceleration time
• Acceleration index
• Resistive index(RI) has not been found to be valuable in the evaluation for
renal artery stenosis as the RI may be elevated in numerous conditions,
including parenchymal renal disease,acute tubular necrosis, pyelonephritis,
renal vein thrombosis, urinary tract obstruction.
41.
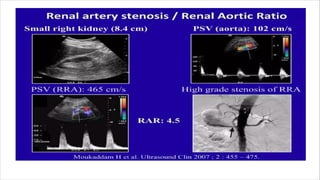
Renal aortic ratio(RAR) is the ratio of PSV in the stenotic portion of
the renal artery divided by PSV in the aorta at the renal artery level
43.
• Atherosclerotic renalartery disease is the most common
etiology of significant renal artery stenosis
• These lesions occur at the origin and proximal segments of the
renal artery.
• Pay close attention to these segments in our older adult patients
who are likely to have atherosclerotic obstructive lesions
• It is more important to visualize the entire renal artery in younger
adults as these patients are more likely to have fibromuscular
dysplasia (FMD), which can affect the mid and distal renal artery
or the segmental branches.
44.
• Studies ondifficult patients who cannot cooperate or who are not “sonogenic”
are aborted promptly, and an alternative study is recommended for further
evaluation.
• Ultrasound contrast (echo-enhancing) agents allow for increased visibility
of blood vessels and improved visualization of renal arterial blood flow
patterns.
• May be particularly helpful in visualizing the renal arteries in
• Obese patients
• Reducing examination time
• Enhance ultrasound visualization of multiple renal arteries and hilar
branches.
46.
VASCULAR DISORDERS
• Thereare a variety of disorders that affect the renal vasculature.
• These conditions may result in damage to the renal parenchyma,
renal failure, and/or hypertension.
• The most common vascular conditions affecting the renal
arteries are renal artery stenosis (due to atherosclerosis or FMD),
renal artery occlusion, and renal artery aneurysm.
• Renal vein thrombosis can be seen with hypercoagulable states,
malignancy (tumor thrombus), or with propagation of clot from
the IVC.
• Other renal vascular pathologies include AVF, dissection,
vasculitis, and pseudoaneurysm formation.
47.
v Renal arterystenosis
• Renal artery stenosis may result from a diverse group of
conditions, including
• Atherosclerosis
• FMD
• Vasculitis
• Neurofibromatosis
• Congenital bands
• Extrinsic compression
• Radiation.
48.
• FMD accountsfor less than 10% of renal vascular lesions
• FMD represents a noninflammatory and
nonatherosclerotic vascular disease that affects Renal,
Carotid, vertebral, iliac, and, less commonly, mesenteric
arteries.
• FMD is usually found in patients younger than 40 years of
age
• Affects the mid and distal segments of the renal arteries.
49.
• Atherosclerosis accountsfor approximately 90% of lesions that obstruct
blood flow to the renal arteries.
• Atherosclerotic renal artery stenosis typically involves the ostium and/or
proximal segment of the main renal artery and the adjacent aorta.
• Both atherosclerotic and FMD related lesions gradually progress over time.
• These progressive stenotic lesions eventually lead to renal hypoperfusion,
which in turn leads to impairment of renal function, renal atrophy and
ischemic nephropathy
• Renovascular disease caused by renal artery stenosis is a leading cause of
renal failure and end-stage renal disease in the elderly.
50.
• Although renalartery disease represents the most common
correctable cause of hypertension, the topic of
renovascularization (restoration of renal perfusion via either
vascular stenting or angioplasty) for treatment of
atherosclerotic renovascular disease has become increasingly
controversial.
• Some researchers found that renal artery stenting did not
confer a significant benefit for patients with renal artery
stenosis and hypertension, or chronic kidney disease.
• Despite this controversy, renovascularization is still performed
by many institutions, and the number of requests to perform
renal duplex examination is increasing
51.
Doppler evaluation ofthe renal artery stenosis
• Color flow imaging is used to identify blood flow abnormalities that may be stenosis-related, but
spectral Doppler measurements provide quantitative data that are essential for determining the
severity of stenosis.
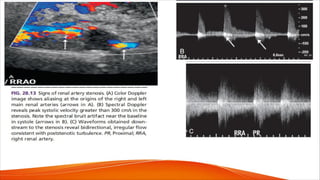
1. Elevated blood flow velocity within a stenotic segment of the vessel. A Flow velocity is
increased proportional to the degree of luminal narrowing; therefore spectral doppler
measurements can be used to approximate the severity of a stenosis.
2. Doppler-to-vessel angle of 60 degrees or less is mandatory to ensure that velocity information is
accurate.
3. A significant stenosis is accompanied by poststenotic flow disturbance (turbulence).
• The presence of color bruit artifacts, on the other hand, usually indicates a significant flow
abnormality.
• Identification of ragged or “picket fence” waveforms with spectral broadening and bidirectional
flow just distal to the stenotic area is also indicative of significant stenosis
52.
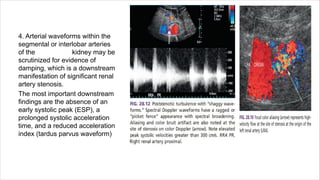
4. Arterial waveformswithin the
segmental or interlobar arteries
of the kidney may be
scrutinized for evidence of
damping, which is a downstream
manifestation of significant renal
artery stenosis.
The most important downstream
findings are the absence of an
early systolic peak (ESP), a
prolonged systolic acceleration
time, and a reduced acceleration
index (tardus parvus waveform)
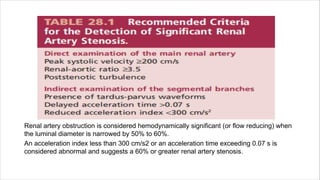
Renal artery obstructionis considered hemodynamically significant (or flow reducing) when
the luminal diameter is narrowed by 50% to 60%.
An acceleration index less than 300 cm/s2 or an acceleration time exceeding 0.07 s is
considered abnormal and suggests a 60% or greater renal artery stenosis.
58.
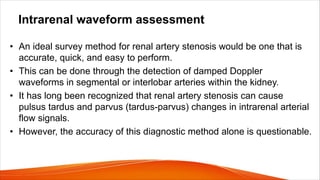
Intrarenal waveform assessment
•An ideal survey method for renal artery stenosis would be one that is
accurate, quick, and easy to perform.
• This can be done through the detection of damped Doppler
waveforms in segmental or interlobar arteries within the kidney.
• It has long been recognized that renal artery stenosis can cause
pulsus tardus and parvus (tardus-parvus) changes in intrarenal arterial
flow signals.
• However, the accuracy of this diagnostic method alone is questionable.
59.
Here is why.....
•Even at high levels of stenosis, some patients do not have
appreciable waveform damping. This is because the shape of
intrarenal arterial waveforms is affected by multiple factors:
-stiffness (compliance) of the arteries,
-high resistance in the microvasculature from parenchymal renal
disease (e.g., diabetes-related nephropathy).
• ALL of which may cause the damping effects of a main renal
artery stenosis to be obliterated
• To make matters worse, damped intrarenal wave forms can
occasionally be seen in the absence of significant renal artery
stenosis in patients with aortic stenosis or aortic occlusion.
61.
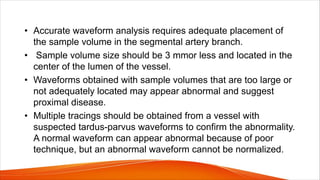
• Accurate waveformanalysis requires adequate placement of
the sample volume in the segmental artery branch.
• Sample volume size should be 3 mmor less and located in the
center of the lumen of the vessel.
• Waveforms obtained with sample volumes that are too large or
not adequately located may appear abnormal and suggest
proximal disease.
• Multiple tracings should be obtained from a vessel with
suspected tardus-parvus waveforms to confirm the abnormality.
A normal waveform can appear abnormal because of poor
technique, but an abnormal waveform cannot be normalized.
62.
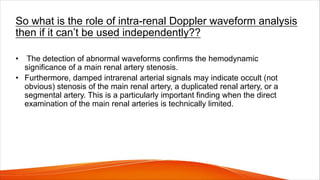
So what isthe role of intra-renal Doppler waveform analysis
then if it can’t be used independently??
• The detection of abnormal waveforms confirms the hemodynamic
significance of a main renal artery stenosis.
• Furthermore, damped intrarenal arterial signals may indicate occult (not
obvious) stenosis of the main renal artery, a duplicated renal artery, or a
segmental artery. This is a particularly important finding when the direct
examination of the main renal arteries is technically limited.
63.
• It hasbeen suggested that the downstream effects of renal
artery stenosis can be diagnosed merely by visual inspection of
the shape of the segmental or interlobar Doppler waveforms.
• The initial systolic peak is either absent or grossly rounded in
patients with severe ipsilateral stenosis.
• Compare intrarenal waveforms from both kidneys to assess the
difference in systolic upstroke.
• Subtle changes may be noted, indicating underlying stenosis
64.
• Doppler assessmentof the renal arteries is also valuable
following revascularization with angioplasty, bypass, or stent
placement.
• Measurement of renal artery PSV is used to assess residual or
recurrent stenosis after therapy.
• There is a reduction in PSV in the stenotic region following
successful angioplasty and stent placement.
• Hilar waveforms will also return to normal appearance after
successful treatment in many cases.
65.
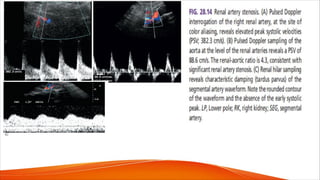
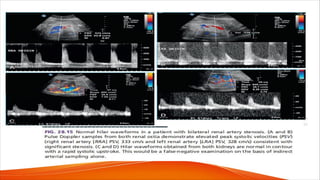
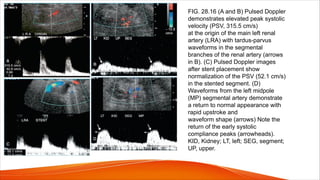
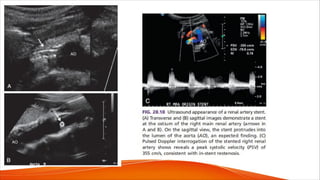
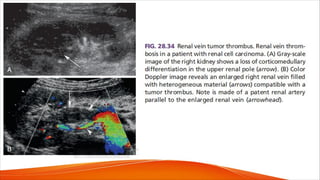
FIG. 28.16 (Aand B) Pulsed Doppler
demonstrates elevated peak systolic
velocity (PSV, 315.5 cm/s)
at the origin of the main left renal
artery (LRA) with tardus-parvus
waveforms in the segmental
branches of the renal artery (arrows
in B). (C) Pulsed Doppler images
after stent placement show
normalization of the PSV (52.1 cm/s)
in the stented segment. (D)
Waveforms from the left midpole
(MP) segmental artery demonstrate
a return to normal appearance with
rapid upstroke and
waveform shape (arrows) Note the
return of the early systolic
compliance peaks (arrowheads).
KID, Kidney; LT, left; SEG, segment;
UP, upper.
66.
• We findit advantageous to use a combination of the PSV and
RAR in a similar fashion to the
PSV and internal carotid artery/common carotid artery (ICA/CCA)
ratio for carotid examinations.
• A PSV greater than or equal to 200 cm/s and the RAR greater
than or equal to 3.5 demonstrated high specificity for significant
renal artery stenosis.
• Always look for an elevated velocity at the site of stenosis and
utilize the ratio to increase confidence in the diagnosis.
• Cases with discordant findings are usually referred for
additional imaging with CTA or MRA to clarify the diagnosis.
67.
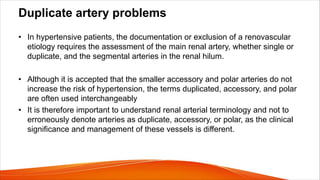
Duplicate artery problems
•In hypertensive patients, the documentation or exclusion of a renovascular
etiology requires the assessment of the main renal artery, whether single or
duplicate, and the segmental arteries in the renal hilum.
• Although it is accepted that the smaller accessory and polar arteries do not
increase the risk of hypertension, the terms duplicated, accessory, and polar
are often used interchangeably
• It is therefore important to understand renal arterial terminology and not to
erroneously denote arteries as duplicate, accessory, or polar, as the clinical
significance and management of these vessels is different.
68.
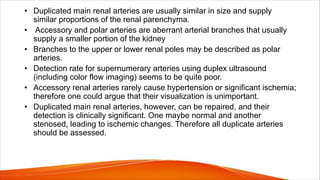
• Duplicated mainrenal arteries are usually similar in size and supply
similar proportions of the renal parenchyma.
• Accessory and polar arteries are aberrant arterial branches that usually
supply a smaller portion of the kidney
• Branches to the upper or lower renal poles may be described as polar
arteries.
• Detection rate for supernumerary arteries using duplex ultrasound
(including color flow imaging) seems to be quite poor.
• Accessory renal arteries rarely cause hypertension or significant ischemia;
therefore one could argue that their visualization is unimportant.
• Duplicated main renal arteries, however, can be repaired, and their
detection is clinically significant. One maybe normal and another
stenosed, leading to ischemic changes. Therefore all duplicate arteries
should be assessed.
69.
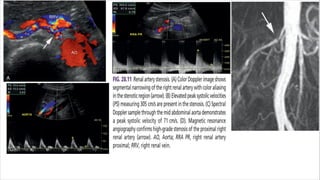
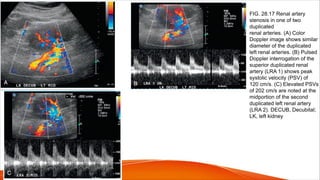
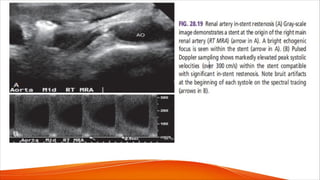
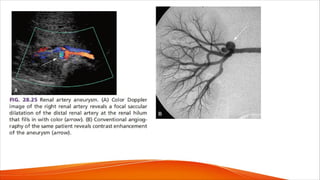
FIG. 28.17 Renalartery
stenosis in one of two
duplicated
renal arteries. (A) Color
Doppler image shows similar
diameter of the duplicated
left renal arteries. (B) Pulsed
Doppler interrogation of the
superior duplicated renal
artery (LRA 1) shows peak
systolic velocity (PSV) of
120 cm/s. (C) Elevated PSVs
of 202 cm/s are noted at the
midportion of the second
duplicated left renal artery
(LRA 2). DECUB, Decubital;
LK, left kidney
70.
Segmental branch problems
•Duplex results are poorer for segmental branch stenoses than for the detection of main
renal artery stenoses.
• Stenoses in hilar branch vessels can be repaired with angioplasty, so their detection in
hypertensive patients is important.
• For this reason, they advise careful assessment of hilar and segmental branches in
younger hypertensive patients who may have FMD and the use of angiographic imaging
modalities when hilar branch visualization is suboptimal
• As mentioned earlier, resistive indices are measured in the segmental branches.
Although the RI is not reliable for making a diagnosis of renal artery stenosis, it is
thought to have value in predicting the outcome of renal revascularization.
• Radermacher et al. found that a renal RI greater than 0.8 reliably identifies patients with
renal artery stenosis who are not likely to respond to revascularization.
72.
v Renal Dopplerafter intervention or revascularization
• Revascularization of the renal artery can be accomplished via surgical or
endovascular means.
• Surgical options for revascularization include aortorenal bypass grafts and
aortorenal endarterectomy.
• Although these surgical techniques are effective treatment options, major
complications associated with surgery have been reported to be twice
as common as compared with the endovascular approach.
• For this reason, percutaneous transluminal angioplasty (PTA) with or without
stent placement has largely replaced open surgical therapy as the first-line
treatment.
73.
• Regardless ofthe specific type of therapy chosen, the
ultimate goal of revascularization techniques is to
improve or stabilize hypertension, preserve renal
function, and prevent development of end stage renal
failure.
• However, a significant long-term complication following
stenting is the development of in-stent restenosis, with
reported rates of 6% to 20%.
74.
• There areseveral modalities that are utilized for the assessment of renal
artery stents, including conventional angiography, CTA, MRA, and Doppler
ultrasound.
• CTA requires exposure to ionizing radiation and is also avoided in patients
with renal insufficiency caused by the nephrotoxic effects of iodinated
contrast material.
• Depending on the type of stent utilized, MRA may not be suitable for stent
evaluation because of metallic susceptibility artifacts that preclude adequate
evaluation of the stent lumen. MRA also utilizes gadolinium as a contrast
agent which carry the risk of nephrogenic systemic fibrosis, a potentially fatal
disease in patients with severely impaired renal function.
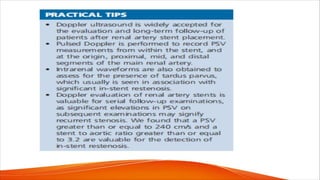
• Doppler ultrasound is widely accepted for the evaluation and long-term
follow-up of patients after renal artery stent placement. It is highly sensitive
for the detection of in-stent restenosis.
75.
RENAL STENT EVALUATION
•The protocol for evaluation of renal stents is similar to the native renal
artery evaluation.
• The abdominal aorta is initially examined for evidence of significant
atherosclerotic plaque, stenosis, or aneurysm.
• A PSV is obtained from the abdominal aorta to be used for the calculation of
SAR. Following renal stent placement, the renal artery is evaluated along its
entire length from the origin to the hilum.
• Gray-scale images provide optimal visualization of the stent, as it may be
partially obscured by color flow imaging.
• Most interventions are performed in patients with atherosclerotic disease,
where plaque burden is typically highest at the renal artery origins.
This is therefore the most common site for placement of renal artery stents.
77.
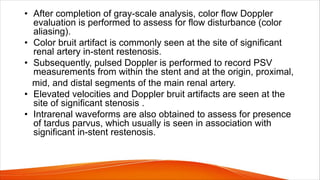
• After completionof gray-scale analysis, color flow Doppler
evaluation is performed to assess for flow disturbance (color
aliasing).
• Color bruit artifact is commonly seen at the site of significant
renal artery in-stent restenosis.
• Subsequently, pulsed Doppler is performed to record PSV
measurements from within the stent and at the origin, proximal,
mid, and distal segments of the main renal artery.
• Elevated velocities and Doppler bruit artifacts are seen at the
site of significant stenosis .
• Intrarenal waveforms are also obtained to assess for presence
of tardus parvus, which usually is seen in association with
significant in-stent restenosis.
79.
PITFALLS OF STENTASSESMENT
• The pitfalls and limitations of stent assessment are very similar to those encountered
during the evaluation of native untreated renal arteries, including overlying bowel gas,
obesity, inability to breath-hold, and inability to cooperate for the examination.
• In addition, it has been postulated that patients with patent renal stents may have
elevated PSVs throughout the stented vessel when there is significant stenosis in the
contralateral renal artery, a phenomenon that has also been described in native renal
arteries.
• Overestimation of stenosis can be avoided by the detection of additional signs of
significant stenosis, including color and pulsed Doppler bruit artifacts, poststenotic
turbulence, and tardus-parvus waveforms.
• Analysis of Doppler parameters on the contralateral side is also helpful.
• Patients with arrhythmia may present with fluctuating PSVs, complicating the
determination of the actual PSV.
80.
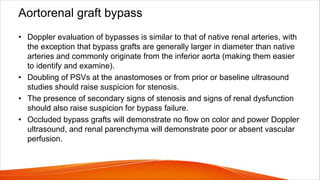
Aortorenal graft bypass
•Doppler evaluation of bypasses is similar to that of native renal arteries, with
the exception that bypass grafts are generally larger in diameter than native
arteries and commonly originate from the inferior aorta (making them easier
to identify and examine).
• Doubling of PSVs at the anastomoses or from prior or baseline ultrasound
studies should raise suspicion for stenosis.
• The presence of secondary signs of stenosis and signs of renal dysfunction
should also raise suspicion for bypass failure.
• Occluded bypass grafts will demonstrate no flow on color and power Doppler
ultrasound, and renal parenchyma will demonstrate poor or absent vascular
perfusion.
81.
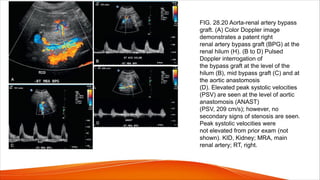
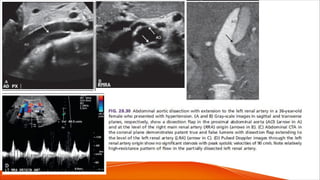
FIG. 28.20 Aorta-renalartery bypass
graft. (A) Color Doppler image
demonstrates a patent right
renal artery bypass graft (BPG) at the
renal hilum (H). (B to D) Pulsed
Doppler interrogation of
the bypass graft at the level of the
hilum (B), mid bypass graft (C) and at
the aortic anastomosis
(D). Elevated peak systolic velocities
(PSV) are seen at the level of aortic
anastomosis (ANAST)
(PSV, 209 cm/s); however, no
secondary signs of stenosis are seen.
Peak systolic velocities were
not elevated from prior exam (not
shown). KID, Kidney; MRA, main
renal artery; RT, right.
83.
v RENAL ARTERYOCCLUSION
• Renal artery occlusion usually develops from progression
of atherosclerotic plaque that eventually leads to
obliteration of the arterial lumen.
• Additionally, renal artery occlusion may result from an
acute process such as a thromboembolic or
thromboatherosclerotic event.
• Clinical symptoms of acute renal artery occlusion include
persistent abdominal or flank pain that mimics pain similar
to that of renal colic.
• Patients also may present with hematuria.
84.
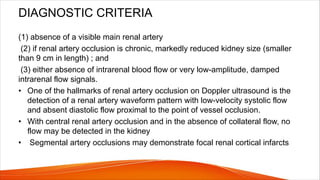
DIAGNOSTIC CRITERIA
(1) absenceof a visible main renal artery
(2) if renal artery occlusion is chronic, markedly reduced kidney size (smaller
than 9 cm in length) ; and
(3) either absence of intrarenal blood flow or very low-amplitude, damped
intrarenal flow signals.
• One of the hallmarks of renal artery occlusion on Doppler ultrasound is the
detection of a renal artery waveform pattern with low-velocity systolic flow
and absent diastolic flow proximal to the point of vessel occlusion.
• With central renal artery occlusion and in the absence of collateral flow, no
flow may be detected in the kidney
• Segmental artery occlusions may demonstrate focal renal cortical infarcts
87.
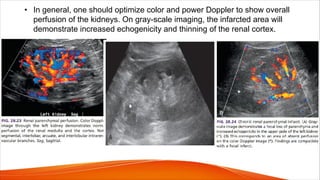
• In general,one should optimize color and power Doppler to show overall
perfusion of the kidneys. On gray-scale imaging, the infarcted area will
demonstrate increased echogenicity and thinning of the renal cortex.
88.
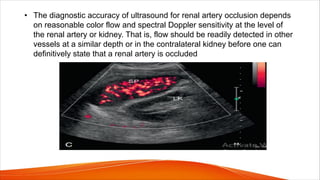
• The diagnosticaccuracy of ultrasound for renal artery occlusion depends
on reasonable color flow and spectral Doppler sensitivity at the level of
the renal artery or kidney. That is, flow should be readily detected in other
vessels at a similar depth or in the contralateral kidney before one can
definitively state that a renal artery is occluded
89.
• False-positive diagnosesof renal artery occlusion can occur when:
- There is poor visualization of the main renal artery or when the kidney is
small for reasons other than arterial occlusion.
• False-negative results may be caused by:
- Collateralization, which can occur via capsular or adrenal branches
- Presence of duplicated renal arteries.
• In the collateralized kidney, flow signals may well be present in the renal
parenchyma or in the renal hilum despite renal artery occlusion.
• Intrarenal Doppler waveforms may even be normal in some cases,
although tardus-parvus waveforms are usually seen.
90.
v RENAL ARTERYANEURYSM
• There is a wide range of renal artery diameters that is considered to be
normal, with a mean of 4.5 to 5 mm at the ostium, depending on an
individual’s gender.
• Renal arteries measuring 1 cm or greater are considered aneurysmal.
• Renal artery aneurysms are the second most common type of visceral
artery aneurysm, constituting 15% to 22% of all cases. Most renal artery
aneurysms do not exceed 2 cm in diameter and are usually discovered
incidentally during diagnostic procedures performed for other indications.
• Symptoms may develop from rupture, embolization to the peripheral
vascular bed, or arterial thrombosis leading to intrarenal ischemia or
infarction.
91.
• In theabsence of trauma, renal artery aneurysms are rare, with an
estimated incidence of 0.1% in the general population.
• Most are saccular and noncalcified, and usually occur at the bifurcation of
the main renal artery
• Some aneurysms demonstrate peripheral calcification
• Renal artery aneurysms are subdivided into two categories: extrarenal
(90%) and intrarenal (10%).
• Extrarenal aneurysms are caused by atherosclerosis and FMD, and over
73% of renal artery aneurysms are associated with hypertension.
Depending on the type of FMD, the main renal artery may demonstrate a
“string of beads” appearance on color and power Doppler or may show
long segmental narrowing of the proximal, mid, or distal aspects of the
main renal artery.
94.
• Aneurysmal manifestationsof FMD may also be
detectable in other arteries, including cerebral arteries
• Extrarenal aneurysms are mostly asymptomatic;
however, when symptoms develop they are usually
caused by aneurysm rupture, embolization to the
peripheral vascular bed, or arterial thrombosis.
95.
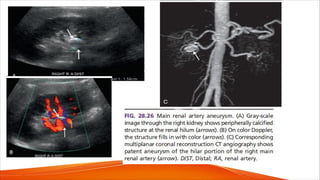
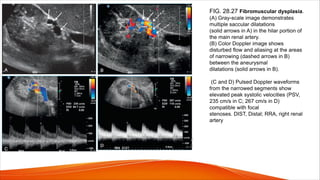
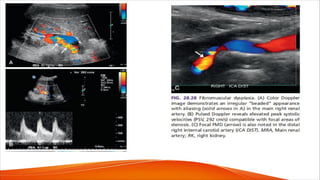
FIG. 28.27 Fibromusculardysplasia.
(A) Gray-scale image demonstrates
multiple saccular dilatations
(solid arrows in A) in the hilar portion of
the main renal artery.
(B) Color Doppler image shows
disturbed flow and aliasing at the areas
of narrowing (dashed arrows in B)
between the aneurysmal
dilatations (solid arrows in B).
(C and D) Pulsed Doppler waveforms
from the narrowed segments show
elevated peak systolic velocities (PSV,
235 cm/s in C; 267 cm/s in D)
compatible with focal
stenoses. DIST, Distal; RRA, right renal
artery
97.
• Intrarenal aneurysmsare generally very small (microaneurysms) and are
often multiple. They may be seen in patients suffering from polyarteritis
nodosa, a rare necrotizing vasculitis that affects the small- and medium-
sized arteries of multiple organs, usually involving the renal (85%) and
hepatic (65%) vasculature.
• Microaneurysms range in size from 1 to 12 mm and are classically seen
at branch points. Intrarenal microaneurysms can also be seen in patients
with Wegener granulomatosis, systemic lupus erythematosus, rheumatoid
vasculitis, and drug abuse.
• Angiomyolipomas are also associated with formation of “berry-like”
aneurysms of interlobar and interlobular arteries.
98.
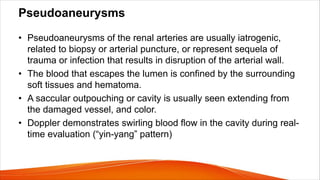
Pseudoaneurysms
• Pseudoaneurysms ofthe renal arteries are usually iatrogenic,
related to biopsy or arterial puncture, or represent sequela of
trauma or infection that results in disruption of the arterial wall.
• The blood that escapes the lumen is confined by the surrounding
soft tissues and hematoma.
• A saccular outpouching or cavity is usually seen extending from
the damaged vessel, and color.
• Doppler demonstrates swirling blood flow in the cavity during real-
time evaluation (“yin-yang” pattern)
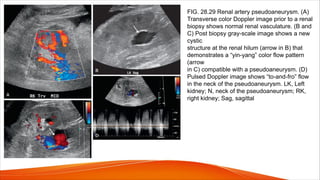
99.
FIG. 28.29 Renalartery pseudoaneurysm. (A)
Transverse color Doppler image prior to a renal
biopsy shows normal renal vasculature. (B and
C) Post biopsy gray-scale image shows a new
cystic
structure at the renal hilum (arrow in B) that
demonstrates a “yin-yang” color flow pattern
(arrow
in C) compatible with a pseudoaneurysm. (D)
Pulsed Doppler image shows “to-and-fro” flow
in the neck of the pseudoaneurysm. LK, Left
kidney; N, neck of the pseudoaneurysm; RK,
right kidney; Sag, sagittal
100.
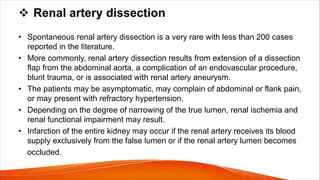
v Renal arterydissection
• Spontaneous renal artery dissection is a very rare with less than 200 cases
reported in the literature.
• More commonly, renal artery dissection results from extension of a dissection
flap from the abdominal aorta, a complication of an endovascular procedure,
blunt trauma, or is associated with renal artery aneurysm.
• The patients may be asymptomatic, may complain of abdominal or flank pain,
or may present with refractory hypertension.
• Depending on the degree of narrowing of the true lumen, renal ischemia and
renal functional impairment may result.
• Infarction of the entire kidney may occur if the renal artery receives its blood
supply exclusively from the false lumen or if the renal artery lumen becomes
occluded.
101.
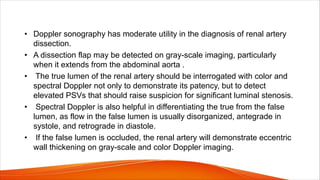
• Doppler sonographyhas moderate utility in the diagnosis of renal artery
dissection.
• A dissection flap may be detected on gray-scale imaging, particularly
when it extends from the abdominal aorta .
• The true lumen of the renal artery should be interrogated with color and
spectral Doppler not only to demonstrate its patency, but to detect
elevated PSVs that should raise suspicion for significant luminal stenosis.
• Spectral Doppler is also helpful in differentiating the true from the false
lumen, as flow in the false lumen is usually disorganized, antegrade in
systole, and retrograde in diastole.
• If the false lumen is occluded, the renal artery will demonstrate eccentric
wall thickening on gray-scale and color Doppler imaging.
103.
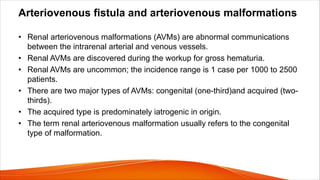
Arteriovenous fistula andarteriovenous malformations
• Renal arteriovenous malformations (AVMs) are abnormal communications
between the intrarenal arterial and venous vessels.
• Renal AVMs are discovered during the workup for gross hematuria.
• Renal AVMs are uncommon; the incidence range is 1 case per 1000 to 2500
patients.
• There are two major types of AVMs: congenital (one-third)and acquired (two-
thirds).
• The acquired type is predominately iatrogenic in origin.
• The term renal arteriovenous malformation usually refers to the congenital
type of malformation.
104.
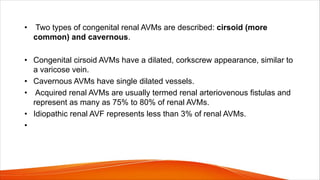
• Two typesof congenital renal AVMs are described: cirsoid (more
common) and cavernous.
• Congenital cirsoid AVMs have a dilated, corkscrew appearance, similar to
a varicose vein.
• Cavernous AVMs have single dilated vessels.
• Acquired renal AVMs are usually termed renal arteriovenous fistulas and
represent as many as 75% to 80% of renal AVMs.
• Idiopathic renal AVF represents less than 3% of renal AVMs.
•
105.
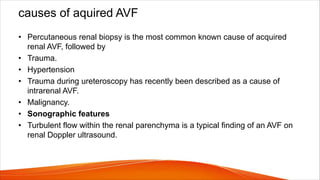
causes of aquiredAVF
• Percutaneous renal biopsy is the most common known cause of acquired
renal AVF, followed by
• Trauma.
• Hypertension
• Trauma during ureteroscopy has recently been described as a cause of
intrarenal AVF.
• Malignancy.
• Sonographic features
• Turbulent flow within the renal parenchyma is a typical finding of an AVF on
renal Doppler ultrasound.
106.
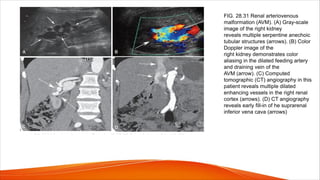
FIG. 28.31 Renalarteriovenous
malformation (AVM). (A) Gray-scale
image of the right kidney
reveals multiple serpentine anechoic
tubular structures (arrows). (B) Color
Doppler image of the
right kidney demonstrates color
aliasing in the dilated feeding artery
and draining vein of the
AVM (arrow). (C) Computed
tomographic (CT) angiography in this
patient reveals multiple dilated
enhancing vessels in the right renal
cortex (arrows). (D) CT angiography
reveals early fill-in of he suprarenal
inferior vena cava (arrows)
107.
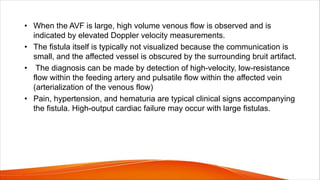
• When theAVF is large, high volume venous flow is observed and is
indicated by elevated Doppler velocity measurements.
• The fistula itself is typically not visualized because the communication is
small, and the affected vessel is obscured by the surrounding bruit artifact.
• The diagnosis can be made by detection of high-velocity, low-resistance
flow within the feeding artery and pulsatile flow within the affected vein
(arterialization of the venous flow)
• Pain, hypertension, and hematuria are typical clinical signs accompanying
the fistula. High-output cardiac failure may occur with large fistulas.
108.
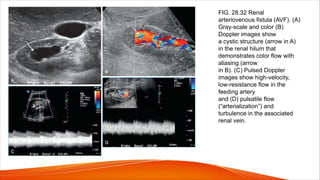
FIG. 28.32 Renal
arteriovenousfistula (AVF). (A)
Gray-scale and color (B)
Doppler images show
a cystic structure (arrow in A)
in the renal hilum that
demonstrates color flow with
aliasing (arrow
in B). (C) Pulsed Doppler
images show high-velocity,
low-resistance flow in the
feeding artery
and (D) pulsatile flow
(“arterialization”) and
turbulence in the associated
renal vein.
110.
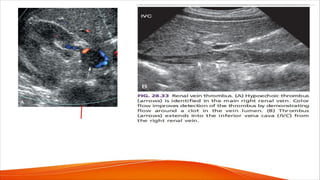
Renal vein thrombosis
•Renal vein thrombosis can be difficult to detect because of the nonspecific clinical
and radiographic findings. Acute renal vein thrombosis usually presents with pain
and hematuria and may occasionally lead to thromboembolic complications such as
pulmonary embolism.
• Chronic renal vein thrombosis may be asymptomatic or may present with nephrotic
syndrome, hematuria, or renal failure.
• Renal vein thrombosis can be caused by intraluminal tumor, thrombus formation, or
extrinsic compression.
• Associated or predisposing conditions include preexisting renal disease, renal cell
carcinoma, a hypercoagulable state, IVC or ovarian vein thrombus (with extension to
the renal veins), abdominal surgery, trauma, and dehydration.
• Primary renal disease is the most common predisposing factor, particularly the
nephrotic syndrome and membranous glomerulonephritis
111.
• Extrinsic causesof renal vein thrombosis include acute pancreatitis,
lymph node enlargement from a host of tumors, and retroperitoneal
fibrosis. These conditions generally cause compression of the vascular
pedicle, predisposing it to thrombosis.
• Renal vein thrombosis typically induces ischemic parenchymal damage to
the kidney and leads to acute renal failure. The long-term effects of renal
vein thrombosis are varied. If there is recanalization of the renal vein or
the development of venous collaterals, the kidney may have a normal
sonographic appearance.
• If the kidney is severely damaged, however, chronic changes become
evident, including diminished kidney size and increased echogenicity
(secondary to fibrosis).
112.
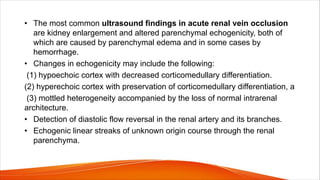
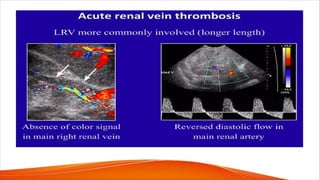
• The mostcommon ultrasound findings in acute renal vein occlusion
are kidney enlargement and altered parenchymal echogenicity, both of
which are caused by parenchymal edema and in some cases by
hemorrhage.
• Changes in echogenicity may include the following:
(1) hypoechoic cortex with decreased corticomedullary differentiation.
(2) hyperechoic cortex with preservation of corticomedullary differentiation, a
(3) mottled heterogeneity accompanied by the loss of normal intrarenal
architecture.
• Detection of diastolic flow reversal in the renal artery and its branches.
• Echogenic linear streaks of unknown origin course through the renal
parenchyma.
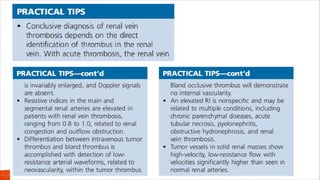
115.
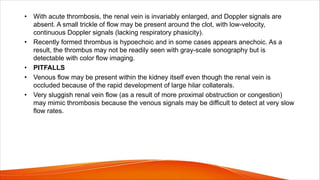
• With acutethrombosis, the renal vein is invariably enlarged, and Doppler signals are
absent. A small trickle of flow may be present around the clot, with low-velocity,
continuous Doppler signals (lacking respiratory phasicity).
• Recently formed thrombus is hypoechoic and in some cases appears anechoic. As a
result, the thrombus may not be readily seen with gray-scale sonography but is
detectable with color flow imaging.
• PITFALLS
• Venous flow may be present within the kidney itself even though the renal vein is
occluded because of the rapid development of large hilar collaterals.
• Very sluggish renal vein flow (as a result of more proximal obstruction or congestion)
may mimic thrombosis because the venous signals may be difficult to detect at very slow
flow rates.
116.
v Renal veintumor extension
• Tumor extension into the renal vein is most commonly associated with renal
cell carcinoma, although renal lymphoma, transitional cell carcinoma, and
Wilms tumor can also propagate along the renal veins.
• Vena cava invasion is approximately three times more common in right-sided
tumors than in those on the left because of the shorter length of the right
renal vein.
• The preoperative diagnosis of venous tumor extension significantly
influences surgical treatment options.
• Contrast-enhanced computed tomography (CT) is the preferred method of
investigation for intravenous tumor extension, supplemented when necessary
with MRI or sonography.
117.
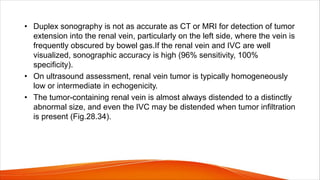
• Duplex sonographyis not as accurate as CT or MRI for detection of tumor
extension into the renal vein, particularly on the left side, where the vein is
frequently obscured by bowel gas.If the renal vein and IVC are well
visualized, sonographic accuracy is high (96% sensitivity, 100%
specificity).
• On ultrasound assessment, renal vein tumor is typically homogeneously
low or intermediate in echogenicity.
• The tumor-containing renal vein is almost always distended to a distinctly
abnormal size, and even the IVC may be distended when tumor infiltration
is present (Fig.28.34).
119.
Doppler waveform abnormalitiesin nonvascular
renal disease
• Flow resistance within the renal parenchyma may be increased by a variety
of pathologic processes, including urinary tract obstruction, and a host of
acute and chronic parenchymal disorders that include glomerulosclerosis,
acute tubular necrosis, and pyelonephritis.
• All of these conditions are associated with increased flow resistance in the
microvasculature of the kidney, which causes the doppler waveforms to
exhibit increased pulsatility. This may be evident on visual inspection of
waveforms or through pulsatility measures such as the pulsatility index or RI.
120.
• In normalkidneys, a large amount of diastolic blood flow is evident on
visual inspection of the intrarenal Doppler signals, and the RI in
segmental or interlobar arteries does not exceed 0.7
• An increase in vascular resistance (and pulsatility) in renal pathology is
nonspecific and has limited diagnostic value because it is multifactorial in
origin. Increased pulsatility is of greatest diagnostic value when it is seen
unilaterally, for in such cases it implies an acute process such as urinary
tract obstruction or renal vein obstruction on the side with high pulsatility.
• High pulsatility may be apparent with urinary obstruction before significant
urinary tract dilatation occurs.
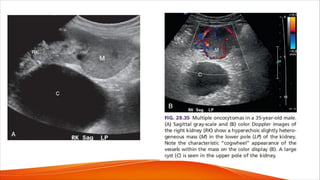
121.
• Solid massessuch as renal cell carcinoma or oncocytomas may
demonstrate significant neovascularity that is distinct from vascular
disorders such as pseudoaneurysm or AVM. For example, patients with
oncocytoma can reveal a characteristic spoke-wheel pattern of blood flow
within the tumor (Fig. 28.35).
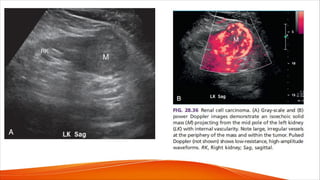
• Increased neovascularity is also commonly seen in renal cell carcinoma
(Fig.28.36). Color and pulsed Doppler evaluation are helpful in the
characterization of indeterminate renal lesions identified on other
modalities.
• Waveforms obtained from malignant tumors usually show a high-velocity,
low-resistance pattern with velocities significantly higher than normally
seen in renal arteries.


![carotid stenosis [Autosaved].pptx for master students](https://cdn.slidesharecdn.com/ss_thumbnails/carotidstenosisautosaved-241229032708-f20dd02c-thumbnail.jpg?width=640&height=640&fit=bounds)


