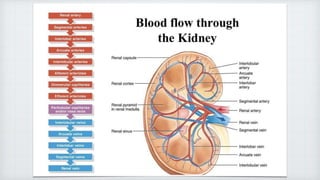
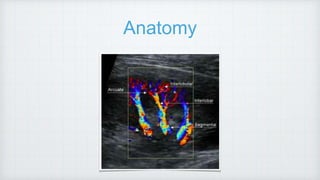
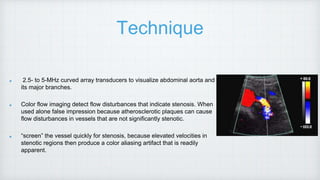
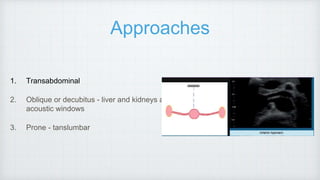
This document discusses ultrasound assessment of the native renal vessels. It provides information on renal vascular anatomy, techniques, approaches, and protocols for ultrasound evaluation. Key findings and diagnostic criteria are outlined for various vascular disorders of the kidneys including renal artery stenosis, renal artery occlusion, renal vein thrombosis, renal artery aneurysms, pseudoaneurysms, and arteriovenous malformations. Normal and abnormal Doppler waveform patterns are also described.


![AVM
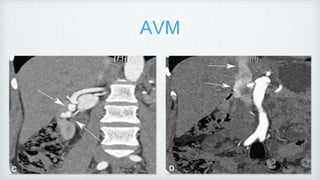
abnormal communications between the intra- renal arterial and venous vessels.
Types : i) Congenital [1/3rd] ii) Acquired [2/3rd]. -
iatrogenic
Cirsoid [MC] Cavernous AVM
Dilated corkscrew app Single dilated vessel
aka renal AV fistulas
US -Turbulent flow within renal parenchyma](https://image.slidesharecdn.com/renaldopplerhod-220712032832-eb225c4f/85/Renal-doppler-HOD-pptx-41-320.jpg)
![AVM
abnormal communications between the intra- renal arterial and venous vessels.
Types : i) Congenital [1/3rd] ii) Acquired [2/3rd]. -
iatrogenic
Cirsoid [MC] Cavernous AVM
Dilated corkscrew app Single dilated vessel
aka renal AV fistulas
US -Turbulent flow within renal parenchyma](https://image.slidesharecdn.com/renaldopplerhod-220712032832-eb225c4f/85/Renal-doppler-HOD-pptx-42-320.jpg)