SlideShare a Scribd company logo
1 of 5
Statistics and Probability – Senior High School Core
Subject
Alternative Delivery Mode
Quarter 4 – Module 1: Hypothesis Testing
What is It
DISCUSSION
Hypothesis testing is a statistical method applied in making decisions using experimental data. Hypothesis
testing is basically testing an assumption that we make about a population.
A hypothesis is a proposed explanation, assertion, or assumption about a population parameter or about the
distribution of a random variable.
Here are the examples of questions you can answer with a hypothesis test:
n height on average?
Elements in Hypothesis Testing
Example:
The school record claims that the mean score in Math of the incoming Grade 11 students is 81. The teacher
wishes to find out if the claim is true. She tests if there isa significant difference betweenthe batch mean score and the
mean score of students in her class.
Solution:
Let 𝜇 be the population mean score and 𝑥̅ be the mean score of students in her class.
You may select any of the following statements as your null and alternative hypothesis as shown in Option 1
and Option 2.
Option 1:
𝐻𝑜: The mean score of the incoming Grade 11 students is 81 or 𝜇 = 81.
𝐻𝑎: The mean score of the incoming Grade 11 students is not 81 or 𝜇 ≠ 81.
Option 2:
𝐻𝑜: The mean score of the incoming Grade 11students has no significant difference with the mean
score of her students or 𝜇 = 𝑥̅.
𝐻𝑎: The mean score of the incoming Grade 11students has a significant difference with the mean score
of her students or 𝜇 ≠ 𝑥̅.
Here is another element
Example:
Jhona uses 5% level of significance in proving that there is no significant change in the average number of enrolle esin
the 10 sections for the last two years. It means that the chance that the null hypothesis (𝐻𝑜) would be rejected when it is
true is 5%.
Two-Tailed Test vs One-Tailed Test
When the alternative hypothesis is to-sided like 𝐻𝑎 : 𝜇 ≠ 𝜇0, it is called two-tailed test.
When the given statistic hypothesis assumes a less than or greater than value, it is called one-tailed test.
Illustration of the Rejection Region
The rejection region (or critical region) is the set of all values of the test statistic that causes us to reject the
null hypothesis.
The non-rejection region (or acceptance region) is the set of all values of the test statistic that causes us to
fail to reject the null hypothesis.
The critical value is a point (boundary) on the test distribution that is compared to the test statistic to
determine if the null hypothesis would
be rejected.
*From the table of t-values, determine the critical value. Use df = n-1 = 9, one-tailedtest at 5% level of significance.
*The critical t-value is 1.833.
How did we get that value?
Look at this illustration!
Now, you can sketch a t distribution curve and label showing the rejection area (shaded part), the non-rejection region,
the critical value, and the computed t-value. This is how your t distribution curve should look like!
The computed value is lessthan the critical value.
LESSON1.2
Parameters to be Testedin Real-Life Problem
What is in
REVIEW
In Lesson 1.1, you have learned the basic concepts, as well as the elements of hypothesis testing.
Null Hypothesis is a claim about the population which state no difference, no changes, or no relationship
between or among variables.
Alternative hypothesis is a claim about the population which state differences, changes, relationship between
or among variables.
Level of significance is the probability of committing Type I error.
Critical region also known as rejection region, is a range of values that corresponds to the rejection of the null
hypothesis.
Type I error is an error committed when rejecting a true null hypothesis.
Type II error is an error committed when accepting a false null hypothesis
IDENTIFYING PARAMETER TO BE TESTED
Illustrative Examples:
1. The average height of adult Filipinos 20 years and older is 163 cm for males.
Parameter: the average height of adult Filipinos 20 years and older
In hypothesis testing, the parameter will be translated into symbols such as 𝛍=𝟏𝟔𝟑 where 𝛍 is the symbol for
mean/average and 163 is the value that pertains to the average height.
2. A Grade 11 researcher reported that the average allowance of Senior High School students is ₱100. A
sample of 40 students has mean allowance of ₱120. At 𝛼=0.01 test, it was the claimed that the students had
allowance of ₱ 100. The standard deviation of the population is ₱50.
Parameters: the average allowance of Senior High School students is ₱100 or 𝝁=₱𝟏𝟎𝟎
(PLEASE ANSWER THE FOLLOWING IN YOUR YELLO PAD)
ACTIVITY 1.
Directions: Complete the following statements. Write the answers in your notebook.
1. _________________________is a statistical method that is used in making decisions using experimental
data.
2. A ________________________ is a proposed explanation, assertion, or assumption about a population
parameter or about the distribution of a random variable.
3. The null hypothesis is an initial claim which the researcher tries to
______________________________________.
4. The alternative hypothesis is contrary to the ______________________________________.
5. The level of significance is denoted by_______________________.
6. The significance level α is also the probability of making the wrong decision when
____________________________________.
7. When the alternative hypothesis is two-sided, it is called _____________________________.
8. When the given statistics hypothesis assumes a less than or greater than value, it is called
______________________________.
9. The rejection region (or critical region) is the set of all values of the test statistic that cause us to
________________________________ .
10. Rejecting the null hypothesis when it is true results to what type of error?
________________________________.
ACTIVITY 2.

More Related Content

Similar to Statistics and Probability Q4_M1_LAS .docx

Presentation chi-square test & Anova
Presentation   chi-square test & AnovaPresentation   chi-square test & Anova
Presentation chi-square test & AnovaSonnappan Sridhar
 
What So Funny About Proportion Testv3
What So Funny About Proportion Testv3What So Funny About Proportion Testv3
What So Funny About Proportion Testv3ChrisConnors
 
STATISTICS : Changing the way we do: Hypothesis testing, effect size, power, ...
STATISTICS : Changing the way we do: Hypothesis testing, effect size, power, ...STATISTICS : Changing the way we do: Hypothesis testing, effect size, power, ...
STATISTICS : Changing the way we do: Hypothesis testing, effect size, power, ...Musfera Nara Vadia
 
6-Inferential-Statistics.pptx
6-Inferential-Statistics.pptx6-Inferential-Statistics.pptx
6-Inferential-Statistics.pptxsordillasecondsem
 
Hypothesis testing
Hypothesis testingHypothesis testing
Hypothesis testingNirajan Bam
 
Statistics and Probability Testing Hypothesis.pptx
Statistics and Probability Testing Hypothesis.pptxStatistics and Probability Testing Hypothesis.pptx
Statistics and Probability Testing Hypothesis.pptxClarizaJaneMetro1
 
Testing of Hypothesis combined with tests.pdf
Testing of Hypothesis combined with tests.pdfTesting of Hypothesis combined with tests.pdf
Testing of Hypothesis combined with tests.pdfRamBk5
 
© 2014 Laureate Education, Inc. Page 1 of 5 Week 4 A.docx
© 2014 Laureate Education, Inc.   Page 1 of 5  Week 4 A.docx© 2014 Laureate Education, Inc.   Page 1 of 5  Week 4 A.docx
© 2014 Laureate Education, Inc. Page 1 of 5 Week 4 A.docxgerardkortney
 
Testing of hypothesis - large sample test
Testing of hypothesis - large sample testTesting of hypothesis - large sample test
Testing of hypothesis - large sample testParag Shah
 
Topic 10 DATA ANALYSIS TECHNIQUES.pptx
Topic 10 DATA ANALYSIS TECHNIQUES.pptxTopic 10 DATA ANALYSIS TECHNIQUES.pptx
Topic 10 DATA ANALYSIS TECHNIQUES.pptxEdwinDagunot4
 
Hypothesis testing
Hypothesis testingHypothesis testing
Hypothesis testingAfra Fathima
 
QNT 275 Inspiring Innovation / tutorialrank.com
QNT 275 Inspiring Innovation / tutorialrank.comQNT 275 Inspiring Innovation / tutorialrank.com
QNT 275 Inspiring Innovation / tutorialrank.comBromleyz33
 
Name________________________________PSU ID______________________.docx
Name________________________________PSU ID______________________.docxName________________________________PSU ID______________________.docx
Name________________________________PSU ID______________________.docxrosemarybdodson23141
 

Similar to Statistics and Probability Q4_M1_LAS .docx (20)

Presentation chi-square test & Anova
Presentation   chi-square test & AnovaPresentation   chi-square test & Anova
Presentation chi-square test & Anova
 
What So Funny About Proportion Testv3
What So Funny About Proportion Testv3What So Funny About Proportion Testv3
What So Funny About Proportion Testv3
 
STATISTICS : Changing the way we do: Hypothesis testing, effect size, power, ...
STATISTICS : Changing the way we do: Hypothesis testing, effect size, power, ...STATISTICS : Changing the way we do: Hypothesis testing, effect size, power, ...
STATISTICS : Changing the way we do: Hypothesis testing, effect size, power, ...
 
312320.pptx
312320.pptx312320.pptx
312320.pptx
 
Testing of hypothesis
Testing of hypothesisTesting of hypothesis
Testing of hypothesis
 
6-Inferential-Statistics.pptx
6-Inferential-Statistics.pptx6-Inferential-Statistics.pptx
6-Inferential-Statistics.pptx
 
Hypothesis testing
Hypothesis testingHypothesis testing
Hypothesis testing
 
Tests of significance
Tests of significanceTests of significance
Tests of significance
 
Statistics and Probability Testing Hypothesis.pptx
Statistics and Probability Testing Hypothesis.pptxStatistics and Probability Testing Hypothesis.pptx
Statistics and Probability Testing Hypothesis.pptx
 
Hypothesis
HypothesisHypothesis
Hypothesis
 
Thesigntest
ThesigntestThesigntest
Thesigntest
 
Testing of Hypothesis combined with tests.pdf
Testing of Hypothesis combined with tests.pdfTesting of Hypothesis combined with tests.pdf
Testing of Hypothesis combined with tests.pdf
 
Hypothesis
HypothesisHypothesis
Hypothesis
 
© 2014 Laureate Education, Inc. Page 1 of 5 Week 4 A.docx
© 2014 Laureate Education, Inc.   Page 1 of 5  Week 4 A.docx© 2014 Laureate Education, Inc.   Page 1 of 5  Week 4 A.docx
© 2014 Laureate Education, Inc. Page 1 of 5 Week 4 A.docx
 
Testing of hypothesis - large sample test
Testing of hypothesis - large sample testTesting of hypothesis - large sample test
Testing of hypothesis - large sample test
 
Topic 10 DATA ANALYSIS TECHNIQUES.pptx
Topic 10 DATA ANALYSIS TECHNIQUES.pptxTopic 10 DATA ANALYSIS TECHNIQUES.pptx
Topic 10 DATA ANALYSIS TECHNIQUES.pptx
 
Hypothesis testing
Hypothesis testingHypothesis testing
Hypothesis testing
 
QNT 275 Inspiring Innovation / tutorialrank.com
QNT 275 Inspiring Innovation / tutorialrank.comQNT 275 Inspiring Innovation / tutorialrank.com
QNT 275 Inspiring Innovation / tutorialrank.com
 
Hypothesis .pptx
Hypothesis .pptxHypothesis .pptx
Hypothesis .pptx
 
Name________________________________PSU ID______________________.docx
Name________________________________PSU ID______________________.docxName________________________________PSU ID______________________.docx
Name________________________________PSU ID______________________.docx
 

Recently uploaded

Introduction to ArtificiaI Intelligence in Higher Education
Introduction to ArtificiaI Intelligence in Higher EducationIntroduction to ArtificiaI Intelligence in Higher Education
Introduction to ArtificiaI Intelligence in Higher Educationpboyjonauth
 
Employee wellbeing at the workplace.pptx
Employee wellbeing at the workplace.pptxEmployee wellbeing at the workplace.pptx
Employee wellbeing at the workplace.pptxNirmalaLoungPoorunde1
 
POINT- BIOCHEMISTRY SEM 2 ENZYMES UNIT 5.pptx
POINT- BIOCHEMISTRY SEM 2 ENZYMES UNIT 5.pptxPOINT- BIOCHEMISTRY SEM 2 ENZYMES UNIT 5.pptx
POINT- BIOCHEMISTRY SEM 2 ENZYMES UNIT 5.pptxSayali Powar
 
Measures of Central Tendency: Mean, Median and Mode
Measures of Central Tendency: Mean, Median and ModeMeasures of Central Tendency: Mean, Median and Mode
Measures of Central Tendency: Mean, Median and ModeThiyagu K
 
Concept of Vouching. B.Com(Hons) /B.Compdf
Concept of Vouching. B.Com(Hons) /B.CompdfConcept of Vouching. B.Com(Hons) /B.Compdf
Concept of Vouching. B.Com(Hons) /B.CompdfUmakantAnnand
 
APM Welcome, APM North West Network Conference, Synergies Across Sectors
APM Welcome, APM North West Network Conference, Synergies Across SectorsAPM Welcome, APM North West Network Conference, Synergies Across Sectors
APM Welcome, APM North West Network Conference, Synergies Across SectorsAssociation for Project Management
 
Organic Name Reactions for the students and aspirants of Chemistry12th.pptx
Organic Name Reactions  for the students and aspirants of Chemistry12th.pptxOrganic Name Reactions  for the students and aspirants of Chemistry12th.pptx
Organic Name Reactions for the students and aspirants of Chemistry12th.pptxVS Mahajan Coaching Centre
 
The basics of sentences session 2pptx copy.pptx
The basics of sentences session 2pptx copy.pptxThe basics of sentences session 2pptx copy.pptx
The basics of sentences session 2pptx copy.pptxheathfieldcps1
 
MENTAL STATUS EXAMINATION format.docx
MENTAL     STATUS EXAMINATION format.docxMENTAL     STATUS EXAMINATION format.docx
MENTAL STATUS EXAMINATION format.docxPoojaSen20
 
CARE OF CHILD IN INCUBATOR..........pptx
CARE OF CHILD IN INCUBATOR..........pptxCARE OF CHILD IN INCUBATOR..........pptx
CARE OF CHILD IN INCUBATOR..........pptxGaneshChakor2
 
Alper Gobel In Media Res Media Component
Alper Gobel In Media Res Media ComponentAlper Gobel In Media Res Media Component
Alper Gobel In Media Res Media ComponentInMediaRes1
 
Mastering the Unannounced Regulatory Inspection
Mastering the Unannounced Regulatory InspectionMastering the Unannounced Regulatory Inspection
Mastering the Unannounced Regulatory InspectionSafetyChain Software
 
Accessible design: Minimum effort, maximum impact
Accessible design: Minimum effort, maximum impactAccessible design: Minimum effort, maximum impact
Accessible design: Minimum effort, maximum impactdawncurless
 
Software Engineering Methodologies (overview)
Software Engineering Methodologies (overview)Software Engineering Methodologies (overview)
Software Engineering Methodologies (overview)eniolaolutunde
 
Presiding Officer Training module 2024 lok sabha elections
Presiding Officer Training module 2024 lok sabha electionsPresiding Officer Training module 2024 lok sabha elections
Presiding Officer Training module 2024 lok sabha electionsanshu789521
 
Kisan Call Centre - To harness potential of ICT in Agriculture by answer farm...
Kisan Call Centre - To harness potential of ICT in Agriculture by answer farm...Kisan Call Centre - To harness potential of ICT in Agriculture by answer farm...
Kisan Call Centre - To harness potential of ICT in Agriculture by answer farm...Krashi Coaching
 
Paris 2024 Olympic Geographies - an activity
Paris 2024 Olympic Geographies - an activityParis 2024 Olympic Geographies - an activity
Paris 2024 Olympic Geographies - an activityGeoBlogs
 
Contemporary philippine arts from the regions_PPT_Module_12 [Autosaved] (1).pptx
Contemporary philippine arts from the regions_PPT_Module_12 [Autosaved] (1).pptxContemporary philippine arts from the regions_PPT_Module_12 [Autosaved] (1).pptx
Contemporary philippine arts from the regions_PPT_Module_12 [Autosaved] (1).pptxRoyAbrique
 

Recently uploaded (20)

Introduction to ArtificiaI Intelligence in Higher Education
Introduction to ArtificiaI Intelligence in Higher EducationIntroduction to ArtificiaI Intelligence in Higher Education
Introduction to ArtificiaI Intelligence in Higher Education
 
Employee wellbeing at the workplace.pptx
Employee wellbeing at the workplace.pptxEmployee wellbeing at the workplace.pptx
Employee wellbeing at the workplace.pptx
 
POINT- BIOCHEMISTRY SEM 2 ENZYMES UNIT 5.pptx
POINT- BIOCHEMISTRY SEM 2 ENZYMES UNIT 5.pptxPOINT- BIOCHEMISTRY SEM 2 ENZYMES UNIT 5.pptx
POINT- BIOCHEMISTRY SEM 2 ENZYMES UNIT 5.pptx
 
Measures of Central Tendency: Mean, Median and Mode
Measures of Central Tendency: Mean, Median and ModeMeasures of Central Tendency: Mean, Median and Mode
Measures of Central Tendency: Mean, Median and Mode
 
Model Call Girl in Bikash Puri Delhi reach out to us at 🔝9953056974🔝
Model Call Girl in Bikash Puri  Delhi reach out to us at 🔝9953056974🔝Model Call Girl in Bikash Puri  Delhi reach out to us at 🔝9953056974🔝
Model Call Girl in Bikash Puri Delhi reach out to us at 🔝9953056974🔝
 
Concept of Vouching. B.Com(Hons) /B.Compdf
Concept of Vouching. B.Com(Hons) /B.CompdfConcept of Vouching. B.Com(Hons) /B.Compdf
Concept of Vouching. B.Com(Hons) /B.Compdf
 
Staff of Color (SOC) Retention Efforts DDSD
Staff of Color (SOC) Retention Efforts DDSDStaff of Color (SOC) Retention Efforts DDSD
Staff of Color (SOC) Retention Efforts DDSD
 
APM Welcome, APM North West Network Conference, Synergies Across Sectors
APM Welcome, APM North West Network Conference, Synergies Across SectorsAPM Welcome, APM North West Network Conference, Synergies Across Sectors
APM Welcome, APM North West Network Conference, Synergies Across Sectors
 
Organic Name Reactions for the students and aspirants of Chemistry12th.pptx
Organic Name Reactions  for the students and aspirants of Chemistry12th.pptxOrganic Name Reactions  for the students and aspirants of Chemistry12th.pptx
Organic Name Reactions for the students and aspirants of Chemistry12th.pptx
 
The basics of sentences session 2pptx copy.pptx
The basics of sentences session 2pptx copy.pptxThe basics of sentences session 2pptx copy.pptx
The basics of sentences session 2pptx copy.pptx
 
MENTAL STATUS EXAMINATION format.docx
MENTAL     STATUS EXAMINATION format.docxMENTAL     STATUS EXAMINATION format.docx
MENTAL STATUS EXAMINATION format.docx
 
CARE OF CHILD IN INCUBATOR..........pptx
CARE OF CHILD IN INCUBATOR..........pptxCARE OF CHILD IN INCUBATOR..........pptx
CARE OF CHILD IN INCUBATOR..........pptx
 
Alper Gobel In Media Res Media Component
Alper Gobel In Media Res Media ComponentAlper Gobel In Media Res Media Component
Alper Gobel In Media Res Media Component
 
Mastering the Unannounced Regulatory Inspection
Mastering the Unannounced Regulatory InspectionMastering the Unannounced Regulatory Inspection
Mastering the Unannounced Regulatory Inspection
 
Accessible design: Minimum effort, maximum impact
Accessible design: Minimum effort, maximum impactAccessible design: Minimum effort, maximum impact
Accessible design: Minimum effort, maximum impact
 
Software Engineering Methodologies (overview)
Software Engineering Methodologies (overview)Software Engineering Methodologies (overview)
Software Engineering Methodologies (overview)
 
Presiding Officer Training module 2024 lok sabha elections
Presiding Officer Training module 2024 lok sabha electionsPresiding Officer Training module 2024 lok sabha elections
Presiding Officer Training module 2024 lok sabha elections
 
Kisan Call Centre - To harness potential of ICT in Agriculture by answer farm...
Kisan Call Centre - To harness potential of ICT in Agriculture by answer farm...Kisan Call Centre - To harness potential of ICT in Agriculture by answer farm...
Kisan Call Centre - To harness potential of ICT in Agriculture by answer farm...
 
Paris 2024 Olympic Geographies - an activity
Paris 2024 Olympic Geographies - an activityParis 2024 Olympic Geographies - an activity
Paris 2024 Olympic Geographies - an activity
 
Contemporary philippine arts from the regions_PPT_Module_12 [Autosaved] (1).pptx
Contemporary philippine arts from the regions_PPT_Module_12 [Autosaved] (1).pptxContemporary philippine arts from the regions_PPT_Module_12 [Autosaved] (1).pptx
Contemporary philippine arts from the regions_PPT_Module_12 [Autosaved] (1).pptx
 

Statistics and Probability Q4_M1_LAS .docx

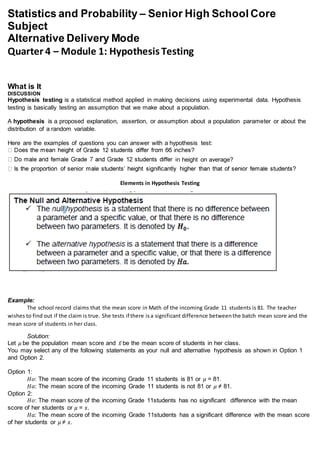
  • 1. Statistics and Probability – Senior High School Core Subject Alternative Delivery Mode Quarter 4 – Module 1: Hypothesis Testing What is It DISCUSSION Hypothesis testing is a statistical method applied in making decisions using experimental data. Hypothesis testing is basically testing an assumption that we make about a population. A hypothesis is a proposed explanation, assertion, or assumption about a population parameter or about the distribution of a random variable. Here are the examples of questions you can answer with a hypothesis test: n height on average? Elements in Hypothesis Testing Example: The school record claims that the mean score in Math of the incoming Grade 11 students is 81. The teacher wishes to find out if the claim is true. She tests if there isa significant difference betweenthe batch mean score and the mean score of students in her class. Solution: Let 𝜇 be the population mean score and 𝑥̅ be the mean score of students in her class. You may select any of the following statements as your null and alternative hypothesis as shown in Option 1 and Option 2. Option 1: 𝐻𝑜: The mean score of the incoming Grade 11 students is 81 or 𝜇 = 81. 𝐻𝑎: The mean score of the incoming Grade 11 students is not 81 or 𝜇 ≠ 81. Option 2: 𝐻𝑜: The mean score of the incoming Grade 11students has no significant difference with the mean score of her students or 𝜇 = 𝑥̅. 𝐻𝑎: The mean score of the incoming Grade 11students has a significant difference with the mean score of her students or 𝜇 ≠ 𝑥̅.
  • 2. Here is another element Example: Jhona uses 5% level of significance in proving that there is no significant change in the average number of enrolle esin the 10 sections for the last two years. It means that the chance that the null hypothesis (𝐻𝑜) would be rejected when it is true is 5%. Two-Tailed Test vs One-Tailed Test When the alternative hypothesis is to-sided like 𝐻𝑎 : 𝜇 ≠ 𝜇0, it is called two-tailed test. When the given statistic hypothesis assumes a less than or greater than value, it is called one-tailed test. Illustration of the Rejection Region The rejection region (or critical region) is the set of all values of the test statistic that causes us to reject the null hypothesis. The non-rejection region (or acceptance region) is the set of all values of the test statistic that causes us to fail to reject the null hypothesis. The critical value is a point (boundary) on the test distribution that is compared to the test statistic to determine if the null hypothesis would be rejected.
  • 3. *From the table of t-values, determine the critical value. Use df = n-1 = 9, one-tailedtest at 5% level of significance. *The critical t-value is 1.833. How did we get that value? Look at this illustration!
  • 4. Now, you can sketch a t distribution curve and label showing the rejection area (shaded part), the non-rejection region, the critical value, and the computed t-value. This is how your t distribution curve should look like! The computed value is lessthan the critical value. LESSON1.2 Parameters to be Testedin Real-Life Problem What is in REVIEW In Lesson 1.1, you have learned the basic concepts, as well as the elements of hypothesis testing. Null Hypothesis is a claim about the population which state no difference, no changes, or no relationship between or among variables. Alternative hypothesis is a claim about the population which state differences, changes, relationship between or among variables. Level of significance is the probability of committing Type I error. Critical region also known as rejection region, is a range of values that corresponds to the rejection of the null hypothesis. Type I error is an error committed when rejecting a true null hypothesis. Type II error is an error committed when accepting a false null hypothesis IDENTIFYING PARAMETER TO BE TESTED Illustrative Examples: 1. The average height of adult Filipinos 20 years and older is 163 cm for males. Parameter: the average height of adult Filipinos 20 years and older In hypothesis testing, the parameter will be translated into symbols such as 𝛍=𝟏𝟔𝟑 where 𝛍 is the symbol for mean/average and 163 is the value that pertains to the average height. 2. A Grade 11 researcher reported that the average allowance of Senior High School students is ₱100. A sample of 40 students has mean allowance of ₱120. At 𝛼=0.01 test, it was the claimed that the students had allowance of ₱ 100. The standard deviation of the population is ₱50. Parameters: the average allowance of Senior High School students is ₱100 or 𝝁=₱𝟏𝟎𝟎
  • 5. (PLEASE ANSWER THE FOLLOWING IN YOUR YELLO PAD) ACTIVITY 1. Directions: Complete the following statements. Write the answers in your notebook. 1. _________________________is a statistical method that is used in making decisions using experimental data. 2. A ________________________ is a proposed explanation, assertion, or assumption about a population parameter or about the distribution of a random variable. 3. The null hypothesis is an initial claim which the researcher tries to ______________________________________. 4. The alternative hypothesis is contrary to the ______________________________________. 5. The level of significance is denoted by_______________________. 6. The significance level α is also the probability of making the wrong decision when ____________________________________. 7. When the alternative hypothesis is two-sided, it is called _____________________________. 8. When the given statistics hypothesis assumes a less than or greater than value, it is called ______________________________. 9. The rejection region (or critical region) is the set of all values of the test statistic that cause us to ________________________________ . 10. Rejecting the null hypothesis when it is true results to what type of error? ________________________________. ACTIVITY 2.