SlideShare a Scribd company logo
Janica Jain, Cindy Villamil, Sylvain Jaume, Data Science Graduate Program, Department of Computer Science, Saint Peter’s University, Jersey City, NJ
ABSTRACT
This study looks at various socio-economic factors that have been identified by other researchers as important influences on weight imbalance in the American population: physical activity rates, sugar consumption, availability of physician care,
growth of fast food restaurants, lack of sleep, prescription drugs, and alcohol consumption. Regression analysis is used to determine which among the independent variables are related to the dependent variable (overweight and obesity rates)
and to explore the forms of these relationships. Currently, the obesity epidemic is known to be one of America’s most severe and fastest growing health complications. The growing obesity rates in the country lead to numerous other significant
health problems and contribute to intensified rates of more than 50 severe diseases. These circumstances furthermore create major pressure on America’s health care system. However, it is not exactly clear as to why the prevalence of obesity
has increased so dramatically over the last 30 years.
INTRODUCTION
Obesity is defined as having a body mass index (BMI) of 30 or more, which equals weight in kilograms
divided by height in meters squared (Centers for Disease Control and Prevention, 2008). The sudden
increase in overweight individuals and the epidemic of obesity in America is currently a major public
health fear. Obesity furthermore causes abundant health problems which include but are not limited to:
diabetes, hypertension, high cholesterol, cardiovascular diseases, asthma, arthritis, and even forms of
cancer. In this study we wish to understand why obesity is higher in the United States than in any other
developed country.
METHODOLOGY
Regression analysis was used for the investigation of relationship between the variables and the dependent variable, obesity. We
sought to ascertain the casual effect of the variables upon obesity. We also assessed the “statistical significance” of 95% to the
estimated relationships, which was the degree of confidence that the true relationship is close to the estimated relationship. We might
resolve that the null hypothesis is implausible if the t-statistic associated with our regression estimate lies so far out in one tail of its t-
distribution that such a value, or one even larger in absolute value, would arise less than, say, 5 percent of the time if the null
hypothesis is correct. We will also take into account the P-value, which will tell us how confident we can be that each individual
variable has some correlation with the dependent variable.
RESULTS
CONCLUSION
The only factor for which we did not see an influence on overweight and obesity rates was the delivery of sugar for consumption in different industries in the US. However,
when focusing on the delivery of sugar for consumption through sugary beverages, we saw a strong influence. We also discovered that lack of sleep, lack of physical
activity and low physician availability to citizens were the strongest strong influences on heightened overweight and obesity rates, while also confirming that alcohol
consumption and fast food restaurant growth would be strong influences as well. The factor that seemed to play a minor role in the increase of overweight and obesity
rates was the consumption of prescribed antidepressants. However, this was compared to the population as a whole, and we think it would be interesting to see the
change in overweight and obesity rates in people who consume them only. Obesity is becoming an epidemic in the United States and any knowledge that can be gathered
to prevent it from affecting more people is beneficial.
REFERENCES
• The Organization for Economic Cooperation and Development
• Baum, C., & Yi-Chou, S. (2011). The Socio-Economic Causes of Obesity (Paper
No.17423). New York, NY: The National Bureau of Economic Research.
• Cutler, D., Glaesar, E., & Shapiro, J. (2003). Why Have Americans Become More Obese?
Journal of Economic Perspectives, LXXI(3), 93-118
• Knutson, K., & Cauter, E. (2008). Associations between Sleep Loss and Increased Risk of
Obesity and Diabetes. Chicago, Illinois, USA. University of Chicago, Department of Health
Studies.
Regression Analysis of Socio-Economic Factors Leading to Increased
Body Weight and Obesity in America
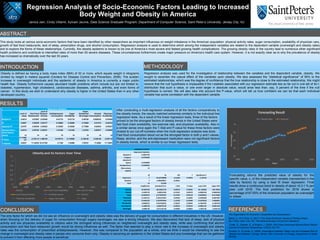
Forecasting returns the predicted value of obesity for the
specific value, x, of the independent variable (represented in the
data by factors) by using a best fit linear regression. Final
results show a continuous trend in obesity of about <0.3-1 % per
year until 2018. The final prediction for 2018 shows a
percentage of 67.93% of the American population as overweight
or obese.
Regression Statistics
Lack of
sleep
Fast Food
Restaurants
Lack of
Physical
Activity
Antidepressant
Consumption
Sugar
Availability
Sugar-
Sweetened
Beverages
Alcohol
Consumption
Physician
Availability
Multiple R 0.9414 0.97907 0.97846 0.61714 0.61714 0.89140 0.956410 0.97854
R2 0.8861 0.95858 0.95737 0.38086 0.38086 0.79460 0.91472 0.95753
Adjusted R2 0.8767 0.95540 0.95382 0.32926 0.32926 0.77880 0.90816 0.95427
Standard Error 0.8210 0.55765 0.50231 1.91440 1.91440 1.24183 0.80017 0.56466
Observations
(years) 14 14 14 14 14 14 14 14
P-Value
5.1740E
-07
2.27E-10 1.38E-09 0.018714 0.170848 8.15E-06 2.53E-08 2.67E-10
T-Statistic 9.6641 17.34555 16.41706 2.7169 1.44966 7.09161 11.8085 17.12091
SUMMARY OUTPUT
Regression Statistics
Multiple R 0.9897196
R Square 0.9795449
Adjusted R
Square 0.9590898
Standard Error 0.5340544
Observations 15
ANOVA
df SS MS F Significance F
Regression 7 95.60750098 13.6582 47.8876 2.19E-05
Residual 7 1.996499017 0.28521
Total 14 97.604
Coefficients Standard Error t Stat P-value Lower 95% Upper 95%
Obesity 33.807146 48.63021776 0.69519 0.50935 -81.185046 148.79934
Alcohol -2.649E-05 0.00012236 -0.21647 0.83479 -0.0003158 0.0002628
Sleep -0.0394214 0.277870747 -0.14187 0.89118 -0.6964813 0.6176385
Physicians 0.1301715 0.201527667 0.64592 0.53892 -0.3463658 0.6067087
Fast Food 0.3645159 0.297074354 1.22702 0.25948 -0.3379533 1.0669851
No Exercise 2.8406219 4.037426425 0.70357 0.50442 -6.7063745 12.387618
Anti-Depress -4.468E-06 4.84873E-05 -0.09216 0.92915 -0.0001191 0.0001102
Beverages 4.688E-06 8.27112E-06 0.56685 0.58852 -1.487E-05 2.425E-05
After conducting a multi-regression analysis of all the factors comparatively to
the obesity trends, the results matched extremely similarly to the individual line
regression tests. As a result of the linear regression tests, three of the factors
proved to be the strongest factors of obesity trends in the United States were:
fast food chain availability, low exercise rate, and physician availability. Also in
a similar sense once again the T-Stat and P-value for these three factors were
closest to our cut-off numbers when the multi-regression analysis was done.
Fast food consumption stood out as the strongest factor in both p and t values.
Sleep, alcohol, and the anti-depressant medication were not significant factors
in obesity trends, which is similar to our linear regression tests.

More Related Content

What's hot

Logistic regression with SPSS
Logistic regression with SPSSLogistic regression with SPSS
Logistic regression with SPSS
LNIPE
 
Regression (Linear Regression and Logistic Regression) by Akanksha Bali
Regression (Linear Regression and Logistic Regression) by Akanksha BaliRegression (Linear Regression and Logistic Regression) by Akanksha Bali
Regression (Linear Regression and Logistic Regression) by Akanksha Bali
Akanksha Bali
 
Logistic regression
Logistic regressionLogistic regression
Logistic regression
VARUN KUMAR
 
Reporting Mann Whitney U Test in APA
Reporting Mann Whitney U Test in APAReporting Mann Whitney U Test in APA
Reporting Mann Whitney U Test in APA
Ken Plummer
 
Chapter 1 spc
Chapter 1   spcChapter 1   spc
Chapter 1 spc
Jitesh Gaurav
 
Critical appraisal of diagnostic article
Critical appraisal of diagnostic articleCritical appraisal of diagnostic article
Critical appraisal of diagnostic articleDr. Faisal Al Haddad
 
Multicollinearity PPT
Multicollinearity PPTMulticollinearity PPT
Multicollinearity PPT
GunjanKhandelwal13
 
Types of bias
Types of biasTypes of bias
Types of bias
DrDiplinaBarman
 
Reporting a single sample t test
Reporting a single sample t testReporting a single sample t test
Reporting a single sample t test
Ken Plummer
 
Binary OR Binomial logistic regression
Binary OR Binomial logistic regression Binary OR Binomial logistic regression
Binary OR Binomial logistic regression
Dr Athar Khan
 
Introduction to Generalized Linear Models
Introduction to Generalized Linear ModelsIntroduction to Generalized Linear Models
Introduction to Generalized Linear Models
richardchandler
 
Reporting a Kruskal Wallis Test
Reporting a Kruskal Wallis TestReporting a Kruskal Wallis Test
Reporting a Kruskal Wallis Test
Ken Plummer
 
Multiple linear regression
Multiple linear regressionMultiple linear regression
Multiple linear regression
Ken Plummer
 
Anova lecture
Anova lectureAnova lecture
Anova lecture
doublem44
 
Simple Regression
Simple RegressionSimple Regression
Simple Regression
Khawaja Naveed
 
Reporting pearson correlation in apa
Reporting pearson correlation in apaReporting pearson correlation in apa
Reporting pearson correlation in apa
Ken Plummer
 
Cox model
Cox modelCox model
Cox model
Veronica Navia
 

What's hot (20)

Logistic regression with SPSS
Logistic regression with SPSSLogistic regression with SPSS
Logistic regression with SPSS
 
Regression (Linear Regression and Logistic Regression) by Akanksha Bali
Regression (Linear Regression and Logistic Regression) by Akanksha BaliRegression (Linear Regression and Logistic Regression) by Akanksha Bali
Regression (Linear Regression and Logistic Regression) by Akanksha Bali
 
Logistic regression
Logistic regressionLogistic regression
Logistic regression
 
Reporting Mann Whitney U Test in APA
Reporting Mann Whitney U Test in APAReporting Mann Whitney U Test in APA
Reporting Mann Whitney U Test in APA
 
Chapter 1 spc
Chapter 1   spcChapter 1   spc
Chapter 1 spc
 
Critical appraisal of diagnostic article
Critical appraisal of diagnostic articleCritical appraisal of diagnostic article
Critical appraisal of diagnostic article
 
Multicollinearity PPT
Multicollinearity PPTMulticollinearity PPT
Multicollinearity PPT
 
Types of bias
Types of biasTypes of bias
Types of bias
 
Reporting a single sample t test
Reporting a single sample t testReporting a single sample t test
Reporting a single sample t test
 
Binary OR Binomial logistic regression
Binary OR Binomial logistic regression Binary OR Binomial logistic regression
Binary OR Binomial logistic regression
 
Ch07 ans
Ch07 ansCh07 ans
Ch07 ans
 
Introduction to Generalized Linear Models
Introduction to Generalized Linear ModelsIntroduction to Generalized Linear Models
Introduction to Generalized Linear Models
 
Meta analysis with R
Meta analysis with RMeta analysis with R
Meta analysis with R
 
Reporting a Kruskal Wallis Test
Reporting a Kruskal Wallis TestReporting a Kruskal Wallis Test
Reporting a Kruskal Wallis Test
 
Multiple linear regression
Multiple linear regressionMultiple linear regression
Multiple linear regression
 
Anova lecture
Anova lectureAnova lecture
Anova lecture
 
Simple Regression
Simple RegressionSimple Regression
Simple Regression
 
Reporting pearson correlation in apa
Reporting pearson correlation in apaReporting pearson correlation in apa
Reporting pearson correlation in apa
 
Econometrics chapter 8
Econometrics chapter 8Econometrics chapter 8
Econometrics chapter 8
 
Cox model
Cox modelCox model
Cox model
 

Similar to Regression Analysis Poster

New Perspectives on Alzheimer’s Disease and Nutrition
New Perspectives on Alzheimer’s Disease and NutritionNew Perspectives on Alzheimer’s Disease and Nutrition
New Perspectives on Alzheimer’s Disease and Nutrition
Nutricia
 
DISSERTATION
DISSERTATIONDISSERTATION
DISSERTATIONKate Bray
 
SCOPE AND DELIMITATION OF THE STUDY.docx
SCOPE AND DELIMITATION OF THE STUDY.docxSCOPE AND DELIMITATION OF THE STUDY.docx
SCOPE AND DELIMITATION OF THE STUDY.docx
MarebelManabat
 
1ANNOTATED BIBLIOGRAPHY FOR SEDENTARY LIFESTYLESTHESE ARE.docx
1ANNOTATED  BIBLIOGRAPHY FOR SEDENTARY LIFESTYLESTHESE ARE.docx1ANNOTATED  BIBLIOGRAPHY FOR SEDENTARY LIFESTYLESTHESE ARE.docx
1ANNOTATED BIBLIOGRAPHY FOR SEDENTARY LIFESTYLESTHESE ARE.docx
hyacinthshackley2629
 
STROBE (Strengthening The Reporting of OBservational Studies in Ep.docx
STROBE (Strengthening The Reporting of OBservational Studies in Ep.docxSTROBE (Strengthening The Reporting of OBservational Studies in Ep.docx
STROBE (Strengthening The Reporting of OBservational Studies in Ep.docx
susanschei
 
The role of exercise and physical activity in weight loss and mainting
The role of exercise and physical activity in weight loss and maintingThe role of exercise and physical activity in weight loss and mainting
The role of exercise and physical activity in weight loss and maintingGabriel J Santos
 
Senior Thesis Healthcare Cost
Senior Thesis Healthcare CostSenior Thesis Healthcare Cost
Senior Thesis Healthcare CostNicholas Huffman
 
Steven Gortmaker, Sugar Sweetened Beverage Taxes: Impact on Health, Health Ca...
Steven Gortmaker, Sugar Sweetened Beverage Taxes: Impact on Health, Health Ca...Steven Gortmaker, Sugar Sweetened Beverage Taxes: Impact on Health, Health Ca...
Steven Gortmaker, Sugar Sweetened Beverage Taxes: Impact on Health, Health Ca...
The Petrie-Flom Center for Health Law Policy, Biotechnology, and Bioethics
 
PREVALENCE OF DEPRESSION AND ITS ASSOCIATED FACTORS IN ADULTS WITH DIABETES M...
PREVALENCE OF DEPRESSION AND ITS ASSOCIATED FACTORS IN ADULTS WITH DIABETES M...PREVALENCE OF DEPRESSION AND ITS ASSOCIATED FACTORS IN ADULTS WITH DIABETES M...
PREVALENCE OF DEPRESSION AND ITS ASSOCIATED FACTORS IN ADULTS WITH DIABETES M...
pijans
 
1Running head OBESITY 3Running head OBESITY.docx
1Running head OBESITY 3Running head OBESITY.docx1Running head OBESITY 3Running head OBESITY.docx
1Running head OBESITY 3Running head OBESITY.docx
felicidaddinwoodie
 
Crimson Publishers-Dietary Lifestyle, Way of Life Practices and Corpulence: ...
Crimson Publishers-Dietary Lifestyle, Way of Life Practices and  Corpulence: ...Crimson Publishers-Dietary Lifestyle, Way of Life Practices and  Corpulence: ...
Crimson Publishers-Dietary Lifestyle, Way of Life Practices and Corpulence: ...
Crimsonpublishers-Rehabilitation
 
1Running head OBESITY 4Running head OBESITY.docx
1Running head OBESITY 4Running head OBESITY.docx1Running head OBESITY 4Running head OBESITY.docx
1Running head OBESITY 4Running head OBESITY.docx
vickeryr87
 
Chi square presentation
Chi square presentationChi square presentation
Chi square presentation
Sruthi Bhat
 
Healthy Food Accessibility and Obesity: Case Study of Pennsylvania, USA
Healthy Food Accessibility and Obesity: Case Study of Pennsylvania, USAHealthy Food Accessibility and Obesity: Case Study of Pennsylvania, USA
Healthy Food Accessibility and Obesity: Case Study of Pennsylvania, USA
rsmahabir
 
511vol. 14 • no. 5 American Journal of Lifestyle Medicine.docx
511vol. 14 • no. 5 American Journal of Lifestyle Medicine.docx511vol. 14 • no. 5 American Journal of Lifestyle Medicine.docx
511vol. 14 • no. 5 American Journal of Lifestyle Medicine.docx
standfordabbot
 
Statistical analysis of risk factors associated with
Statistical analysis of risk factors associated withStatistical analysis of risk factors associated with
Statistical analysis of risk factors associated with
anamjavaid13
 
Statistical analysis of risk factors associated with
Statistical analysis of risk factors associated withStatistical analysis of risk factors associated with
Statistical analysis of risk factors associated with
anamjavaid13
 
Chewing the saturated fat: should we or shouldn't we?
Chewing the saturated fat: should we or shouldn't we?Chewing the saturated fat: should we or shouldn't we?
Chewing the saturated fat: should we or shouldn't we?
Simon Thornley
 
Integrated Cancer Prevention
Integrated Cancer Prevention Integrated Cancer Prevention
Integrated Cancer Prevention
Lisa Nelson
 

Similar to Regression Analysis Poster (20)

New Perspectives on Alzheimer’s Disease and Nutrition
New Perspectives on Alzheimer’s Disease and NutritionNew Perspectives on Alzheimer’s Disease and Nutrition
New Perspectives on Alzheimer’s Disease and Nutrition
 
DISSERTATION
DISSERTATIONDISSERTATION
DISSERTATION
 
SCOPE AND DELIMITATION OF THE STUDY.docx
SCOPE AND DELIMITATION OF THE STUDY.docxSCOPE AND DELIMITATION OF THE STUDY.docx
SCOPE AND DELIMITATION OF THE STUDY.docx
 
1ANNOTATED BIBLIOGRAPHY FOR SEDENTARY LIFESTYLESTHESE ARE.docx
1ANNOTATED  BIBLIOGRAPHY FOR SEDENTARY LIFESTYLESTHESE ARE.docx1ANNOTATED  BIBLIOGRAPHY FOR SEDENTARY LIFESTYLESTHESE ARE.docx
1ANNOTATED BIBLIOGRAPHY FOR SEDENTARY LIFESTYLESTHESE ARE.docx
 
STROBE (Strengthening The Reporting of OBservational Studies in Ep.docx
STROBE (Strengthening The Reporting of OBservational Studies in Ep.docxSTROBE (Strengthening The Reporting of OBservational Studies in Ep.docx
STROBE (Strengthening The Reporting of OBservational Studies in Ep.docx
 
The role of exercise and physical activity in weight loss and mainting
The role of exercise and physical activity in weight loss and maintingThe role of exercise and physical activity in weight loss and mainting
The role of exercise and physical activity in weight loss and mainting
 
Senior Thesis Healthcare Cost
Senior Thesis Healthcare CostSenior Thesis Healthcare Cost
Senior Thesis Healthcare Cost
 
Steven Gortmaker, Sugar Sweetened Beverage Taxes: Impact on Health, Health Ca...
Steven Gortmaker, Sugar Sweetened Beverage Taxes: Impact on Health, Health Ca...Steven Gortmaker, Sugar Sweetened Beverage Taxes: Impact on Health, Health Ca...
Steven Gortmaker, Sugar Sweetened Beverage Taxes: Impact on Health, Health Ca...
 
SAS ePoster2
SAS ePoster2SAS ePoster2
SAS ePoster2
 
PREVALENCE OF DEPRESSION AND ITS ASSOCIATED FACTORS IN ADULTS WITH DIABETES M...
PREVALENCE OF DEPRESSION AND ITS ASSOCIATED FACTORS IN ADULTS WITH DIABETES M...PREVALENCE OF DEPRESSION AND ITS ASSOCIATED FACTORS IN ADULTS WITH DIABETES M...
PREVALENCE OF DEPRESSION AND ITS ASSOCIATED FACTORS IN ADULTS WITH DIABETES M...
 
1Running head OBESITY 3Running head OBESITY.docx
1Running head OBESITY 3Running head OBESITY.docx1Running head OBESITY 3Running head OBESITY.docx
1Running head OBESITY 3Running head OBESITY.docx
 
Crimson Publishers-Dietary Lifestyle, Way of Life Practices and Corpulence: ...
Crimson Publishers-Dietary Lifestyle, Way of Life Practices and  Corpulence: ...Crimson Publishers-Dietary Lifestyle, Way of Life Practices and  Corpulence: ...
Crimson Publishers-Dietary Lifestyle, Way of Life Practices and Corpulence: ...
 
1Running head OBESITY 4Running head OBESITY.docx
1Running head OBESITY 4Running head OBESITY.docx1Running head OBESITY 4Running head OBESITY.docx
1Running head OBESITY 4Running head OBESITY.docx
 
Chi square presentation
Chi square presentationChi square presentation
Chi square presentation
 
Healthy Food Accessibility and Obesity: Case Study of Pennsylvania, USA
Healthy Food Accessibility and Obesity: Case Study of Pennsylvania, USAHealthy Food Accessibility and Obesity: Case Study of Pennsylvania, USA
Healthy Food Accessibility and Obesity: Case Study of Pennsylvania, USA
 
511vol. 14 • no. 5 American Journal of Lifestyle Medicine.docx
511vol. 14 • no. 5 American Journal of Lifestyle Medicine.docx511vol. 14 • no. 5 American Journal of Lifestyle Medicine.docx
511vol. 14 • no. 5 American Journal of Lifestyle Medicine.docx
 
Statistical analysis of risk factors associated with
Statistical analysis of risk factors associated withStatistical analysis of risk factors associated with
Statistical analysis of risk factors associated with
 
Statistical analysis of risk factors associated with
Statistical analysis of risk factors associated withStatistical analysis of risk factors associated with
Statistical analysis of risk factors associated with
 
Chewing the saturated fat: should we or shouldn't we?
Chewing the saturated fat: should we or shouldn't we?Chewing the saturated fat: should we or shouldn't we?
Chewing the saturated fat: should we or shouldn't we?
 
Integrated Cancer Prevention
Integrated Cancer Prevention Integrated Cancer Prevention
Integrated Cancer Prevention
 

Regression Analysis Poster

  • 1. Janica Jain, Cindy Villamil, Sylvain Jaume, Data Science Graduate Program, Department of Computer Science, Saint Peter’s University, Jersey City, NJ ABSTRACT This study looks at various socio-economic factors that have been identified by other researchers as important influences on weight imbalance in the American population: physical activity rates, sugar consumption, availability of physician care, growth of fast food restaurants, lack of sleep, prescription drugs, and alcohol consumption. Regression analysis is used to determine which among the independent variables are related to the dependent variable (overweight and obesity rates) and to explore the forms of these relationships. Currently, the obesity epidemic is known to be one of America’s most severe and fastest growing health complications. The growing obesity rates in the country lead to numerous other significant health problems and contribute to intensified rates of more than 50 severe diseases. These circumstances furthermore create major pressure on America’s health care system. However, it is not exactly clear as to why the prevalence of obesity has increased so dramatically over the last 30 years. INTRODUCTION Obesity is defined as having a body mass index (BMI) of 30 or more, which equals weight in kilograms divided by height in meters squared (Centers for Disease Control and Prevention, 2008). The sudden increase in overweight individuals and the epidemic of obesity in America is currently a major public health fear. Obesity furthermore causes abundant health problems which include but are not limited to: diabetes, hypertension, high cholesterol, cardiovascular diseases, asthma, arthritis, and even forms of cancer. In this study we wish to understand why obesity is higher in the United States than in any other developed country. METHODOLOGY Regression analysis was used for the investigation of relationship between the variables and the dependent variable, obesity. We sought to ascertain the casual effect of the variables upon obesity. We also assessed the “statistical significance” of 95% to the estimated relationships, which was the degree of confidence that the true relationship is close to the estimated relationship. We might resolve that the null hypothesis is implausible if the t-statistic associated with our regression estimate lies so far out in one tail of its t- distribution that such a value, or one even larger in absolute value, would arise less than, say, 5 percent of the time if the null hypothesis is correct. We will also take into account the P-value, which will tell us how confident we can be that each individual variable has some correlation with the dependent variable. RESULTS CONCLUSION The only factor for which we did not see an influence on overweight and obesity rates was the delivery of sugar for consumption in different industries in the US. However, when focusing on the delivery of sugar for consumption through sugary beverages, we saw a strong influence. We also discovered that lack of sleep, lack of physical activity and low physician availability to citizens were the strongest strong influences on heightened overweight and obesity rates, while also confirming that alcohol consumption and fast food restaurant growth would be strong influences as well. The factor that seemed to play a minor role in the increase of overweight and obesity rates was the consumption of prescribed antidepressants. However, this was compared to the population as a whole, and we think it would be interesting to see the change in overweight and obesity rates in people who consume them only. Obesity is becoming an epidemic in the United States and any knowledge that can be gathered to prevent it from affecting more people is beneficial. REFERENCES • The Organization for Economic Cooperation and Development • Baum, C., & Yi-Chou, S. (2011). The Socio-Economic Causes of Obesity (Paper No.17423). New York, NY: The National Bureau of Economic Research. • Cutler, D., Glaesar, E., & Shapiro, J. (2003). Why Have Americans Become More Obese? Journal of Economic Perspectives, LXXI(3), 93-118 • Knutson, K., & Cauter, E. (2008). Associations between Sleep Loss and Increased Risk of Obesity and Diabetes. Chicago, Illinois, USA. University of Chicago, Department of Health Studies. Regression Analysis of Socio-Economic Factors Leading to Increased Body Weight and Obesity in America Forecasting returns the predicted value of obesity for the specific value, x, of the independent variable (represented in the data by factors) by using a best fit linear regression. Final results show a continuous trend in obesity of about <0.3-1 % per year until 2018. The final prediction for 2018 shows a percentage of 67.93% of the American population as overweight or obese. Regression Statistics Lack of sleep Fast Food Restaurants Lack of Physical Activity Antidepressant Consumption Sugar Availability Sugar- Sweetened Beverages Alcohol Consumption Physician Availability Multiple R 0.9414 0.97907 0.97846 0.61714 0.61714 0.89140 0.956410 0.97854 R2 0.8861 0.95858 0.95737 0.38086 0.38086 0.79460 0.91472 0.95753 Adjusted R2 0.8767 0.95540 0.95382 0.32926 0.32926 0.77880 0.90816 0.95427 Standard Error 0.8210 0.55765 0.50231 1.91440 1.91440 1.24183 0.80017 0.56466 Observations (years) 14 14 14 14 14 14 14 14 P-Value 5.1740E -07 2.27E-10 1.38E-09 0.018714 0.170848 8.15E-06 2.53E-08 2.67E-10 T-Statistic 9.6641 17.34555 16.41706 2.7169 1.44966 7.09161 11.8085 17.12091 SUMMARY OUTPUT Regression Statistics Multiple R 0.9897196 R Square 0.9795449 Adjusted R Square 0.9590898 Standard Error 0.5340544 Observations 15 ANOVA df SS MS F Significance F Regression 7 95.60750098 13.6582 47.8876 2.19E-05 Residual 7 1.996499017 0.28521 Total 14 97.604 Coefficients Standard Error t Stat P-value Lower 95% Upper 95% Obesity 33.807146 48.63021776 0.69519 0.50935 -81.185046 148.79934 Alcohol -2.649E-05 0.00012236 -0.21647 0.83479 -0.0003158 0.0002628 Sleep -0.0394214 0.277870747 -0.14187 0.89118 -0.6964813 0.6176385 Physicians 0.1301715 0.201527667 0.64592 0.53892 -0.3463658 0.6067087 Fast Food 0.3645159 0.297074354 1.22702 0.25948 -0.3379533 1.0669851 No Exercise 2.8406219 4.037426425 0.70357 0.50442 -6.7063745 12.387618 Anti-Depress -4.468E-06 4.84873E-05 -0.09216 0.92915 -0.0001191 0.0001102 Beverages 4.688E-06 8.27112E-06 0.56685 0.58852 -1.487E-05 2.425E-05 After conducting a multi-regression analysis of all the factors comparatively to the obesity trends, the results matched extremely similarly to the individual line regression tests. As a result of the linear regression tests, three of the factors proved to be the strongest factors of obesity trends in the United States were: fast food chain availability, low exercise rate, and physician availability. Also in a similar sense once again the T-Stat and P-value for these three factors were closest to our cut-off numbers when the multi-regression analysis was done. Fast food consumption stood out as the strongest factor in both p and t values. Sleep, alcohol, and the anti-depressant medication were not significant factors in obesity trends, which is similar to our linear regression tests.