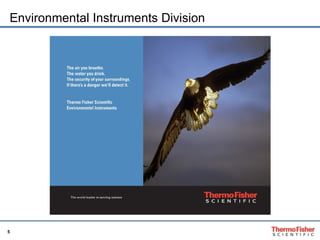
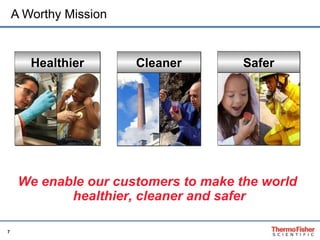
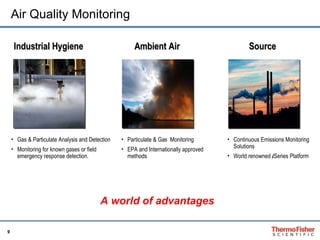
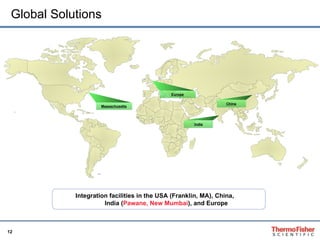
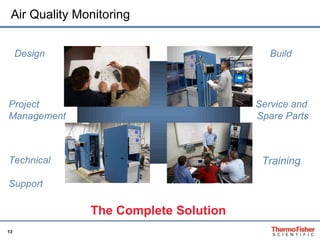
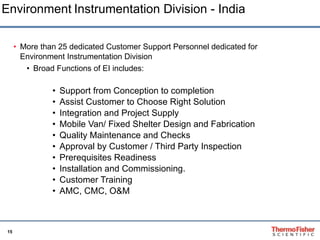
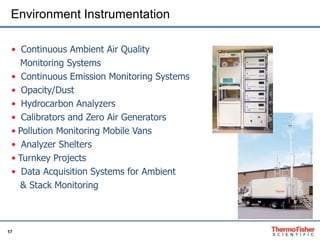
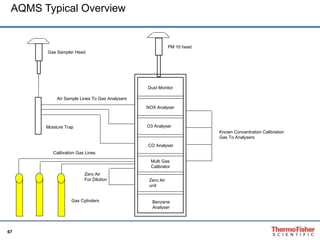
The Clear Industry Leader The world leader in serving science We are the leading provider of analytical instruments,  equipment, reagents and consumables, software and services  for research, analysis, discovery and diagnostics.
Thermo Fisher Scientific Snapshot $10 billion in revenues 30,000 employees in 38 countries 350,000 customers 150 countries served Fortune 300 company $20+ billion market cap (NYSE:TMO) Scale Two premier brands Brand Equity Complete portfolio World-class technologies Commercial and service strength Capabilities
Environmental Instruments Division Vision Vision We are committed to being the global leader in environmental monitoring applications where our market knowledge, customer intimacy, application expertise, and instrument technology help our customers make the world healthier, cleaner, and safer. Key Global Trends Demographics Developing World Industrialization Power Generation Requirements Security Concerns
Environmental Instruments Division
Environmental Instruments Division Vision We are committed to being the global leader in environmental monitoring applications where our market knowledge, customer intimacy, application expertise, and instrument technology help our customers make the world healthier, cleaner, and safer. Key Global Trends Demographics Rapid Industrialization Environmental Awareness  Power Generation Requirements Security Concerns
A Worthy Mission We enable our customers to make the world  healthier, cleaner and safer Healthier Cleaner Safer
The Thermo Scientific Difference Manufacturer of system  components Global Service Organization Nearly 40 years of  servicing the Environmental Monitoring Industry  In-house R&D and  Engineering Groups Five  Global Integration Centers A solid legacy of innovative technology and proven methods
Air Quality Monitoring  A world of advantages  Industrial Hygiene   Ambient Air   Source Continuous Emissions Monitoring Solutions  World renowned  i Series Platform  Particulate & Gas  Monitoring  EPA and Internationally approved methods  Gas & Particulate Analysis and Detection  Monitoring for known gases or field emergency response detection.
What is “Air Quality Instruments”? 1 of 3 Business Units In Environmental Instruments Division (EID) Headquartered In Franklin, Massachusetts ~$150 Million Annual Revenue 500 Employees 4 Manufacturing Sites 100+ Air Monitoring Products Global Sales - 100+ Distributors; 30+ Countries The World Leader in Air Monitoring Instrumentation
We are committed to being the global leader in environmental monitoring applications where our market knowledge, instrument technology and field experience continues to help customers succeed in protecting people and the environment.
Global Solutions  Integration facilities in the USA (Franklin, MA), China,  India ( Pawane, New Mumbai ), and Europe India China Massachusetts Europe
Your Integrated Solutions Provider Service and  Spare Parts Design Build Project  Management Technical  Support Training The Complete Solution  Air Quality Monitoring
Finding out if the Air we Breathe is Clean   The six criteria pollutants addressed in the NAAQS are  Carbon Monoxide, Nitrogen Dioxide, Lead, Ozone (or smog), Particulate  Matter, and Sulfur Dioxide.  If the levels of these pollutants are higher than what is considered  acceptable by EPA, then the area in which the level is too high is  called a  no attainment  area.  The Air Pollution Monitoring program monitors all of the six criteria pollutants. Measurements are taken to assess areas where there may be a problem, and to monitor areas that already have problems. The goal of this program is to control areas where problems exist and to try to keep other areas from becoming problem air pollution areas.  Air Monitoring systems
More than 25 dedicated Customer Support Personnel dedicated for Environment Instrumentation Division  Broad Functions of EI includes: Support from Conception to completion Assist Customer to Choose Right Solution Integration and Project Supply Mobile Van/ Fixed Shelter Design and Fabrication Quality Maintenance and Checks Approval by Customer / Third Party Inspection Prerequisites Readiness Installation and Commissioning. Customer Training AMC, CMC, O&M Environment   Instrumentation Division - India
 
Continuous Ambient Air Quality Monitoring Systems Continuous Emission Monitoring Systems Opacity/Dust Hydrocarbon Analyzers Calibrators and Zero Air Generators Pollution Monitoring Mobile Vans Analyzer Shelters  Turnkey Projects  Data Acquisition Systems for Ambient  & Stack Monitoring Environment   Instrumentation
System Integration Capabilities
India Integration Facility Shop Floor with Office Area 12000 Sq Ft wide Area for project  department to design, integrate,  test Ambient Air Quality as well as  Stack emission monitoring systems  Equipped with all the amenities for  uninterrupted round the clock  work  Easy Material handling without any  damages using overhead crane Factory trained service personnel to  provide quality timely services to  customers  Storage of spares parts for  betterment of uptime.
Add picture of facility
ISO 9001-2008 Certification
Pl add picture of shelter
CIMFR Certified HVAC
CIMFR Certificate
AAQMS-IITM (COMMON WEALTH GAME)
AAQMS- MARUTI – AC RACK
Pl add picture of sample handling system
Continuous Ambient Air Quality Monitoring System
Beijing Olympic 2008
System Configuration Thermo Fisher scientific, China has supplied Ambient Air Quality Monitoring Stations for Beijing Olympic, 2008 System consists of  48i Co analyser – 10 sets 49i O3 Analyser – 25 sets 43i SO2 Analyser – 10 sets  42i NOX Analyser – 10 sets 1400AB Dust Analyser – 25 sets 1405DF Dust Analyser – 1 set MAAP 5012 Black Carbon Analyser – 01 set FRM 2000 Sampler – 03 sets GUV-15HBL-1 Hi Volume sampler – 02 sets 146i Multi Gas calibrator – 10 sets  With data loggers, sample conditioning system and accessories
SAFAR System For Commonwealth Games  India 2010
System of Air Pollution Forecasting and Research-SAFAR-2010 O3 CO NOX SPM BENZEN CARBON BLACK ANALYSERS FOR THE SYSTEM 10 Continuous Ambient Air Quality Monitoring System installed in Delhi. Data will be available in Pune through communication system
Analysers And –Measuring Technique Enview Windows Based Data Logger 146i Mass flow Controller Dilution Based Calibrator AE31  Optical transmission absorption BLACK CARBON A73022  Gas Chromatograph With PID Detector BENZENE FH62C14 Beta Attenuation SPM 48i Gas Filter Correlation CO 49i UV Absorption O 3 42 i Chemiluminescence Nox Model Technique Pollutant
Continuous Emission Monitoring System
Continuous Emission Monitoring System Sample Acquisition Techniques Dilution-Extractive Systems In-Stack Out-of-Stack Extractive Systems Cold/Dry  Hot/Wet
Typical Dilution Probe Emission Monitoring System
Overview of CEMS Technologies & Equipment Dilution Probe Sampling System Coarse Filter Critical Orifice Dry Air Line Cal Gas Line Diluted Sample Out Venturi Nozzle Quartz Wool Fine Filter Vacuum Reference Line                                               
Dilution Air Clean-Up System “Very Important Component”
Example of 100:1 Dilution Probe Operation
Bill Of Material of Dilution System SO2, NOX, CO, CO2 Analyzers Dilution probe Dilution Control Unit / Controller Umbilical Cord Zero Air Unit Rack Shelter Optional: Stack Multiplexing unit
Overview of CEMS Technologies Non-Dilution Extractive System
NDIR Multi-gas Analyzer Design Proposal Filter Wheel NDIR with 12 Band-Pass Filters Pyroelectric Detector 48 Series Multi-Pass Bench 48 Series IR Source i-Series Platform and Electronics
NDIR Multi-gas Analyzer Design Advantages All 5 Combustion By-Products Measured With One Technology Mechanically Less Complex Than Competing Designs Options/Features Are Software Selected At Factory Common Components With Existing Product For Improved Reliability and a Proven Track Record  Platform Could Be Utilized In Future Products (Process Systems & IH)
NDIR Multi-gas Analyzer Example of a Typical Single Beam NDIR with Mass Flow Sensor
NDIR Multi-gas Analyzer Design Proposal Reference (2X) H 2 O CO 2 CO NO NO 2 SO 2  (high) SO 2  (low) N 2 0 CH 4 C 2 H 6  (NMCH)
NDIR Multi-gas Analyzer New in 2008! Model 60 i
Gas Analyzers
i Series Platform – Design Overview-Thermo Analyzers
i Series Platform – Common Electronics and Modular Measurement System Common Electronics Section Measurement System Module
i Series Common Electronics – Rear View RS485 Expansion Connector (External Converter Boxes) RS232/485 Serial Ports Ethernet Port Digital Output (Relay) Port Common I/O Connector Expansion I/O Connector Measurement System Connections AC Power Connector and Fuse
i Series Common Electronics - User Interface Title Bar Shows what’s being displayed Measurements 1-5 lines Measurement descriptor Measurement value Units Status bar Measurement status Time Alarm status Menu data Menus, data display, entry Run Menu
i Series Common Electronics - User Interface Soft key prompts
NO-NO2-NOX Chemiluminescence Reduction of NO 2  to NO 3 NO 2  + Md  3NO  + MdO 3 A molybdenum catalyst, heated to ~325C, is used to Convert NO 2  to NO PUMP CHAMBER DRY AIR FILTER TEFLON PARTICULATE FILTER SAMPLE CAPILLARY C NO (NO MODE) MODE SOLENOID NO 2  - NO CONVERTER (NO X  MODE) PRESSURE TRANSDUCER FLOW SENSOR NC ELECTRONICS REACTION CHAMBER PMT OZONATOR CAPILLARY FLOW SENSOR FILTER
Carbon Monoxide Gas  Filter Correlation Detector & Pre-Amp Assembly Pressure Sensor Flow Sensor Chopper  Motor Correlation Wheel Chopper Band-Pass Filter IR Source Multi-Pass Sample Cell Sample Pump Sample In
Model 48i Flow Schematic
Model 49i Flow Schematic
Light Scattering : Excellent time resolution; Limited by Refractive Index and Aerosol Distribution ( particle size ) Tapered Element Oscillating Microbalance:  Strong Market Presence;  Beta (Electron) Attenuation : Widely Accepted, Minimal Performance Issues, Versatile;  Education on   -source and Market Competition w/TEOM Aerosol Monitoring Continuous Methods Thermo the Only company  which can provide all the three technologies
SPM Analysers For Safar Project OPTIONS On    Attenuation Principle Model FH62C14 Option No.1-  We under stand that you require continuous measurement of PM10 & PM2.5, if you require only 10 analyser with PM10 & PM2.5 inlet then cost of 10 SPM analysers to be deducted. i.e.We can provide single SPM analyser with PM10 & PM2.5 manually interchangeable inlets.  Option No.2- In case you require continuous measurement of PM10 & PM2.5 then you can go for separate SPM analyser for PM 10 & PM2.5. On  TEOM Principle Model 1405 DF Option No.3- We are offering USEPA Approved SPM Analyser for simulations & continuous measurement of PM10 & PM2.5 on TEOM technology. We are offering Model 1405 DF at  the cost two  FH62C14 SPM analyser for this prestigious Project. The cost of this single analyser is three times of Model FH62C14
SPM ANALYSERS FOR SAFAR PROJECT OPTIONS On    Attenuation Principle Model FH62C14 Option No.1-  If PM10 & PM2.5 Simulations measurement is required then two separate instruments to be installed at each AAQM Station. The same has been considered in the offered system configuration,  Option No.2-  If Simulations measurement of PM10 & PM2.5 is not envisaged then the cost of one instrument to be deducted and manual change over of Inlet head has to be considered.  On  TEOM Principle Model 1405 DF Option No.3-  We are offering USEPA Approved SPM Analyser for simultaneous & continuous measurement of PM10 & PM2.5 with TEOM technology with FDMS. One instrument can substitute two numbers of Model FH62C14. As this is the prestigious project we would like to offer Model 1405DF, patented instrument at the same price (two FH62C14)
Online PM 10 / PM 2.5 / PM 1 / TSP Monitor   Attenuation Series FH 62 C14
Constant flow of aerosol is metered and sampled onto a filter stain area. The continuous detection of Beta Attenuation is proportional to increased mass. Every 12-24 hrs a new filter area is zeroed and introduced. Series FH 62 C14 Principle of Operation
Series FH 62 C14  Principle of Operation
Model 1405-DF Technology TEOM Dichotomous Flow with FDMS Dried Sample Stream Accounts for Volatiles Simultaneous PM-10, PM-Coarse, PM-2.5 Humid locations, Regulatory Measurements, Multiple Measurements
TEOM Mass Transducer Tapered element oscillates at its natural frequency Particulate matter collects on filter continuously Frequency decreases with accumulation of mass Direct  relationship between mass and frequency change The fundamental approach is similar to that of a laboratory microbalance in that the mass detected by the sensor is the result of the measurement of a change in a parameter (in this case frequency) that is directly coupled via a physical law (or from first principles).  Tapered Element  Eliminates  calibration uncertainty  with respect to mass by only using a sensor based upon a first-principle physical law - a direct measurement of mass.
TEOM 1405DF Differentiators over our competition Direct mass measurement Short time resolution (10 min. with base model, 1 hour with FDMS) Accounts for Volatiles EPA preferred method for PM2.5 for “real” technology Dichots provide multiple measurements Unique Features of the 1405 One box Linux based software Touch Screen with menus Wizards ePort Service Database
Multi Gas Calibrator Model 146i
AQMS Typical Overview  Dust Monitor NOX Analyser O3 Analyser CO Analyser Multi Gas  Calibrator Zero Air  unit PM 10 head Gas Sampler Head Moisture Trap Air Sample Lines To Gas Analysers Gas Cylinders Zero Air  For Dilution Calibration Gas Lines Known Concentration Calibration  Gas To Analysers Benzene Analyser
Design & Engineering Overview
Engineering & Works: TTC Pawane-Mumbai-India. Current Capacity: Engineering , Integration & Testing of 10 AAQMS & 4 CEMS (Shelter ) at one time. Works : Area: 12000 sq ft. Laboratory: Area: 300 sq ft. Finished Good area: 400 sq ft. Power : Un-Interrupted Power Supply with DG back-up of 160kV. Loading: Over Head Crane :10T Indian Operation
Work Flow Sheet ENQUIRY CUSTOMER BRANCH / MARKETING OFFER BRANCH / MARKETING CUSTOMER ORDER  ACKNOLEDGEMENT BRANCH / MARKETING CUSTOMER PO / PR CUSTOMER BRANCH MARKETING Preparation of Job Transmittal BRANCH / MARKETING SYSTEM & DESIGN RECIEPT OF JT BRANCH/MARKETTING SYSTEM & DESIGN TQ. ( IF ANY ) SYSTEM & DESIGN BRANCH/MARKETTING REVIEW OF JT  ( TECH. ) SYSTEM & DESIGN SYSTEM & DESIGN REPLY OF TQ. MARKETING  SYSTEM & DESIGN INTEGRATION & MFG. OF SYSTEM SYSTEM & DESIGN  PRODUCTION INTERNAL  INSPECTION SYSTEM & DESIGN Q A ATTEND. OF  PUNCH POINT PRODUCTION SYSTEM & DESIGN PUNCH POINT Q A SYSTEM & DESIGN COMPLIANCE  REPORT PRODUCTION Q A FAT SYSTEM & DESIGN & QA CUSTOMER TPI PACKING  FORWARDING STORE TRANSPORTER DISP. CLEARANCE CUSTOMER PRODUCTION  / SYSTEM & DESIGN PREP. OF DRAWNG QAP & SUBMIT TO  CUSTOMER SYSTEM & DESIGN CUSTOMER CONSULTANT PREP. & REL. OF BILL  OF MATRL. SYSTEM & DESIGN PURCHASE & STORE COMMENT FROM CUST. / CONSULT. CUSTOMER/CONSULTANT SYSTEM & DESIGN ENQUIRY TO VENDOR SYSTEM & DESIGN VENDOR REV. SUBMISSION OF DRG. / QAP SYSTEM & DESIGN CUSTOMER CONSULTANT OFFER FROM  VENDOR VENDOR SYSTEM & DESIGN APPROVED OF DRG. / QAP SYSTEM & DESIGN CUSTOMER / CONSULTANT EVALUATION OF ORDER SYSTEM & DESIGN PURCHASE PREPARE DETAIL  DRG. SYSTEM & DESIGN PRODUCTION RELEASE OF  PO PURCHASE  VENDOR REC. OF  MATERIAL VENDOR STORE INSPECTION OF  MATERIAL Q A STORE ACCEPTED STORE STORE ISSUE OF MATERIAL SYSTEM & DESIGN PRODUCTION REJECTION  ( IF ANY ) PURCHASE & STORE VENDOR A START ‘A’ B B C C C ISSUING DEPARTMENT RECEIVING DEPARTMENT ACTIVITY FLOW LINK LEGENDS - FAT CALL SYSTEM & DESIGN CUST. / TPI
OUR FACILITY IN BRIEF Team of Franklin U S trained Engineers & Technicians capable of testing calibration of 3 System / day Q A      Instrument Air at 4.6 kg/m2, Dust & Oil free at shop floor & Lab Instrument Air   Diesel Generator Backup 160 kVA, 415 V AC, 3Ph + N from MSEB   Normal 160 kVA, 415 V AC, 3Ph + N from MSEB Power Supply   Material Handling System - Hydraulic forklift & Trolly for material movement Over Head Crane - 10 Ton. Lab ( for testing ) - 1200 Sq. Ft. Store - 1200 Sq. Ft.   Floor Area - 16 meter ( L ) x 7 meter ( W ) Work Shop   3. AAQMS System for M/S NTPC through M/S Yokogawa 2. AAQMS System for M/S Tamilnadu Agricultural University. 1. AAQMS System for M/S Sunflag Nagpur. Present Assignments:   Team of Experience manager with technician like Mechanical fitter, Tube fitter, Electrician, Calibrator  technician etc. System Integration     Team of Experience Technical Team worked for previous AAQMS station for NTPC Design & Engineering
 
Project Schedule for SAFAR
Networking & Communication
Smart & Simple Numerical Data Collection & Control Communication via RS232C/USB/TCPIP to the smart analyzers (multi-drop available). Logging up to 48 bits of Digital Monitor Status information per each channel. Logging up to 32 diagnostic values per each channel. Enhanced QA tools by Digital Monitor Status checking. Communications bypass feature for direct analyzer connection from  remote locations. Support Numerical data collection from the most typical AQM/CEM Analyzers and Meteorological Sensors available in the market. Control Smart Calibrator units via RS232 port
Calibration Sequence Configuration
Visualisation, Real Time Charting & Reporting Display of current measurement in Volt’s  or Real Value and dimensional unit’s (ppb/ppm/µg/m3/mg/m3 or any other like deg, °C, m/sec etc…) Visualization of data (graphical and tabular) with zoom function facilities. Local Reporter program that create daily, weekly, monthly, annual or any From-To period with selectable time-based averages.
Reports & Graphs
Reports & Graphs
Multi Station Communication TCP/IP, Cellular,  Radio, Leased Line  Communication  Environment Central Station with Comm H/W AQI Site AQI Site AQI Site AQI Site
Web Edition
Web Edition
Web Edition
Internet WEB Site System Prepared for National & Regional AQM Networks Envista WEB is designed to allow you to publish your environmental data which has been captured using Envista ARM environmental data management software onto the World Wide Web. Designed especially with the needs of public bodies and other agencies with a responsibility for environmental monitoring and reporting, Envista WEB provides a simple route to publication either to concerned citizens or within your organization through an Intranet.
 
Maps Data Data Presentations-Enview Software
Multi-pollutant Trend Chart Unhealthy for Sensitive Groups Unhealthy Moderate Ozone PM 2.5
Averaging Times Instantaneous One-Hour Average Four-Hour Average
Commercial DAHS Functions Report Generation Emission Data Recording Plant Computer Interface Calibration Control and Recording Emission Monitor Control Emission Data Display DAHS Functions
GSM modem PLC GSM modem SCADA RS232 CABLE RS232  CABLE SIM CARD-Must be data/fax connectivity  enabled For Communication using GSM modem following requirements are must. PLC with dial up option SCADA supporting for dial up option. GSM MODEM SET UP FOR DAIL UP CONNECTION The Dial up connection is established between the PLC and SCADA when SCADA dials to the remote PLC. It establishes 9600  ,8,N,1 wireless link between  the SCADA and PLC
Dial  up  connection  can  be  created  between  the  SCADA  and  PC  using  GSM  modems with RS232 interface.  For this we require GSM radio with RS232 interface and  SIM  card  with  Data/Fax  connectivity.  For  this  system,  PC  will  be  connected  with one GSM modem with data activated SIM card and other end SCADA with GSM  modem  consisting  of  data  activated  SIM  card.  SACDA  with  Dial  up  support  facility will  dial  the  remote  PC  GSM  modem  (support  Dial  up  facility)  and  will  get connected at a speed of 9600 bits per second.  Thus PC and SCADA will be online after being connected using Dial up facility.  They can operate on 9600 bps 8N1 data interface speed between them.  Every  Dial  up  and  data  transfer  will  generate  a  bill,  subject  to  the  SIM  card inserted inside the GSM modems.  Working philosophy in Brief
RTU MASTER LOCATION SCADA UNIT  AT DELHI NETWORK  ARCHITECHTURE-DIAL UP SYSTEM GSM modem RS-232 LOCATION 1 LOCATION 10 RS-232 SCADA GSM  antenna with  extension cable DELHI AAQMS NO.1 DELHI AAQMS NO.10 GSM  antenna with  extension cable RTU GSM modem RS-232 GSM antenna with  extension cable GSM modem Working philosophy SCADA will dial from Master location to remote locations one after another and collect the data of remote RTU one after another. Thus remote RTU data can be collected at master station using GSM technology
COMMUNICATION AQM/CEM Central Data  Station ST 10 EnviDAS  Software LCD Hi definition  Display RS232/RS 485 /GSM  Modem ST 4 ST 1 ST 3 ST 2 ST 5 LCD Hi definition  Display Delhi Pune
Operation & Maintenance Contract Activities
Thermo – AQI, India Service Operations Overview
Service Strengths Dedicated Manpower  Strong working experience  Market Knowledge of Products and Apllications Well Trained Engineers Expert Product Specialists Geographic Reach Team of Service engineers on regional basis. Market Credibility Exclusive Technology Product Quality Proven Field Performance  Support from US Office Dedicated Product Specialists for remote tech support
Service Organization  3 Service Engineers 2 Open Positions 1 Service Engineer 1 Technician 1 Service Engineer 1 Technician 2 Sales/Service Engineers 1 Service Manager 1 Service Engineer 1 Service Engineer 1 Service Engineer 1 Technician Open
Major Customers West MPCB , HPCL,  BPCL ,  TATA Power , RCF,  NMMC , Reliance Energy, MCGM,  NEERI , IIT,  ONGC , IITM,  IMD , DFPCL, RCF-Thal Central IOCL ,  PRL , IPCL, GSFC, ONGC (Hz, Ank, Bar),  ESSAR , Reliance Petro, KRIBHCO, GSEG,  NTPC,  GPCB South CPCL,  KSPCB , IIT, CPT, NFC, MALCO, JSW, VSP,   NTPC, BPCL,  EPL, GMR, NFCL,  VSSC East WBPCB,  IOCL (H), IOCL(D), TISCO, SAIL,  L&T , RSP, Nalco,  Balco ,  NTPC,  CMRI North CPCB, NTPC, IOCL (Panipat, Mathura), GAIL , CRRI, DU, IOCL (F), RRVUNL,  NPL ,  NEERI, IIT Customers marked in red are Thermo Users

Refinery meet

  • 1.
  • 2.
    The Clear IndustryLeader The world leader in serving science We are the leading provider of analytical instruments, equipment, reagents and consumables, software and services for research, analysis, discovery and diagnostics.
  • 3.
    Thermo Fisher ScientificSnapshot $10 billion in revenues 30,000 employees in 38 countries 350,000 customers 150 countries served Fortune 300 company $20+ billion market cap (NYSE:TMO) Scale Two premier brands Brand Equity Complete portfolio World-class technologies Commercial and service strength Capabilities
  • 4.
    Environmental Instruments DivisionVision Vision We are committed to being the global leader in environmental monitoring applications where our market knowledge, customer intimacy, application expertise, and instrument technology help our customers make the world healthier, cleaner, and safer. Key Global Trends Demographics Developing World Industrialization Power Generation Requirements Security Concerns
  • 5.
  • 6.
    Environmental Instruments DivisionVision We are committed to being the global leader in environmental monitoring applications where our market knowledge, customer intimacy, application expertise, and instrument technology help our customers make the world healthier, cleaner, and safer. Key Global Trends Demographics Rapid Industrialization Environmental Awareness Power Generation Requirements Security Concerns
  • 7.
    A Worthy MissionWe enable our customers to make the world healthier, cleaner and safer Healthier Cleaner Safer
  • 8.
    The Thermo ScientificDifference Manufacturer of system components Global Service Organization Nearly 40 years of servicing the Environmental Monitoring Industry In-house R&D and Engineering Groups Five Global Integration Centers A solid legacy of innovative technology and proven methods
  • 9.
    Air Quality Monitoring A world of advantages Industrial Hygiene Ambient Air Source Continuous Emissions Monitoring Solutions World renowned i Series Platform Particulate & Gas Monitoring EPA and Internationally approved methods Gas & Particulate Analysis and Detection Monitoring for known gases or field emergency response detection.
  • 10.
    What is “AirQuality Instruments”? 1 of 3 Business Units In Environmental Instruments Division (EID) Headquartered In Franklin, Massachusetts ~$150 Million Annual Revenue 500 Employees 4 Manufacturing Sites 100+ Air Monitoring Products Global Sales - 100+ Distributors; 30+ Countries The World Leader in Air Monitoring Instrumentation
  • 11.
    We are committedto being the global leader in environmental monitoring applications where our market knowledge, instrument technology and field experience continues to help customers succeed in protecting people and the environment.
  • 12.
    Global Solutions Integration facilities in the USA (Franklin, MA), China, India ( Pawane, New Mumbai ), and Europe India China Massachusetts Europe
  • 13.
    Your Integrated SolutionsProvider Service and Spare Parts Design Build Project Management Technical Support Training The Complete Solution Air Quality Monitoring
  • 14.
    Finding out ifthe Air we Breathe is Clean The six criteria pollutants addressed in the NAAQS are Carbon Monoxide, Nitrogen Dioxide, Lead, Ozone (or smog), Particulate Matter, and Sulfur Dioxide. If the levels of these pollutants are higher than what is considered acceptable by EPA, then the area in which the level is too high is called a no attainment area. The Air Pollution Monitoring program monitors all of the six criteria pollutants. Measurements are taken to assess areas where there may be a problem, and to monitor areas that already have problems. The goal of this program is to control areas where problems exist and to try to keep other areas from becoming problem air pollution areas. Air Monitoring systems
  • 15.
    More than 25dedicated Customer Support Personnel dedicated for Environment Instrumentation Division Broad Functions of EI includes: Support from Conception to completion Assist Customer to Choose Right Solution Integration and Project Supply Mobile Van/ Fixed Shelter Design and Fabrication Quality Maintenance and Checks Approval by Customer / Third Party Inspection Prerequisites Readiness Installation and Commissioning. Customer Training AMC, CMC, O&M Environment Instrumentation Division - India
  • 16.
  • 17.
    Continuous Ambient AirQuality Monitoring Systems Continuous Emission Monitoring Systems Opacity/Dust Hydrocarbon Analyzers Calibrators and Zero Air Generators Pollution Monitoring Mobile Vans Analyzer Shelters Turnkey Projects Data Acquisition Systems for Ambient & Stack Monitoring Environment Instrumentation
  • 18.
  • 19.
    India Integration FacilityShop Floor with Office Area 12000 Sq Ft wide Area for project department to design, integrate, test Ambient Air Quality as well as Stack emission monitoring systems Equipped with all the amenities for uninterrupted round the clock work Easy Material handling without any damages using overhead crane Factory trained service personnel to provide quality timely services to customers Storage of spares parts for betterment of uptime.
  • 20.
  • 21.
  • 22.
    Pl add pictureof shelter
  • 23.
  • 24.
  • 25.
  • 26.
  • 27.
    Pl add pictureof sample handling system
  • 28.
    Continuous Ambient AirQuality Monitoring System
  • 29.
  • 30.
    System Configuration ThermoFisher scientific, China has supplied Ambient Air Quality Monitoring Stations for Beijing Olympic, 2008 System consists of 48i Co analyser – 10 sets 49i O3 Analyser – 25 sets 43i SO2 Analyser – 10 sets 42i NOX Analyser – 10 sets 1400AB Dust Analyser – 25 sets 1405DF Dust Analyser – 1 set MAAP 5012 Black Carbon Analyser – 01 set FRM 2000 Sampler – 03 sets GUV-15HBL-1 Hi Volume sampler – 02 sets 146i Multi Gas calibrator – 10 sets With data loggers, sample conditioning system and accessories
  • 31.
    SAFAR System ForCommonwealth Games India 2010
  • 32.
    System of AirPollution Forecasting and Research-SAFAR-2010 O3 CO NOX SPM BENZEN CARBON BLACK ANALYSERS FOR THE SYSTEM 10 Continuous Ambient Air Quality Monitoring System installed in Delhi. Data will be available in Pune through communication system
  • 33.
    Analysers And –MeasuringTechnique Enview Windows Based Data Logger 146i Mass flow Controller Dilution Based Calibrator AE31 Optical transmission absorption BLACK CARBON A73022 Gas Chromatograph With PID Detector BENZENE FH62C14 Beta Attenuation SPM 48i Gas Filter Correlation CO 49i UV Absorption O 3 42 i Chemiluminescence Nox Model Technique Pollutant
  • 34.
  • 35.
    Continuous Emission MonitoringSystem Sample Acquisition Techniques Dilution-Extractive Systems In-Stack Out-of-Stack Extractive Systems Cold/Dry Hot/Wet
  • 36.
    Typical Dilution ProbeEmission Monitoring System
  • 37.
    Overview of CEMSTechnologies & Equipment Dilution Probe Sampling System Coarse Filter Critical Orifice Dry Air Line Cal Gas Line Diluted Sample Out Venturi Nozzle Quartz Wool Fine Filter Vacuum Reference Line                                               
  • 38.
    Dilution Air Clean-UpSystem “Very Important Component”
  • 39.
    Example of 100:1Dilution Probe Operation
  • 40.
    Bill Of Materialof Dilution System SO2, NOX, CO, CO2 Analyzers Dilution probe Dilution Control Unit / Controller Umbilical Cord Zero Air Unit Rack Shelter Optional: Stack Multiplexing unit
  • 41.
    Overview of CEMSTechnologies Non-Dilution Extractive System
  • 42.
    NDIR Multi-gas AnalyzerDesign Proposal Filter Wheel NDIR with 12 Band-Pass Filters Pyroelectric Detector 48 Series Multi-Pass Bench 48 Series IR Source i-Series Platform and Electronics
  • 43.
    NDIR Multi-gas AnalyzerDesign Advantages All 5 Combustion By-Products Measured With One Technology Mechanically Less Complex Than Competing Designs Options/Features Are Software Selected At Factory Common Components With Existing Product For Improved Reliability and a Proven Track Record Platform Could Be Utilized In Future Products (Process Systems & IH)
  • 44.
    NDIR Multi-gas AnalyzerExample of a Typical Single Beam NDIR with Mass Flow Sensor
  • 45.
    NDIR Multi-gas AnalyzerDesign Proposal Reference (2X) H 2 O CO 2 CO NO NO 2 SO 2 (high) SO 2 (low) N 2 0 CH 4 C 2 H 6 (NMCH)
  • 46.
    NDIR Multi-gas AnalyzerNew in 2008! Model 60 i
  • 47.
  • 48.
    i Series Platform– Design Overview-Thermo Analyzers
  • 49.
    i Series Platform– Common Electronics and Modular Measurement System Common Electronics Section Measurement System Module
  • 50.
    i Series CommonElectronics – Rear View RS485 Expansion Connector (External Converter Boxes) RS232/485 Serial Ports Ethernet Port Digital Output (Relay) Port Common I/O Connector Expansion I/O Connector Measurement System Connections AC Power Connector and Fuse
  • 51.
    i Series CommonElectronics - User Interface Title Bar Shows what’s being displayed Measurements 1-5 lines Measurement descriptor Measurement value Units Status bar Measurement status Time Alarm status Menu data Menus, data display, entry Run Menu
  • 52.
    i Series CommonElectronics - User Interface Soft key prompts
  • 53.
    NO-NO2-NOX Chemiluminescence Reductionof NO 2 to NO 3 NO 2 + Md 3NO + MdO 3 A molybdenum catalyst, heated to ~325C, is used to Convert NO 2 to NO PUMP CHAMBER DRY AIR FILTER TEFLON PARTICULATE FILTER SAMPLE CAPILLARY C NO (NO MODE) MODE SOLENOID NO 2 - NO CONVERTER (NO X MODE) PRESSURE TRANSDUCER FLOW SENSOR NC ELECTRONICS REACTION CHAMBER PMT OZONATOR CAPILLARY FLOW SENSOR FILTER
  • 54.
    Carbon Monoxide Gas Filter Correlation Detector & Pre-Amp Assembly Pressure Sensor Flow Sensor Chopper Motor Correlation Wheel Chopper Band-Pass Filter IR Source Multi-Pass Sample Cell Sample Pump Sample In
  • 55.
    Model 48i FlowSchematic
  • 56.
    Model 49i FlowSchematic
  • 57.
    Light Scattering :Excellent time resolution; Limited by Refractive Index and Aerosol Distribution ( particle size ) Tapered Element Oscillating Microbalance: Strong Market Presence; Beta (Electron) Attenuation : Widely Accepted, Minimal Performance Issues, Versatile; Education on  -source and Market Competition w/TEOM Aerosol Monitoring Continuous Methods Thermo the Only company which can provide all the three technologies
  • 58.
    SPM Analysers ForSafar Project OPTIONS On  Attenuation Principle Model FH62C14 Option No.1- We under stand that you require continuous measurement of PM10 & PM2.5, if you require only 10 analyser with PM10 & PM2.5 inlet then cost of 10 SPM analysers to be deducted. i.e.We can provide single SPM analyser with PM10 & PM2.5 manually interchangeable inlets. Option No.2- In case you require continuous measurement of PM10 & PM2.5 then you can go for separate SPM analyser for PM 10 & PM2.5. On TEOM Principle Model 1405 DF Option No.3- We are offering USEPA Approved SPM Analyser for simulations & continuous measurement of PM10 & PM2.5 on TEOM technology. We are offering Model 1405 DF at the cost two FH62C14 SPM analyser for this prestigious Project. The cost of this single analyser is three times of Model FH62C14
  • 59.
    SPM ANALYSERS FORSAFAR PROJECT OPTIONS On  Attenuation Principle Model FH62C14 Option No.1- If PM10 & PM2.5 Simulations measurement is required then two separate instruments to be installed at each AAQM Station. The same has been considered in the offered system configuration, Option No.2- If Simulations measurement of PM10 & PM2.5 is not envisaged then the cost of one instrument to be deducted and manual change over of Inlet head has to be considered. On TEOM Principle Model 1405 DF Option No.3- We are offering USEPA Approved SPM Analyser for simultaneous & continuous measurement of PM10 & PM2.5 with TEOM technology with FDMS. One instrument can substitute two numbers of Model FH62C14. As this is the prestigious project we would like to offer Model 1405DF, patented instrument at the same price (two FH62C14)
  • 60.
    Online PM 10/ PM 2.5 / PM 1 / TSP Monitor  Attenuation Series FH 62 C14
  • 61.
    Constant flow ofaerosol is metered and sampled onto a filter stain area. The continuous detection of Beta Attenuation is proportional to increased mass. Every 12-24 hrs a new filter area is zeroed and introduced. Series FH 62 C14 Principle of Operation
  • 62.
    Series FH 62C14 Principle of Operation
  • 63.
    Model 1405-DF TechnologyTEOM Dichotomous Flow with FDMS Dried Sample Stream Accounts for Volatiles Simultaneous PM-10, PM-Coarse, PM-2.5 Humid locations, Regulatory Measurements, Multiple Measurements
  • 64.
    TEOM Mass TransducerTapered element oscillates at its natural frequency Particulate matter collects on filter continuously Frequency decreases with accumulation of mass Direct relationship between mass and frequency change The fundamental approach is similar to that of a laboratory microbalance in that the mass detected by the sensor is the result of the measurement of a change in a parameter (in this case frequency) that is directly coupled via a physical law (or from first principles). Tapered Element Eliminates calibration uncertainty with respect to mass by only using a sensor based upon a first-principle physical law - a direct measurement of mass.
  • 65.
    TEOM 1405DF Differentiatorsover our competition Direct mass measurement Short time resolution (10 min. with base model, 1 hour with FDMS) Accounts for Volatiles EPA preferred method for PM2.5 for “real” technology Dichots provide multiple measurements Unique Features of the 1405 One box Linux based software Touch Screen with menus Wizards ePort Service Database
  • 66.
  • 67.
    AQMS Typical Overview Dust Monitor NOX Analyser O3 Analyser CO Analyser Multi Gas Calibrator Zero Air unit PM 10 head Gas Sampler Head Moisture Trap Air Sample Lines To Gas Analysers Gas Cylinders Zero Air For Dilution Calibration Gas Lines Known Concentration Calibration Gas To Analysers Benzene Analyser
  • 68.
  • 69.
    Engineering & Works:TTC Pawane-Mumbai-India. Current Capacity: Engineering , Integration & Testing of 10 AAQMS & 4 CEMS (Shelter ) at one time. Works : Area: 12000 sq ft. Laboratory: Area: 300 sq ft. Finished Good area: 400 sq ft. Power : Un-Interrupted Power Supply with DG back-up of 160kV. Loading: Over Head Crane :10T Indian Operation
  • 70.
    Work Flow SheetENQUIRY CUSTOMER BRANCH / MARKETING OFFER BRANCH / MARKETING CUSTOMER ORDER ACKNOLEDGEMENT BRANCH / MARKETING CUSTOMER PO / PR CUSTOMER BRANCH MARKETING Preparation of Job Transmittal BRANCH / MARKETING SYSTEM & DESIGN RECIEPT OF JT BRANCH/MARKETTING SYSTEM & DESIGN TQ. ( IF ANY ) SYSTEM & DESIGN BRANCH/MARKETTING REVIEW OF JT ( TECH. ) SYSTEM & DESIGN SYSTEM & DESIGN REPLY OF TQ. MARKETING SYSTEM & DESIGN INTEGRATION & MFG. OF SYSTEM SYSTEM & DESIGN PRODUCTION INTERNAL INSPECTION SYSTEM & DESIGN Q A ATTEND. OF PUNCH POINT PRODUCTION SYSTEM & DESIGN PUNCH POINT Q A SYSTEM & DESIGN COMPLIANCE REPORT PRODUCTION Q A FAT SYSTEM & DESIGN & QA CUSTOMER TPI PACKING FORWARDING STORE TRANSPORTER DISP. CLEARANCE CUSTOMER PRODUCTION / SYSTEM & DESIGN PREP. OF DRAWNG QAP & SUBMIT TO CUSTOMER SYSTEM & DESIGN CUSTOMER CONSULTANT PREP. & REL. OF BILL OF MATRL. SYSTEM & DESIGN PURCHASE & STORE COMMENT FROM CUST. / CONSULT. CUSTOMER/CONSULTANT SYSTEM & DESIGN ENQUIRY TO VENDOR SYSTEM & DESIGN VENDOR REV. SUBMISSION OF DRG. / QAP SYSTEM & DESIGN CUSTOMER CONSULTANT OFFER FROM VENDOR VENDOR SYSTEM & DESIGN APPROVED OF DRG. / QAP SYSTEM & DESIGN CUSTOMER / CONSULTANT EVALUATION OF ORDER SYSTEM & DESIGN PURCHASE PREPARE DETAIL DRG. SYSTEM & DESIGN PRODUCTION RELEASE OF PO PURCHASE VENDOR REC. OF MATERIAL VENDOR STORE INSPECTION OF MATERIAL Q A STORE ACCEPTED STORE STORE ISSUE OF MATERIAL SYSTEM & DESIGN PRODUCTION REJECTION ( IF ANY ) PURCHASE & STORE VENDOR A START ‘A’ B B C C C ISSUING DEPARTMENT RECEIVING DEPARTMENT ACTIVITY FLOW LINK LEGENDS - FAT CALL SYSTEM & DESIGN CUST. / TPI
  • 71.
    OUR FACILITY INBRIEF Team of Franklin U S trained Engineers & Technicians capable of testing calibration of 3 System / day Q A     Instrument Air at 4.6 kg/m2, Dust & Oil free at shop floor & Lab Instrument Air   Diesel Generator Backup 160 kVA, 415 V AC, 3Ph + N from MSEB   Normal 160 kVA, 415 V AC, 3Ph + N from MSEB Power Supply   Material Handling System - Hydraulic forklift & Trolly for material movement Over Head Crane - 10 Ton. Lab ( for testing ) - 1200 Sq. Ft. Store - 1200 Sq. Ft.   Floor Area - 16 meter ( L ) x 7 meter ( W ) Work Shop   3. AAQMS System for M/S NTPC through M/S Yokogawa 2. AAQMS System for M/S Tamilnadu Agricultural University. 1. AAQMS System for M/S Sunflag Nagpur. Present Assignments:   Team of Experience manager with technician like Mechanical fitter, Tube fitter, Electrician, Calibrator technician etc. System Integration     Team of Experience Technical Team worked for previous AAQMS station for NTPC Design & Engineering
  • 72.
  • 73.
  • 74.
  • 75.
    Smart & SimpleNumerical Data Collection & Control Communication via RS232C/USB/TCPIP to the smart analyzers (multi-drop available). Logging up to 48 bits of Digital Monitor Status information per each channel. Logging up to 32 diagnostic values per each channel. Enhanced QA tools by Digital Monitor Status checking. Communications bypass feature for direct analyzer connection from remote locations. Support Numerical data collection from the most typical AQM/CEM Analyzers and Meteorological Sensors available in the market. Control Smart Calibrator units via RS232 port
  • 76.
  • 77.
    Visualisation, Real TimeCharting & Reporting Display of current measurement in Volt’s or Real Value and dimensional unit’s (ppb/ppm/µg/m3/mg/m3 or any other like deg, °C, m/sec etc…) Visualization of data (graphical and tabular) with zoom function facilities. Local Reporter program that create daily, weekly, monthly, annual or any From-To period with selectable time-based averages.
  • 78.
  • 79.
  • 80.
    Multi Station CommunicationTCP/IP, Cellular, Radio, Leased Line Communication Environment Central Station with Comm H/W AQI Site AQI Site AQI Site AQI Site
  • 81.
  • 82.
  • 83.
  • 84.
    Internet WEB SiteSystem Prepared for National & Regional AQM Networks Envista WEB is designed to allow you to publish your environmental data which has been captured using Envista ARM environmental data management software onto the World Wide Web. Designed especially with the needs of public bodies and other agencies with a responsibility for environmental monitoring and reporting, Envista WEB provides a simple route to publication either to concerned citizens or within your organization through an Intranet.
  • 85.
  • 86.
    Maps Data DataPresentations-Enview Software
  • 87.
    Multi-pollutant Trend ChartUnhealthy for Sensitive Groups Unhealthy Moderate Ozone PM 2.5
  • 88.
    Averaging Times InstantaneousOne-Hour Average Four-Hour Average
  • 89.
    Commercial DAHS FunctionsReport Generation Emission Data Recording Plant Computer Interface Calibration Control and Recording Emission Monitor Control Emission Data Display DAHS Functions
  • 90.
    GSM modem PLCGSM modem SCADA RS232 CABLE RS232 CABLE SIM CARD-Must be data/fax connectivity enabled For Communication using GSM modem following requirements are must. PLC with dial up option SCADA supporting for dial up option. GSM MODEM SET UP FOR DAIL UP CONNECTION The Dial up connection is established between the PLC and SCADA when SCADA dials to the remote PLC. It establishes 9600 ,8,N,1 wireless link between the SCADA and PLC
  • 91.
    Dial up connection can be created between the SCADA and PC using GSM modems with RS232 interface. For this we require GSM radio with RS232 interface and SIM card with Data/Fax connectivity. For this system, PC will be connected with one GSM modem with data activated SIM card and other end SCADA with GSM modem consisting of data activated SIM card. SACDA with Dial up support facility will dial the remote PC GSM modem (support Dial up facility) and will get connected at a speed of 9600 bits per second. Thus PC and SCADA will be online after being connected using Dial up facility. They can operate on 9600 bps 8N1 data interface speed between them. Every Dial up and data transfer will generate a bill, subject to the SIM card inserted inside the GSM modems. Working philosophy in Brief
  • 92.
    RTU MASTER LOCATIONSCADA UNIT AT DELHI NETWORK ARCHITECHTURE-DIAL UP SYSTEM GSM modem RS-232 LOCATION 1 LOCATION 10 RS-232 SCADA GSM antenna with extension cable DELHI AAQMS NO.1 DELHI AAQMS NO.10 GSM antenna with extension cable RTU GSM modem RS-232 GSM antenna with extension cable GSM modem Working philosophy SCADA will dial from Master location to remote locations one after another and collect the data of remote RTU one after another. Thus remote RTU data can be collected at master station using GSM technology
  • 93.
    COMMUNICATION AQM/CEM CentralData Station ST 10 EnviDAS Software LCD Hi definition Display RS232/RS 485 /GSM Modem ST 4 ST 1 ST 3 ST 2 ST 5 LCD Hi definition Display Delhi Pune
  • 94.
    Operation & MaintenanceContract Activities
  • 95.
    Thermo – AQI,India Service Operations Overview
  • 96.
    Service Strengths DedicatedManpower Strong working experience Market Knowledge of Products and Apllications Well Trained Engineers Expert Product Specialists Geographic Reach Team of Service engineers on regional basis. Market Credibility Exclusive Technology Product Quality Proven Field Performance Support from US Office Dedicated Product Specialists for remote tech support
  • 97.
    Service Organization 3 Service Engineers 2 Open Positions 1 Service Engineer 1 Technician 1 Service Engineer 1 Technician 2 Sales/Service Engineers 1 Service Manager 1 Service Engineer 1 Service Engineer 1 Service Engineer 1 Technician Open
  • 98.
    Major Customers WestMPCB , HPCL, BPCL , TATA Power , RCF, NMMC , Reliance Energy, MCGM, NEERI , IIT, ONGC , IITM, IMD , DFPCL, RCF-Thal Central IOCL , PRL , IPCL, GSFC, ONGC (Hz, Ank, Bar), ESSAR , Reliance Petro, KRIBHCO, GSEG, NTPC, GPCB South CPCL, KSPCB , IIT, CPT, NFC, MALCO, JSW, VSP, NTPC, BPCL, EPL, GMR, NFCL, VSSC East WBPCB, IOCL (H), IOCL(D), TISCO, SAIL, L&T , RSP, Nalco, Balco , NTPC, CMRI North CPCB, NTPC, IOCL (Panipat, Mathura), GAIL , CRRI, DU, IOCL (F), RRVUNL, NPL , NEERI, IIT Customers marked in red are Thermo Users

Editor's Notes

  • #3 Thermo Electron and Fisher Scientific merged in November 2006, creating Thermo Fisher Scientific, the world leader in serving science. This was actually Fisher Scientific’s tagline, and it’s been adopted for the new combined company because it accurately reflects what we do. We deliver what our customers need for their important work in research, analysis, discovery and diagnostics The analytical instruments that help scientists research, equipment to keep labs running, bioreagents and chemicals used in experiments, consumables, software and services. All from one company!
  • #9 Globe image surrounded by other images including a facility image, service image, manufacturing image, incorporate Longevity
  • #10 Thermo Fisher Scientific products will be used for a range of applications, from high-end research to manufacturing to environmental monitoring and homeland security. We provide the tools to improve quality of results, whether customers are analyzing proteins in blood, the quality of air and water, or the steel used to make our cars.
  • #12 Over the years, the air quality group product offering has expanded from individual gaseous criteria pollutant analyzers to encompass a broad range of particulate monitors, toxic gas sensors, volatile organic compounds (VOC) analyzers and completely integrated ambient and stack monitoring systems.
  • #13 Modern Manufacturing Facilities and Processes: Global Service Organization with over # locations worldwide
  • #15 Voici la liste des polluants que l’on mesure aux émissions des sites industriels 1- Il faut se souvenir que seulement 10 ans auparavant, seules les 3 premières lignes et demi étaient alors d’actualité. 2- Non seulement les polluants ajoutés sont considérés comme les plus agressifs puisque l’on évoque des substances cancérigènes telles les dérivés benzéniques ou les dioxines & furannes, mais encore comme vous pouvez le constater sur cette représentation graphique, les concentrations massiques tendent vers l’infiniment petit. Bien sur, nous allons devoir évoluer, nous adapter. Mais surtout aujourd’hui nous en sommes conscient: notre avenir reste grand ouvert, à nous de saisir les bonnes opportunités.
  • #16 Our longtime Indian Partner, Leading Instrumentation Company Chemito Instruments Private Limited a group company of Toshniwal Instruments India Pvt. Ltd supports ENVIRONNEMENT S.A. Technology transfers and extended bilateral cooperation over the last eighteen years have led Environnement s.a to strengthen its base in India as result of business ties with the Indian leader in Integrated Systems for Environment Monitoring both Ambient & Emission .
  • #17 This is an example of a typical ambient air monitoring station containing real-time gaseous ambient monitors along with particulate monitors. This station is located in Brazil as part of a ten (10) ambient monitoring station network. The station is surrounded by a fence for security purposes. As with most ambient air monitoring stations, electrical power is needed to run the battery of monitors located inside the trailer. The monitors are located inside the trailer to protect them from the elements. Notice the air conditioning along the side of the building to provide inside air at a constant temperature. The mask on top of the building are the entry points for different monitors to draw outside air down through the mask into the analyzer in the building. The mask with the “tee pee” is the sample head for the PM-10 sampler located inside the building. The next couple of slides will illustrate the different types of particulate matter (PM) samplers, from TSP to PM-10 to PM-2.5 samplers.
  • #34 Now that we have seen the various ambient air monitoring programs, lets take a look at the cost of a single station to be fully equipped with monitoring the ambient air for EPA’s NAAQSs. Based upon the graphic, it would take around $82,000 to fully equip one (1) ambient air monitoring station for monitoring SO 2 , NO x , O 3 , CO, PM-2.5, meteorological parameters (I.e., wind speed, direction, stability, temperature, rainfall etc.), and visibility. All systems would be real-time continuous monitoring systems.
  • #36 CEM systems incorporate one of three sample acquisition techniques: dilution-extractive, extractive (i.e., sampling without dilution of the sample gas), and in-situ. Inherent differences exist among the three sampling techniques, and thus each technique has distinct strengths and weaknesses, which must be carefully evaluated when selecting an appropriate technique for a specific application. The sample acquisition techniques chosen by Part 75 affected utility companies are presented in Table 1. The following sections address the principle of operation for the most widely used and currently available equipment, and technological advancements for each sample acquisition technique.
  • #39 Dilution-extractive probe systems require a constant source of contamination free dilution air. The air supply should be dry (-20  to -40  F) and delivered at 90  10 psig. Additionally, the dilution air should be free of oils, particulates, CO 2 , NO x , and SO 2 . A plant’s compressed air system does not generally provide dilution air to the needed specification. Therefore, an additional air-cleanup system is required. In Part 75 dilution-extractive CEMS the air-cleanup system is the critical component of the dilution-extractive system. Figure 4 is a schematic of a typical dilution air-cleanup subsystem. Compressed air either from the plant's compressed air supply or from a dedicated air compressor is first filtered for particulates, then liquid and oils condensate by a coalescing filter. Oil removal is necessary to prevent the contamination of silica gel or other drying agents in the heatless air dryer. Additional drying of the dilution air is performed by a heatless dryer that can dry the air to approximately -100  F. The CO 2 extractor utilizes two columns with different adsorbent materials to adsorb any CO 2 in the dilution air. Some air cleaning systems may add a CO to CO 2 converter (not shown in Figure 4) before the CO 2 extractor if their analyzers respond to interferences from CO. A charcoal filter trap (not shown in Figure 4) may also be added to remove any hydrocarbons that may be in the dilution air. An additional desiccant dryer (not shown in Figure 4) may be added to provide additional moisture removal. A submicron filter removes any particulates that may be released from the upstream desiccant traps.
  • #88 Trend charts aree an excellent way to show variations in pollutants over time. The reviewer can quickly look at the chart and determine the characteristics of each pollutant over the period of time. Pollutant concentrations can quickly be observed without having to go to tables of data.
  • #89 Based upon the received environmental data, real-time trend charts can be developed and displayed for review. Another important parameter in ambient air monitoring is averaging times for sampled pollutants. The averaging times used for determining pollutant concentrations is typically determined by the duration required to collect a meaningful sample and by the intended use of the collected data. For example, 24-hour averages would be appropriate for long-term air quality trends. For pollutants that reach peak levels for short periods of time such as O 3 , a 1 hour or 8 hour averaging time would be more desirable. Real-time or continuous air monitoring instruments provide a continuous record of concentrations that can fluctuate over time. Therefore, data from continuous air monitoring instruments are integrated in order to provide hourly average concentrations for comparison to respective air quality standards. The NAAQS averaging times are: 24-hour and annual average for PM 10 , a 1-hour average for Ozone (O 3 ) and a 3-hour, 24-hour and annual average for SO 2 . Concentrations of PM 10 averaged over an entire year may be based on daily recordings or on only a more limited number of 24-hour samples. The graphic illustrates an example of the differences between real-time, 1-hour, and 4-hour averaging times for gaseous pollutants. Notice that human exposure to gaseous emissions can at times be higher than average recorded levels.
  • #90 This slide shows the commercial DAHS functions.