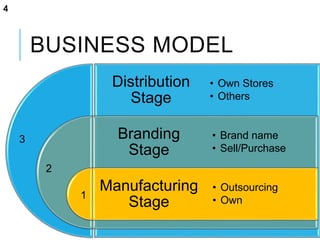
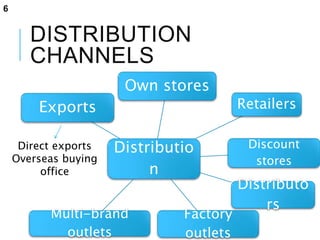
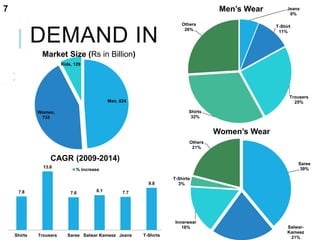
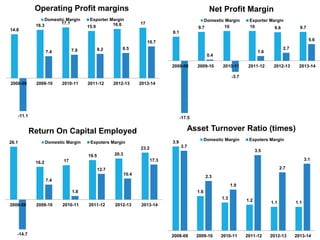
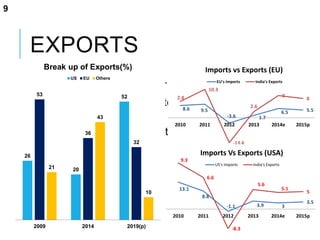
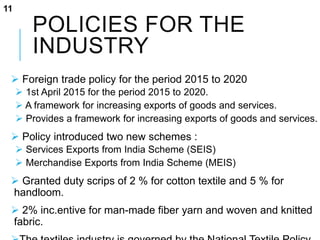
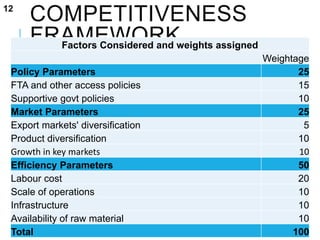
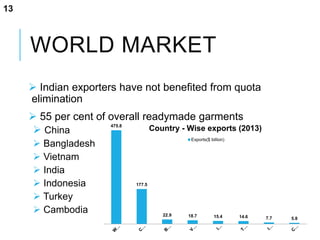
READYMADE
GARMENTS
By,
Mario Allen
Ashbin Jose
Sam Texeria
Anusha
Sribhasyam
Tinoj V Thomas
Rohit C
1
AGENDA
 Ready Made Garments Industry
 Business Model
 Distribution Channels
 Demand In India
 Industry Financial
 Exports
 Manufacturing Process
 Policies for the Industry
 Competitiveness Framework
 World Market
 Crisil Analysis
 Conclusion
2
READY MADE
GARMENTS
 India is the fourth largest manufacturer of garments after
China
 Indian Garment Industry earned a reputation
 Durability
 Quality
 Beauty
 Changing consumer preferences - buying branded
apparel
 Approximately 45% of India's total textile exports.
 Indian consumer is increasingly taking to ready-mades.
3
BUSINESS MODEL
Distribution
Stage
Branding
Stage
Manufacturing
Stage
• Own Stores
• Others
• Brand name
• Sell/Purchase
• Outsourcing
• Own1
2
3
4
Own Manufacturing - Own
Brand - Own/Other Stores
Own Manufacture - Purchased
brand - Own/Other Stores
Own manufacture
Sell to other brands
Outsource Manufacture -
Own brand - Own/Other
Outsource Manufacture
Purchased brand
Own/other Stores
5
DISTRIBUTION
CHANNELS
A network of outlets through which a product is
sold.
one or more distribution channels.
key strategies – decides the costs and revenues
Types of channels
 Own stores
 Retailers
 Shopping malls or MBOs
 Distributors
 Factory outlets
 Exports
Distributio
n
Own stores
Retailers
Discount
stores
Distributo
rs
Factory
outlets
Multi-brand
outlets
Exports
Direct exports
Overseas buying
office
6
DEMAND IN INDIA
 Key determinants
 Size of the population
 Favorable demographics
 Rising income levels
 Consumers' preference
 Marketing strategies
 Consumers' preference
 Instant availability
 Brand consciousness
 Credit facility (use of credit card)
 Fashion cycles (time factor)
63%
37%
Market size
Domestic Exports
1088
1151
1322
1488
1585
1688
2009 2010 2011 2012 2013 2014
Growth (Rs In Billion)
7
Men, 824
Women,
733
Kids, 129
Market Size (Rs in Billion)
Jeans
6%
T-Shirt
11%
Trousers
25%
Shirts
32%
Others
26%
Men’s Wear
7.8
13.6
7.6 8.1 7.7
9.8
Shirts Trousers Saree Salwar Kameez Jeans T-Shirts
CAGR (2009-2014)
% increase
Saree
39%
Salwar-
Kameez
21%
Innerwear
16%
T-Shirts
3%
Others
21%
Women’s Wear
INDUSTRY FINANCIAL
 Garment industry players can be classified into
 Manufacture garments for the domestic market.
 Manufacture for the export market.
 Domestic players enjoy better operating & net margins.
 Exporters face intense competition from other Countries.
 Growth in the domestic market was driven by rural
demand.
 Key cost components of companies
 Material costs – 55% (Domestic) 60% (Exporters)
 Employee costs – 12% - 13%
 Selling and distribution expenses – 6% (Domestic) 1%
(Exporters)
 Power costs -
 Other operating costs – 15% (Operating Income)
8
Raw Materials
54%
Other Operating Costs
15%
Employee Costs
13%
Tax provision and
Depreciation
10%
Others
8%
Domestic Cost Structure
Raw Materials
68%
Other Operating Costs
18%
Employee Costs
2%
Tax provision and
Depreciation
8%
Others
4%Exporters Cost Structure
14.8
16.3
17.1
15.9 16.6 17
-11.1
7.4 7.9 8.2 8.5
10.7
2008-09 2009-10 2010-11 2011-12 2012-13 2013-14
Operating Profit margins
Domestic Margin Exporter Margin
8.1
9.7 10 10 9.6 9.7
-17.5
0.4
-3.7
1.6
2.7
5.6
2008-09 2009-10 2010-11 2011-12 2012-13 2013-14
Net Profit Margin
Domestic Margin Exporter Margin
26.1
16.2 17
19.5 20.3
23.2
-14.7
7.4
1.8
12.7
10.4
17.3
2008-09 2009-10 2010-11 2011-12 2012-13 2013-14
Return On Capital Employed
Domestic Margin Expoters Margin 3.9
1.6
1.3 1.2 1.1 1.1
3.7
2.3
1.9
3.5
2.7
3.1
2008-09 2009-10 2010-11 2011-12 2012-13 2013-14
Asset Turnover Ratio (times)
Domestic Margin Expoters Margin
EXPORTS
 EU imports growing at 8 per cent y-o-y in first half of 2014
 India's exports to EU expected to grow by 9-10 per cent y-
o-y,
 India's export are expected to grow by 7-8 per cent in 2015
 US imports expected to grow by about 3 per cent in 2014
 India's exports to US are projected to grow by 5 per cent y-
o-y
 Economic recovery resulting in demand growth in US and
EU
9
26
20
5253
36
32
21
43
10
2009 2014 2019(p)
Break up of Exports(%)
US EU Others
8.6 9.5
-3.6 1.7
6.5 5.5
2.8
10.3
-13.6
2.6
9
8
2010 2011 2012 2013 2014e 2015p
Imports vs Exports (EU)
EU's Imports India's Exports
13.1
8.8
-1.1 3.9 3
3.5
9.3
6.6
-8.3
5.6
5.1
5
2010 2011 2012 2013 2014e 2015p
Imports Vs Exports (USA)
US's Imports India's Exports
MANUFACTURING
PROCESS
Natural Fibers Synthetic Fibers
Spinning Spun
Yarn
Weaving/Knitting Grey Fabric
Processing
Processed Fabric
Garment
Manufacturing
Distributio
10
POLICIES FOR THE
INDUSTRY
 Foreign trade policy for the period 2015 to 2020
 1st April 2015 for the period 2015 to 2020.
 A framework for increasing exports of goods and services.
 Provides a framework for increasing exports of goods and services.
 Policy introduced two new schemes :
 Services Exports from India Scheme (SEIS)
 Merchandise Exports from India Scheme (MEIS)
 Granted duty scrips of 2 % for cotton textile and 5 % for
handloom.
 2% inc.entive for man-made fiber yarn and woven and knitted
fabric.
11
COMPETITIVENESS
FRAMEWORK
 CRISIL Research has identified and analysed 10
factors.
 Broadly divided into three broad parameters:
 Policy parameters.
 Market parameters.
 Efficiency parameters.
 Garmenting is a labor intensive process.
 Second largest cost head.
 Exports also depends on factors
 Market diversification.
 Product diversification.
Factors Considered and weights assigned
Weightage
Policy Parameters 25
FTA and other access policies 15
Supportive govt policies 10
Market Parameters 25
Export markets' diversification 5
Product diversification 10
Growth in key markets 10
Efficiency Parameters 50
Labour cost 20
Scale of operations 10
Infrastructure 10
Availability of raw material 10
Total 100
12
WORLD MARKET
 Indian exporters have not benefited from quota
elimination
 55 per cent of overall readymade garments
 China
 Bangladesh
 Vietnam
 India
 Indonesia
 Turkey
 Cambodia
475.8
177.5
22.9 18.7 15.4 14.6 7.7 5.8
Country - Wise exports (2013)
Exports($ billion)
13
CRISIL ANALYSIS
 China leads RMG trade export trade – 1/3rds of exports
 India's market share has stagnated
 Competitive cost structures
 Labour costs
 Preferential trade agreements
 Labour cost, preferential trade agreements are key factors
 India less competitive than Asian peers
 Does not have free trade agreements
 Small scale of operations is a big drawback
 Archaic labour laws prevailing in the country
 Not able to cater to varying demand through the seasons
14
CONCLUSION
 India is blessed with ample raw materials
 Only garment exporter in the world that is cotton surplus.
 India has gained exposure to some of the growing markets.
 In 2013 and 2014, orders shifted from Bangladesh to India.
 Enabled a 12 per cent recovery in India's exports.
 India should focus on the following
 Diversify its products across fabrics.
 Expand the scale of operations.
 Improve labour cost structure.
 Reform labour laws.
 Entering into favorable trade agreements with its major export
markets.
15
16

Ready Made Garments

  • 1.
    READYMADE GARMENTS By, Mario Allen Ashbin Jose SamTexeria Anusha Sribhasyam Tinoj V Thomas Rohit C 1
  • 2.
    AGENDA  Ready MadeGarments Industry  Business Model  Distribution Channels  Demand In India  Industry Financial  Exports  Manufacturing Process  Policies for the Industry  Competitiveness Framework  World Market  Crisil Analysis  Conclusion 2
  • 3.
    READY MADE GARMENTS  Indiais the fourth largest manufacturer of garments after China  Indian Garment Industry earned a reputation  Durability  Quality  Beauty  Changing consumer preferences - buying branded apparel  Approximately 45% of India's total textile exports.  Indian consumer is increasingly taking to ready-mades. 3
  • 4.
    BUSINESS MODEL Distribution Stage Branding Stage Manufacturing Stage • OwnStores • Others • Brand name • Sell/Purchase • Outsourcing • Own1 2 3 4
  • 5.
    Own Manufacturing -Own Brand - Own/Other Stores Own Manufacture - Purchased brand - Own/Other Stores Own manufacture Sell to other brands Outsource Manufacture - Own brand - Own/Other Outsource Manufacture Purchased brand Own/other Stores 5
  • 6.
    DISTRIBUTION CHANNELS A network ofoutlets through which a product is sold. one or more distribution channels. key strategies – decides the costs and revenues Types of channels  Own stores  Retailers  Shopping malls or MBOs  Distributors  Factory outlets  Exports Distributio n Own stores Retailers Discount stores Distributo rs Factory outlets Multi-brand outlets Exports Direct exports Overseas buying office 6
  • 7.
    DEMAND IN INDIA Key determinants  Size of the population  Favorable demographics  Rising income levels  Consumers' preference  Marketing strategies  Consumers' preference  Instant availability  Brand consciousness  Credit facility (use of credit card)  Fashion cycles (time factor) 63% 37% Market size Domestic Exports 1088 1151 1322 1488 1585 1688 2009 2010 2011 2012 2013 2014 Growth (Rs In Billion) 7 Men, 824 Women, 733 Kids, 129 Market Size (Rs in Billion) Jeans 6% T-Shirt 11% Trousers 25% Shirts 32% Others 26% Men’s Wear 7.8 13.6 7.6 8.1 7.7 9.8 Shirts Trousers Saree Salwar Kameez Jeans T-Shirts CAGR (2009-2014) % increase Saree 39% Salwar- Kameez 21% Innerwear 16% T-Shirts 3% Others 21% Women’s Wear
  • 8.
    INDUSTRY FINANCIAL  Garmentindustry players can be classified into  Manufacture garments for the domestic market.  Manufacture for the export market.  Domestic players enjoy better operating & net margins.  Exporters face intense competition from other Countries.  Growth in the domestic market was driven by rural demand.  Key cost components of companies  Material costs – 55% (Domestic) 60% (Exporters)  Employee costs – 12% - 13%  Selling and distribution expenses – 6% (Domestic) 1% (Exporters)  Power costs -  Other operating costs – 15% (Operating Income) 8 Raw Materials 54% Other Operating Costs 15% Employee Costs 13% Tax provision and Depreciation 10% Others 8% Domestic Cost Structure Raw Materials 68% Other Operating Costs 18% Employee Costs 2% Tax provision and Depreciation 8% Others 4%Exporters Cost Structure 14.8 16.3 17.1 15.9 16.6 17 -11.1 7.4 7.9 8.2 8.5 10.7 2008-09 2009-10 2010-11 2011-12 2012-13 2013-14 Operating Profit margins Domestic Margin Exporter Margin 8.1 9.7 10 10 9.6 9.7 -17.5 0.4 -3.7 1.6 2.7 5.6 2008-09 2009-10 2010-11 2011-12 2012-13 2013-14 Net Profit Margin Domestic Margin Exporter Margin 26.1 16.2 17 19.5 20.3 23.2 -14.7 7.4 1.8 12.7 10.4 17.3 2008-09 2009-10 2010-11 2011-12 2012-13 2013-14 Return On Capital Employed Domestic Margin Expoters Margin 3.9 1.6 1.3 1.2 1.1 1.1 3.7 2.3 1.9 3.5 2.7 3.1 2008-09 2009-10 2010-11 2011-12 2012-13 2013-14 Asset Turnover Ratio (times) Domestic Margin Expoters Margin
  • 9.
    EXPORTS  EU importsgrowing at 8 per cent y-o-y in first half of 2014  India's exports to EU expected to grow by 9-10 per cent y- o-y,  India's export are expected to grow by 7-8 per cent in 2015  US imports expected to grow by about 3 per cent in 2014  India's exports to US are projected to grow by 5 per cent y- o-y  Economic recovery resulting in demand growth in US and EU 9 26 20 5253 36 32 21 43 10 2009 2014 2019(p) Break up of Exports(%) US EU Others 8.6 9.5 -3.6 1.7 6.5 5.5 2.8 10.3 -13.6 2.6 9 8 2010 2011 2012 2013 2014e 2015p Imports vs Exports (EU) EU's Imports India's Exports 13.1 8.8 -1.1 3.9 3 3.5 9.3 6.6 -8.3 5.6 5.1 5 2010 2011 2012 2013 2014e 2015p Imports Vs Exports (USA) US's Imports India's Exports
  • 10.
    MANUFACTURING PROCESS Natural Fibers SyntheticFibers Spinning Spun Yarn Weaving/Knitting Grey Fabric Processing Processed Fabric Garment Manufacturing Distributio 10
  • 11.
    POLICIES FOR THE INDUSTRY Foreign trade policy for the period 2015 to 2020  1st April 2015 for the period 2015 to 2020.  A framework for increasing exports of goods and services.  Provides a framework for increasing exports of goods and services.  Policy introduced two new schemes :  Services Exports from India Scheme (SEIS)  Merchandise Exports from India Scheme (MEIS)  Granted duty scrips of 2 % for cotton textile and 5 % for handloom.  2% inc.entive for man-made fiber yarn and woven and knitted fabric. 11
  • 12.
    COMPETITIVENESS FRAMEWORK  CRISIL Researchhas identified and analysed 10 factors.  Broadly divided into three broad parameters:  Policy parameters.  Market parameters.  Efficiency parameters.  Garmenting is a labor intensive process.  Second largest cost head.  Exports also depends on factors  Market diversification.  Product diversification. Factors Considered and weights assigned Weightage Policy Parameters 25 FTA and other access policies 15 Supportive govt policies 10 Market Parameters 25 Export markets' diversification 5 Product diversification 10 Growth in key markets 10 Efficiency Parameters 50 Labour cost 20 Scale of operations 10 Infrastructure 10 Availability of raw material 10 Total 100 12
  • 13.
    WORLD MARKET  Indianexporters have not benefited from quota elimination  55 per cent of overall readymade garments  China  Bangladesh  Vietnam  India  Indonesia  Turkey  Cambodia 475.8 177.5 22.9 18.7 15.4 14.6 7.7 5.8 Country - Wise exports (2013) Exports($ billion) 13
  • 14.
    CRISIL ANALYSIS  Chinaleads RMG trade export trade – 1/3rds of exports  India's market share has stagnated  Competitive cost structures  Labour costs  Preferential trade agreements  Labour cost, preferential trade agreements are key factors  India less competitive than Asian peers  Does not have free trade agreements  Small scale of operations is a big drawback  Archaic labour laws prevailing in the country  Not able to cater to varying demand through the seasons 14
  • 15.
    CONCLUSION  India isblessed with ample raw materials  Only garment exporter in the world that is cotton surplus.  India has gained exposure to some of the growing markets.  In 2013 and 2014, orders shifted from Bangladesh to India.  Enabled a 12 per cent recovery in India's exports.  India should focus on the following  Diversify its products across fabrics.  Expand the scale of operations.  Improve labour cost structure.  Reform labour laws.  Entering into favorable trade agreements with its major export markets. 15
  • 16.