This document provides definitions and formulas for various financial ratios used in ratio analysis. It includes ratios that measure liquidity (current ratio, quick ratio, etc.), activity (inventory turnover, accounts receivable turnover, etc.), debt (debt-equity ratio, long-term debt ratio, etc.), profitability (gross profit margin, net profit margin, return on assets, etc.), and market ratios (price-earnings ratio, market-to-book ratio, dividend yield). Formulas are given for key ratios along with standard benchmarks. Current assets, current liabilities, and components of equity and debt are defined for calculating various leverage and return ratios.
The presentation covers financial feasibility of projects, payback analysis, NPV analysis or discounted cash flow analysis, IRR analysis, Benefit to cost ratio analysis, B/C pitfalls, ROI
Basically computation of Project Appraisal technique with a special reference to financial parameters - Payback, Discounted Cash flow, NPV, IRR etc are explained. The slides are used for educating those who have taken up Project Finance recently
LA HUG - Video Testimonials with Chynna Morgan - June 2024Lital Barkan
Have you ever heard that user-generated content or video testimonials can take your brand to the next level? We will explore how you can effectively use video testimonials to leverage and boost your sales, content strategy, and increase your CRM data.🤯
We will dig deeper into:
1. How to capture video testimonials that convert from your audience 🎥
2. How to leverage your testimonials to boost your sales 💲
3. How you can capture more CRM data to understand your audience better through video testimonials. 📊
Building Your Employer Brand with Social MediaLuanWise
Presented at The Global HR Summit, 6th June 2024
In this keynote, Luan Wise will provide invaluable insights to elevate your employer brand on social media platforms including LinkedIn, Facebook, Instagram, X (formerly Twitter) and TikTok. You'll learn how compelling content can authentically showcase your company culture, values, and employee experiences to support your talent acquisition and retention objectives. Additionally, you'll understand the power of employee advocacy to amplify reach and engagement – helping to position your organization as an employer of choice in today's competitive talent landscape.
Company Valuation webinar series - Tuesday, 4 June 2024FelixPerez547899
This session provided an update as to the latest valuation data in the UK and then delved into a discussion on the upcoming election and the impacts on valuation. We finished, as always with a Q&A
Digital Transformation and IT Strategy Toolkit and TemplatesAurelien Domont, MBA
This Digital Transformation and IT Strategy Toolkit was created by ex-McKinsey, Deloitte and BCG Management Consultants, after more than 5,000 hours of work. It is considered the world's best & most comprehensive Digital Transformation and IT Strategy Toolkit. It includes all the Frameworks, Best Practices & Templates required to successfully undertake the Digital Transformation of your organization and define a robust IT Strategy.
Editable Toolkit to help you reuse our content: 700 Powerpoint slides | 35 Excel sheets | 84 minutes of Video training
This PowerPoint presentation is only a small preview of our Toolkits. For more details, visit www.domontconsulting.com
Premium MEAN Stack Development Solutions for Modern BusinessesSynapseIndia
Stay ahead of the curve with our premium MEAN Stack Development Solutions. Our expert developers utilize MongoDB, Express.js, AngularJS, and Node.js to create modern and responsive web applications. Trust us for cutting-edge solutions that drive your business growth and success.
Know more: https://www.synapseindia.com/technology/mean-stack-development-company.html
In the Adani-Hindenburg case, what is SEBI investigating.pptxAdani case
Adani SEBI investigation revealed that the latter had sought information from five foreign jurisdictions concerning the holdings of the firm’s foreign portfolio investors (FPIs) in relation to the alleged violations of the MPS Regulations. Nevertheless, the economic interest of the twelve FPIs based in tax haven jurisdictions still needs to be determined. The Adani Group firms classed these FPIs as public shareholders. According to Hindenburg, FPIs were used to get around regulatory standards.
Personal Brand Statement:
As an Army veteran dedicated to lifelong learning, I bring a disciplined, strategic mindset to my pursuits. I am constantly expanding my knowledge to innovate and lead effectively. My journey is driven by a commitment to excellence, and to make a meaningful impact in the world.
At Techbox Square, in Singapore, we're not just creative web designers and developers, we're the driving force behind your brand identity. Contact us today.
Tata Group Dials Taiwan for Its Chipmaking Ambition in Gujarat’s DholeraAvirahi City Dholera
The Tata Group, a titan of Indian industry, is making waves with its advanced talks with Taiwanese chipmakers Powerchip Semiconductor Manufacturing Corporation (PSMC) and UMC Group. The goal? Establishing a cutting-edge semiconductor fabrication unit (fab) in Dholera, Gujarat. This isn’t just any project; it’s a potential game changer for India’s chipmaking aspirations and a boon for investors seeking promising residential projects in dholera sir.
Visit : https://www.avirahi.com/blog/tata-group-dials-taiwan-for-its-chipmaking-ambition-in-gujarats-dholera/
Implicitly or explicitly all competing businesses employ a strategy to select a mix
of marketing resources. Formulating such competitive strategies fundamentally
involves recognizing relationships between elements of the marketing mix (e.g.,
price and product quality), as well as assessing competitive and market conditions
(i.e., industry structure in the language of economics).
Understanding User Needs and Satisfying ThemAggregage
https://www.productmanagementtoday.com/frs/26903918/understanding-user-needs-and-satisfying-them
We know we want to create products which our customers find to be valuable. Whether we label it as customer-centric or product-led depends on how long we've been doing product management. There are three challenges we face when doing this. The obvious challenge is figuring out what our users need; the non-obvious challenges are in creating a shared understanding of those needs and in sensing if what we're doing is meeting those needs.
In this webinar, we won't focus on the research methods for discovering user-needs. We will focus on synthesis of the needs we discover, communication and alignment tools, and how we operationalize addressing those needs.
Industry expert Scott Sehlhorst will:
• Introduce a taxonomy for user goals with real world examples
• Present the Onion Diagram, a tool for contextualizing task-level goals
• Illustrate how customer journey maps capture activity-level and task-level goals
• Demonstrate the best approach to selection and prioritization of user-goals to address
• Highlight the crucial benchmarks, observable changes, in ensuring fulfillment of customer needs
Auditing study material for b.com final year students
ratios analysis formula
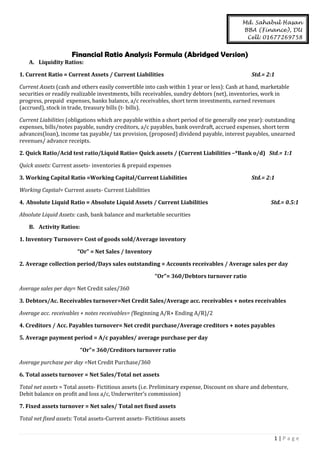
1. Md. Sahabul Hasan
BBA (Finance), DU
Cell: 01677269758
Financial Ratio Analysis Formula (Abridged Version)
A. Liquidity Ratios:
1. Current Ratio = Current Assets / Current Liabilities
Std.= 2:1
Current Assets (cash and others easily convertible into cash within 1 year or less): Cash at hand, marketable
securities or readily realizable investments, bills receivables, sundry debtors (net), inventories, work in
progress, prepaid expenses, banks balance, a/c receivables, short term investments, earned revenues
(accrued), stock in trade, treasury bills (t- bills).
Current Liabilities (obligations which are payable within a short period of tie generally one year): outstanding
expenses, bills/notes payable, sundry creditors, a/c payables, bank overdraft, accrued expenses, short term
advances(loan), income tax payable/ tax provision, (proposed) dividend payable, interest payables, unearned
revenues/ advance receipts.
2. Quick Ratio/Acid test ratio/Liquid Ratio= Quick assets / (Current Liabilities –*Bank o/d) Std.= 1:1
Quick assets: Current assets- inventories & prepaid expenses
3. Working Capital Ratio =Working Capital/Current Liabilities
Std.= 2:1
Working Capital= Current assets- Current Liabilities
4. Absolute Liquid Ratio = Absolute Liquid Assets / Current Liabilities
Std.= 0.5:1
Absolute Liquid Assets: cash, bank balance and marketable securities
B. Activity Ratios:
1. Inventory Turnover= Cost of goods sold/Average inventory
“Or” = Net Sales / Inventory
2. Average collection period/Days sales outstanding = Accounts receivables / Average sales per day
“Or”= 360/Debtors turnover ratio
Average sales per day= Net Credit sales/360
3. Debtors/Ac. Receivables turnover=Net Credit Sales/Average acc. receivables + notes receivables
Average acc. receivables + notes receivables= (Beginning A/R+ Ending A/R)/2
4. Creditors / Acc. Payables turnover= Net credit purchase/Average creditors + notes payables
5. Average payment period = A/c payables/ average purchase per day
“Or”= 360/Creditors turnover ratio
Average purchase per day =Net Credit Purchase/360
6. Total assets turnover = Net Sales/Total net assets
Total net assets = Total assets- Fictitious assets (i.e. Preliminary expense, Discount on share and debenture,
Debit balance on profit and loss a/c, Underwriter’s commission)
7. Fixed assets turnover = Net sales/ Total net fixed assets
Total net fixed assets: Total assets-Current assets- Fictitious assets
1|Page
2. C. Proportion of Debt (Balance Sheet) Ratios:
1. Debt-Equity Ratio: Total long term debt/Total Equity
Total long term debt= Debentures, bonds, mortgages, Long term loan, Industrial loan
Total equity/shareholders fund= Paid up equity share capital, preference share capital, capital reserves,
revenue reserves, and reserves , reserves for contingencies, undistributed profit, sinking fund-(Accumulated
losses, deferred expenses, preliminary expenses and other fictitious assets)
2. Long term debt- Total capital ratio= Total long term debt/Total long term capital
Total long term capital/invested capital=Total long term debt, Shareholders equity, preferred stock
3. Proprietary or Equity Ratio = Shareholders funds / Total Assets
4. Debt Ratio = Total Liabilities (CL+LTL)/ Total assets
5. Interest Coverage Ratio/Times Int. Earned = Earnings before Interest & Tax / Fixed Interest Charges
6. Capital Gearing Ratio = Fixed Interest Bearing Funds/ Equity Share Capital
Fixed Interest Bearing Funds= Debentures, bonds, mortgages, Long term loan, Industrial loan & preferred Equity
D. Profitability Ratios:
1. Gross profit margin= (Sales-Cost of goods sold)/Sales
2. Net profit margin= Net profit (income)/Sales
3. Operating profit margin= operating profit (EBIT)/Sales
Operating profit=Gross profit-SG&A expenses
4. Earnings per share= Earnings available for common stockholders/No. of common shares outstanding
Earnings available for common stockholders= Net Income-Preferred Dividend
5. Return on Asset (ROA) = Earnings available for common stockholders/Total Assets
6. Return on Equity (ROE) = Earnings available for common stockholders/Total Equity
7. Dividend per share (DPS) = Dividend paid or declared to common shareholder/ No. of Common share
8. Dividend payout ratio= DPS/EPS (*100)
9. Retention rate= (EPS-DPS)/EPS (*100)
10. Return on Capital Employed= EBIT “or” EAT/Average total capital employed (*100)
Average total capital employed=Shareholders funds (Common &Preferred), Long term debt
11. DuPont Ratio=ROE =
=
=
= Profit Margin
TAT
Financial Leverage
E. Market Ratios:
1. Price/Earnings (P/E) ratio = Market price per share/EPS
2. Market/Book value (M/B) ratio = Market Price per share/ Book value per share
Book value per share =Shareholders funds (total equity)/No. of shares outstanding
3. Dividend Yield = DPS/Mkt. price per share *100
2|Page