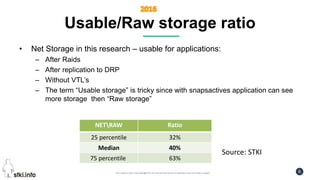
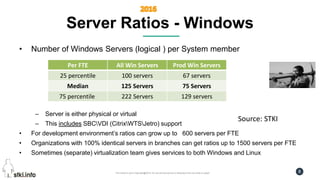
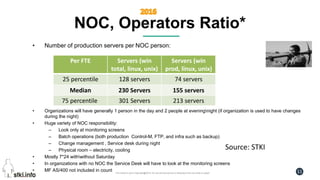
Pini Cohen’s work Copyright@2016. Do not remove source or attribution from any slide or graph
STKI 2016 Ratios
• PC support
• Security
• Networking
• Storage
• Servers
• NOC
• Data Center
• DBA
• Enterprise System Management
Pini Cohen’s work Copyright@2016. Do not remove source or attribution from any slide or graph 2
PC Support Ratios
• Support Per PC for FTE
• Support per Employee for FTE
Total Support
per PC
Third – ImageSecond LevelService
Desk
Per FTE
15911882798133825 percentile
1931938429500Median
338362584772975 percentile
Total Support
per Empl.
Third – ImageSecond LevelService
Desk
Per FTE
114121321333825 percentile
1762250359450Median
303300065670275 percentile
Source: STKI
Pini Cohen’s work Copyright@2016. Do not remove source or attribution from any slide or graph 3
IT security personal
• Number of employees (that use computers) divided to
total number of security related IT personal
Source: STKI
# employees /
# IT security
personal
Per FTE
27025 percentile
571Median
75075 percentile
Pini Cohen’s work Copyright@2016. Do not remove source or attribution from any slide or graph 4
Networking active ports ratio
• Number of active ports divided to total ports:
Source: STKI
Active ports
ratio - DC
Active ports
ratio - total
Per FTE
63%50%25 percentile
83%60%Median
89%75%75 percentile
Pini Cohen’s work Copyright@2016. Do not remove source or attribution from any slide or graph 5
Networking personal ratio
• Ports per network personal
Source: STKI
Networking
Per FTE # active
ports per
data
personal
# total ports
per data
personal
# dc active
ports per dc
network
personal
# dc total
ports per dc
network
personal
25 percentile 1000 1667 175 250
Median 1111 2000 263 500
75 percentile 2000 2400 444 625
Pini Cohen’s work Copyright@2016. Do not remove source or attribution from any slide or graph 6
Usable/Raw storage ratio
• Net Storage in this research – usable for applications:
– After Raids
– After replication to DRP
– Without VTL’s
– The term “Usable storage” is tricky since with snapsactives application can see
more storage then “Raw storage”
RatioNETRAW
32%25 percentile
40%Median
63%75 percentile
Source: STKI
Pini Cohen’s work Copyright@2016. Do not remove source or attribution from any slide or graph 7
Storage Ratios
• Number of Raw PB and Usable PB per Storage Staff Member FTE
(including backup and DRP of storage):
Source: STKI
Usable StorageRAW StoragePer FTE
0.12P0.23P25 percentile
0.24P0.67PMedian
0.4P1P75 percentile
Pini Cohen’s work Copyright@2016. Do not remove source or attribution from any slide or graph 8
Server Ratios - Windows
• Number of Windows Servers (logical ) per System member
– Server is either physical or virtual
– This includes SBCVDI (CitrixWTSJetro) support
• For development environment’s ratios can grow up to 600 servers per FTE
• Organizations with 100% identical servers in branches can get ratios up to 1500 servers per FTE
• Sometimes (separate) virtualization team gives services to both Windows and Linux
Source: STKI
Prod Win ServersAll Win ServersPer FTE
67 servers100 servers25 percentile
75 Servers125 ServersMedian
129 servers222 Servers75 percentile
Pini Cohen’s work Copyright@2016. Do not remove source or attribution from any slide or graph 9
Percent of Production Windows server from all Windows servers
Percent of prod
servers
Per FTE
50%25 percentile
60%Median
70%75 percentile
Source: STKI
Server is either physical or virtual
Pini Cohen’s work Copyright@2016. Do not remove source or attribution from any slide or graph 10
How many users are supported by SBC (Terminal ServerVDI) FTE
Users per SBC FTEPer FTE
37525 percentile
825Median
194275 percentile
Source: STKI
Users and not concurrent users
Users might work completely on SBC or partly (just deliver several applications)
The heavy SBC users (above 7500 users) will have “mini team” of 3-4 FTE
The rest of the users will have 0.5 to 1 FTE as part of the general system team
Pini Cohen’s work Copyright@2016. Do not remove source or attribution from any slide or graph 11
NOC, Operators Ratio*
• Number of production servers per NOC person:
• Organizations will have generally 1 person in the day and 2 people at eveningnight (if organization is used to have changes
during the night)
• Huge variety of NOC responsibility:
– Look only at monitoring screens
– Batch operations (both production Control-M, FTP, and infra such as backup)
– Change management , Service desk during night
– Physical room – electricity, cooling
• Mostly 7*24 withwithout Saturday
• In organizations with no NOC the Service Desk will have to look at the monitoring screens
• MF AS/400 not included in count
Source: STKI
Servers (win
prod, linux, unix)
Servers (win
total, linux, unix)
Per FTE
74 servers128 servers25 percentile
155 servers230 ServersMedian
213 servers301 Servers75 percentile
Pini Cohen’s work Copyright@2016. Do not remove source or attribution from any slide or graph 12
DBA Ratios
• Number of open applications (all instances – dev, test,
prod counted as 1) supported by DBA (very big
variations… the developer ratios might be better)
Source: STKI
# of applicationsPer FTE
1225 percentile
31Median
4575 percentile
Pini Cohen’s work Copyright@2016. Do not remove source or attribution from any slide or graph 13
DBMS Support Ratios
• Number of developers (in the Open) supported
by DBA FTE
Source: STKI
# of developersPer FTE
1325 percentile
15Median
3375 percentile
Pini Cohen’s work Copyright@2016. Do not remove source or attribution from any slide or graph 14
SOAESB ratio
# of interfaces / # esb-soa
team
Per FTE
8525 percentile
100Median
15175 percentile
• “Interfaces” are defined and architected differently (example – “unique
customer data interface” for all applincations vs. several “customer data
interface per each application”)
Source: STKI
Pini Cohen’s work Copyright@2016. Do not remove source or attribution from any slide or graph 15
ESM (Enterprise System Management)
support ratio
• Numbers of servers in Open (Win –prod , Linux, Unix) covered by ESM
team (including BSM, CMDB, etc. – if implemented)
• MF AS/400 not included in server count – significant bias. Best metric is
“per CI monitored…”.
# of Servers (all)Per FTE
10625 percentile
398Median
63375 percentile
Source: STKI
Pini Cohen’s work Copyright@2016. Do not remove source or attribution from any slide or graph 16
ESM (Enterprise System Management)
support ratio per CI
• Numbers of CI (Configuration Item) in ESM covered by ESM team
(including BSM, CMDB, etc. – if implemented)
• MF AS/400 not included in server count – significant bias. Best metric is
“per CI monitored…”.
• The big variety demonstrates the large difference in ESM status (quality and
type of monitoring)
• Data is from last year
# of Servers (all)Per FTE
96325 percentile
3000Median
541775 percentile
Source: STKI

Ratios 2016 v1

  • 1.
    Pini Cohen’s workCopyright@2016. Do not remove source or attribution from any slide or graph STKI 2016 Ratios • PC support • Security • Networking • Storage • Servers • NOC • Data Center • DBA • Enterprise System Management
  • 2.
    Pini Cohen’s workCopyright@2016. Do not remove source or attribution from any slide or graph 2 PC Support Ratios • Support Per PC for FTE • Support per Employee for FTE Total Support per PC Third – ImageSecond LevelService Desk Per FTE 15911882798133825 percentile 1931938429500Median 338362584772975 percentile Total Support per Empl. Third – ImageSecond LevelService Desk Per FTE 114121321333825 percentile 1762250359450Median 303300065670275 percentile Source: STKI
  • 3.
    Pini Cohen’s workCopyright@2016. Do not remove source or attribution from any slide or graph 3 IT security personal • Number of employees (that use computers) divided to total number of security related IT personal Source: STKI # employees / # IT security personal Per FTE 27025 percentile 571Median 75075 percentile
  • 4.
    Pini Cohen’s workCopyright@2016. Do not remove source or attribution from any slide or graph 4 Networking active ports ratio • Number of active ports divided to total ports: Source: STKI Active ports ratio - DC Active ports ratio - total Per FTE 63%50%25 percentile 83%60%Median 89%75%75 percentile
  • 5.
    Pini Cohen’s workCopyright@2016. Do not remove source or attribution from any slide or graph 5 Networking personal ratio • Ports per network personal Source: STKI Networking Per FTE # active ports per data personal # total ports per data personal # dc active ports per dc network personal # dc total ports per dc network personal 25 percentile 1000 1667 175 250 Median 1111 2000 263 500 75 percentile 2000 2400 444 625
  • 6.
    Pini Cohen’s workCopyright@2016. Do not remove source or attribution from any slide or graph 6 Usable/Raw storage ratio • Net Storage in this research – usable for applications: – After Raids – After replication to DRP – Without VTL’s – The term “Usable storage” is tricky since with snapsactives application can see more storage then “Raw storage” RatioNETRAW 32%25 percentile 40%Median 63%75 percentile Source: STKI
  • 7.
    Pini Cohen’s workCopyright@2016. Do not remove source or attribution from any slide or graph 7 Storage Ratios • Number of Raw PB and Usable PB per Storage Staff Member FTE (including backup and DRP of storage): Source: STKI Usable StorageRAW StoragePer FTE 0.12P0.23P25 percentile 0.24P0.67PMedian 0.4P1P75 percentile
  • 8.
    Pini Cohen’s workCopyright@2016. Do not remove source or attribution from any slide or graph 8 Server Ratios - Windows • Number of Windows Servers (logical ) per System member – Server is either physical or virtual – This includes SBCVDI (CitrixWTSJetro) support • For development environment’s ratios can grow up to 600 servers per FTE • Organizations with 100% identical servers in branches can get ratios up to 1500 servers per FTE • Sometimes (separate) virtualization team gives services to both Windows and Linux Source: STKI Prod Win ServersAll Win ServersPer FTE 67 servers100 servers25 percentile 75 Servers125 ServersMedian 129 servers222 Servers75 percentile
  • 9.
    Pini Cohen’s workCopyright@2016. Do not remove source or attribution from any slide or graph 9 Percent of Production Windows server from all Windows servers Percent of prod servers Per FTE 50%25 percentile 60%Median 70%75 percentile Source: STKI Server is either physical or virtual
  • 10.
    Pini Cohen’s workCopyright@2016. Do not remove source or attribution from any slide or graph 10 How many users are supported by SBC (Terminal ServerVDI) FTE Users per SBC FTEPer FTE 37525 percentile 825Median 194275 percentile Source: STKI Users and not concurrent users Users might work completely on SBC or partly (just deliver several applications) The heavy SBC users (above 7500 users) will have “mini team” of 3-4 FTE The rest of the users will have 0.5 to 1 FTE as part of the general system team
  • 11.
    Pini Cohen’s workCopyright@2016. Do not remove source or attribution from any slide or graph 11 NOC, Operators Ratio* • Number of production servers per NOC person: • Organizations will have generally 1 person in the day and 2 people at eveningnight (if organization is used to have changes during the night) • Huge variety of NOC responsibility: – Look only at monitoring screens – Batch operations (both production Control-M, FTP, and infra such as backup) – Change management , Service desk during night – Physical room – electricity, cooling • Mostly 7*24 withwithout Saturday • In organizations with no NOC the Service Desk will have to look at the monitoring screens • MF AS/400 not included in count Source: STKI Servers (win prod, linux, unix) Servers (win total, linux, unix) Per FTE 74 servers128 servers25 percentile 155 servers230 ServersMedian 213 servers301 Servers75 percentile
  • 12.
    Pini Cohen’s workCopyright@2016. Do not remove source or attribution from any slide or graph 12 DBA Ratios • Number of open applications (all instances – dev, test, prod counted as 1) supported by DBA (very big variations… the developer ratios might be better) Source: STKI # of applicationsPer FTE 1225 percentile 31Median 4575 percentile
  • 13.
    Pini Cohen’s workCopyright@2016. Do not remove source or attribution from any slide or graph 13 DBMS Support Ratios • Number of developers (in the Open) supported by DBA FTE Source: STKI # of developersPer FTE 1325 percentile 15Median 3375 percentile
  • 14.
    Pini Cohen’s workCopyright@2016. Do not remove source or attribution from any slide or graph 14 SOAESB ratio # of interfaces / # esb-soa team Per FTE 8525 percentile 100Median 15175 percentile • “Interfaces” are defined and architected differently (example – “unique customer data interface” for all applincations vs. several “customer data interface per each application”) Source: STKI
  • 15.
    Pini Cohen’s workCopyright@2016. Do not remove source or attribution from any slide or graph 15 ESM (Enterprise System Management) support ratio • Numbers of servers in Open (Win –prod , Linux, Unix) covered by ESM team (including BSM, CMDB, etc. – if implemented) • MF AS/400 not included in server count – significant bias. Best metric is “per CI monitored…”. # of Servers (all)Per FTE 10625 percentile 398Median 63375 percentile Source: STKI
  • 16.
    Pini Cohen’s workCopyright@2016. Do not remove source or attribution from any slide or graph 16 ESM (Enterprise System Management) support ratio per CI • Numbers of CI (Configuration Item) in ESM covered by ESM team (including BSM, CMDB, etc. – if implemented) • MF AS/400 not included in server count – significant bias. Best metric is “per CI monitored…”. • The big variety demonstrates the large difference in ESM status (quality and type of monitoring) • Data is from last year # of Servers (all)Per FTE 96325 percentile 3000Median 541775 percentile Source: STKI