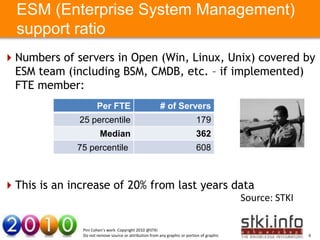
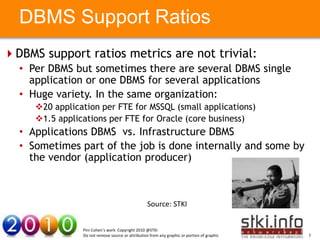
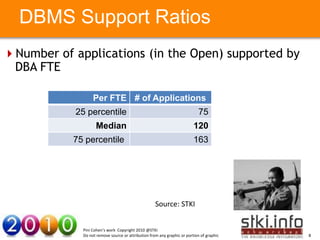
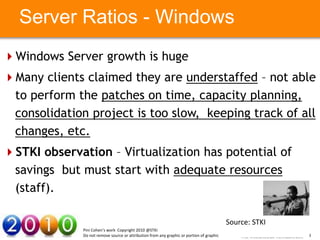
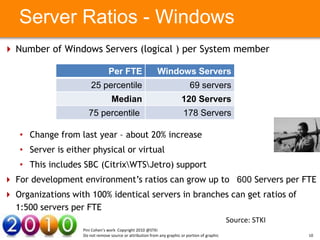
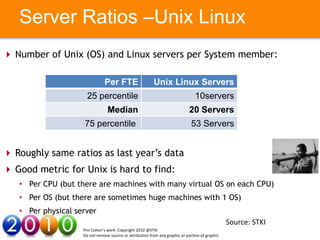
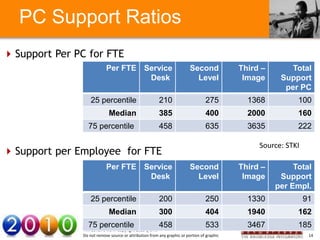
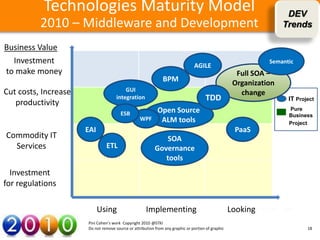
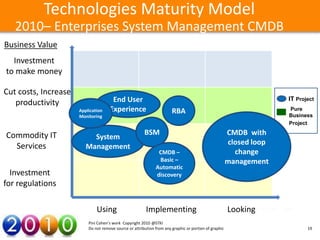
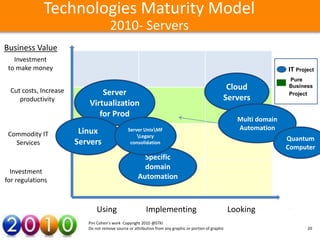
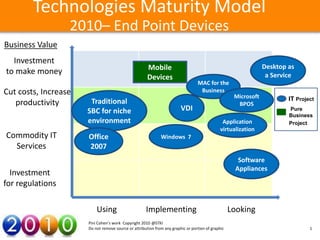
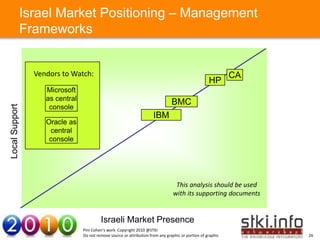
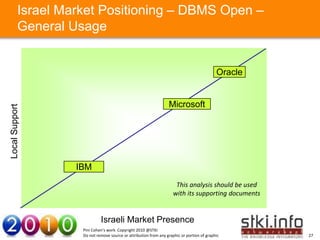
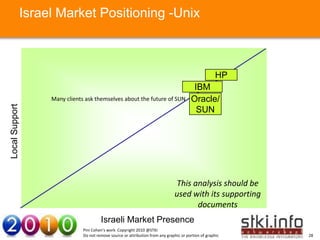
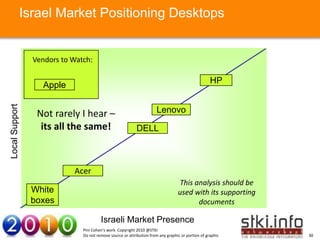
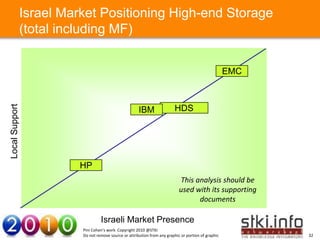
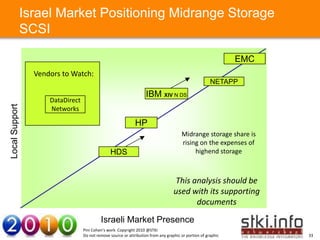
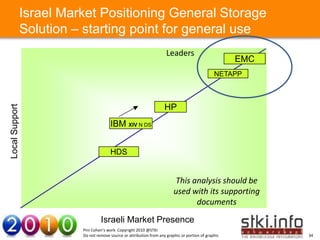
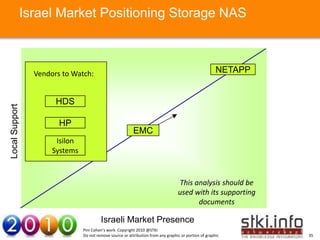
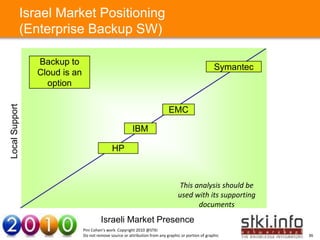
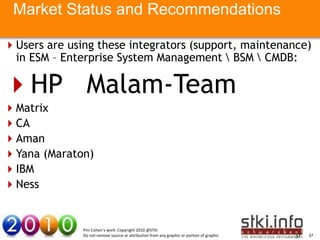
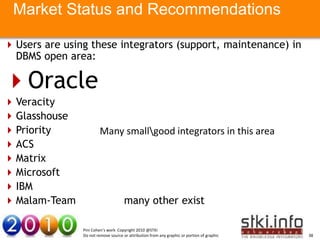
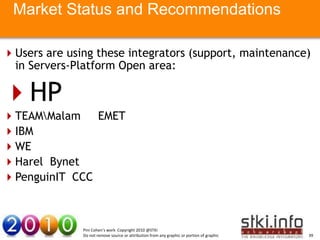
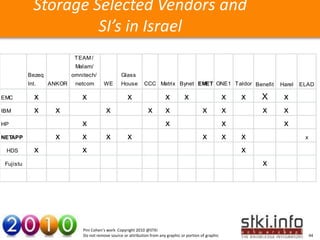
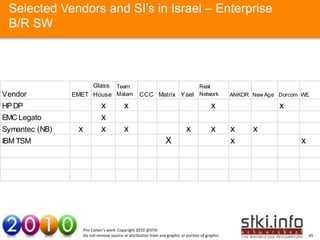
Architecture and Infrastructure:
Staffing Ratios, Maturity model, vendor
positioning , integrators used, resellers


          Pini Cohen
          Architecture and Infrastructure
          EVP & Senior Analyst
          pinicohenstki.blogspot.com
Table of content
• Staffing ratios: ESBSOA, Enterprise System Management  CMDB, DBA,
  Servers – Windows, Linux, PC , Storage
• Maturity Models: DevelopmentSOA, Enterprise System
  ManagementCMDB, Platforms, PC, Storage
• Storage size and growth ratio
• Positioning of vendors: ESBSOA, ETL , Enterprise System Management
  suites, DBMS, Unix Servers IntelAMD servers, Desktops, Laptops, High
  End Storage, Midrange Storage, General purpose Storage, NAS , Backup
  SW
• Integrators used in: Enterprise System Management , DBMS support,
  Serversplatforms , Clients support, Storage, Backup
• Resellers of : ESM products, Storage, backup SW


                   Pini Cohen’s work Copyright 2010 @STKI
                   Do not remove source or attribution from any graphic or portion of graphic   2
EAISOA Support Ratios
EAI  SOA variations are very big:
  • From static (old) messaging interface (MQ) to new and changing “SOA”
    service
  • How “thick” is the interface: 20 times a day to 20,000 a minute
  • How involved are the applications developers?
  • Example of service : “update flight details to web site”, “credit
    scoring” , etc.
  • How Yourcount?! Example: there is one big service “Retrieve document”
         to Text here                                  Your Text here
    but this services is accessing 10 applications and 3 document
    management environments. It also has several variationsaccess
    methods. So what should be the count?!


                                                           Source: STKI
                 Pini Cohen’s work Copyright 2010 @STKI
                 Do not remove source or attribution from any graphic or portion of graphic   3
EAISOA Support Ratios
Number of Services/Interfaces supported by
 Integration/ESB/SOA team FTE

                             Per FTE                    # of Services
                   25 percentile                                                37
       Your Text here         Median                                          100              Your Text here
                   75 percentile                                              125


                                                            Source: STKI

                  Pini Cohen’s work Copyright 2010 @STKI
                  Do not remove source or attribution from any graphic or portion of graphic                    4
ESM (Enterprise System
 Management) Ratios
ESM Ratios are very different from companies
 implementing ESM solutions since the level of
 implementation, internal processes , tools and
 automation is very different.
The KPI itself –” per Servers “– is not ideal as well since
 it doe not here indication to Routers, Storagehere
      Your Text give                       Your Text devices,
 “check readers”, etc.
Data point in the STKI survey 1 FTE per 1000 server. STKI
 comment “close the project!”


                                                   Source: STKI
              Pini Cohen’s work Copyright 2010 @STKI
              Do not remove source or attribution from any graphic or portion of graphic   5
ESM (Enterprise System Management)
  support ratio
Numbers of servers in Open (Win, Linux, Unix) covered by
 ESM team (including BSM, CMDB, etc. – if implemented)
 FTE member:
                          Per FTE                            # of Servers
                  25 percentile                                                 179
        Your Text here                                                                          Your Text here
                            Median                                              362
                 75 percentile                                                  608


This is an increase of 20% from last years data
                                                                                                    Source: STKI

                   Pini Cohen’s work Copyright 2010 @STKI
                   Do not remove source or attribution from any graphic or portion of graphic                      6
DBMS Support Ratios
DBMS support ratios metrics are not trivial:
  • Per DBMS but sometimes there are several DBMS single
    application or one DBMS for several applications
  • Huge variety. In the same organization:
     20 application per FTE for MSSQL (small applications)
     1.5 applications per FTE for Oracle (core business)
        Your Text here                                                                          Your Text here
  • Applications DBMS vs. Infrastructure DBMS
  • Sometimes part of the job is done internally and some by
    the vendor (application producer)


                                                     Source: STKI


                   Pini Cohen’s work Copyright 2010 @STKI
                   Do not remove source or attribution from any graphic or portion of graphic                    7
DBMS Support Ratios
Number of applications (in the Open) supported by
 DBA FTE

                        Per FTE # of Applications
                25 percentile                                                   75
       Your Text here   Median                                                120              Your Text here
               75 percentile                                                  163


                                                         Source: STKI


                  Pini Cohen’s work Copyright 2010 @STKI
                  Do not remove source or attribution from any graphic or portion of graphic                    8
Server Ratios - Windows
Windows Server growth is huge
Many clients claimed they are understaffed – not able
 to perform the patches on time, capacity planning,
 consolidation project is too slow, keeping track of all
 changes,Text here
       Your
            etc.                       Your Text here


STKI observation – Virtualization has potential of
 savings but must start with adequate resources
 (staff).

                                                                                           Source: STKI
              Pini Cohen’s work Copyright 2010 @STKI
              Do not remove source or attribution from any graphic or portion of graphic                  9
Server Ratios - Windows
 Number of Windows Servers (logical ) per System member

                                  Per FTE                    Windows Servers
                           25 percentile                                       69 servers
                                    Median                                120 Servers
                        75 percentile                                      178 Servers
          Your Text here                                                                          Your Text here
   • Change from last year – about 20% increase
   • Server is either physical or virtual
   • This includes SBC (CitrixWTSJetro) support
 For development environment’s ratios can grow up to 600 Servers per FTE
 Organizations with 100% identical servers in branches can get ratios of
  1:500 servers per FTE
                                                                                                  Source: STKI
                     Pini Cohen’s work Copyright 2010 @STKI
                     Do not remove source or attribution from any graphic or portion of graphic                    10
Server Ratios –Unix Linux
 Number of Unix (OS) and Linux servers per System member:

                                Per FTE                    Unix Linux Servers
                       25 percentile                                              10servers
                                  Median                                      20 Servers
                       75
          Your Text here    percentile                                         53 Servers Text here
                                                                                       Your


 Roughly same ratios as last year’s data
 Good metric for Unix is hard to find:
   • Per CPU (but there are machines with many virtual OS on each CPU)
   • Per OS (but there are sometimes huge machines with 1 OS)
   • Per physical server
                                                                                                  Source: STKI
                     Pini Cohen’s work Copyright 2010 @STKI
                     Do not remove source or attribution from any graphic or portion of graphic                  11
PC Support Ratios
Support per PC is not equal to Support per Employee
 since there might be organizations with more PC and
 Employees (some employees has more than one PC) or
 vice versa (one PC is used for several employees working
 in shifts). The difference is small.
Service desk ratios variation is related a lot to the
 “application support” and even “business support”.
        Your Text here                      Your Text here

Applicationbusiness related support might be up to 30%
 of service desk effort


                                                                      Source: STKI


               Pini Cohen’s work Copyright 2010 @STKI
               Do not remove source or attribution from any graphic or portion of graphic   12
PC Support Ratios and TCO
2nd level support is dependent on geographical locations
 and related devices (“check readers”)
PC Second Level support Ratios variation is very big since
 in some organizations the field technicians are part of
 new system implementation, some are responsible for
 HW (and some not…)
        Your Text here                     Your Text here
Thin client reduces the need for 2 nd level support but

 increases the need for infrasystem support
Is the SBC system part of System or PC ?!


                                                               Source: STKI
               Pini Cohen’s work Copyright 2010 @STKI
               Do not remove source or attribution from any graphic or portion of graphic   13
PC Support Ratios
 Support Per PC for FTE
                               Per FTE Service                               Second             Third –       Total
                                        Desk                                   Level             Image     Support
                                                                                                            per PC
                       25 percentile                        210                      275          1368          100
                                Median                      385                      400          2000          160
        Your Text here75 percentile                         458                      635 Your Text here
                                                                                                3635            222

                                                                                                     Source: STKI
 Support per Employee for FTE
                               Per FTE Service                               Second             Third –        Total
                                        Desk                                   Level             Image     Support
                                                                                                          per Empl.
                       25 percentile                        200                      250          1330              91
                                Median                      300                      404          1940          162
                     75 percentile                          458                      533          3467          185
                   Pini Cohen’s work Copyright 2010 @STKI
                   Do not remove source or attribution from any graphic or portion of graphic                        14
Storage Ratios
 Many issues in storage ratios:
   • What is Usable storage?
   • Answer: after Raids and Storage needed for internal usage
   • But it is not usable storage for applications – DRP, “cold copies”)
   • Raid 1 vs. Raid 0 vs. Raid 5 (and other Raid types)
   • VTL storage here
         Your Text (more storage but helps operations!) Your Text here
   • Backup operation is handled by several teams
   • On January I had 100TB. On February I purchased another 100TB. What
     does that mean about my ratios?


                    Pini Cohen’s work Copyright 2010 @STKI
                    Do not remove source or attribution from any graphic or portion of graphic   15
Storage Ratios

 Storage is the area where many clients complained they are
  understaffed – not able to control the allocations, proactive
  maintenance , new technologies
 Want to have better ratios? allocate each application highend
  storage x4 of what was asked….
         Your Text here                      Your Text here

 STKI predicts – IT failures caused by Storage


                                                                            Source: STKI
                Pini Cohen’s work Copyright 2010 @STKI
                Do not remove source or attribution from any graphic or portion of graphic   16
Storage Ratios
 Number of Raw TB and Usable TB per Storage Staff Member
  FTE (including backup and DRP of storage):


            Per FTE               RAW Storage Usable Storage
       25 percentile                                75 TB                                   36 TB
         Your Median
              Text here                          200 TB                                     92 Your Text here
                                                                                               TB
       75 percentile                             333 TB                                  221 TB


 About (unbelievable!) 100% increase from last years data
  (Median Raw Storage capacity per FTE)
                                                                                Source: STKI
                    Pini Cohen’s work Copyright 2010 @STKI
                    Do not remove source or attribution from any graphic or portion of graphic                  17
Technologies Maturity Model                                                                              DEV
          2010 – Middleware and Development                                                                        Trends

Business Value
  Investment                                                                                                  Semantic
                                                                               AGILE
to make money                                                                                        Full SOA –
                                                              BPM                                   Organization
Cut costs, Increase                      GUI
                                                                                                      change
                                     integration                                     TDD                            IT Project
   productivity
                                       ESB                 Open Source                                              Pure
                                                                                                                    Business
                                                  WPF       ALM tools                                               Project
                      EAI                                                                           PaaS
Commodity IT                                                 SOA
  Services                     ETL                        Governance
                                                             tools
  Investment
for regulations

                            Using                    Implementing                                  Looking
                      Pini Cohen’s work Copyright 2010 @STKI
                      Do not remove source or attribution from any graphic or portion of graphic                           18
Technologies Maturity Model
   2010– Enterprises System Management CMDB
Business Value
  Investment
to make money

Cut costs, Increase
   productivity                       End User                                                                       IT Project
                      Application    Experience                        RBA                                           Pure
                      Monitoring                                                                                     Business
                                                                                                                     Project

Commodity IT                                            BSM                                            CMDB with
                           System
                                                                                                       closed loop
  Services               Management
                                                               CMDB –                                    change
                                                               Basic –                                 management
                                                              Automatic
  Investment                                                  discovery
for regulations

                              Using                      Implementing                                  Looking
                          Pini Cohen’s work Copyright 2010 @STKI
                          Do not remove source or attribution from any graphic or portion of graphic                        19
Technologies Maturity Model
                                      2010- Servers
Business Value
   Investment
 to make money                                                                                                           IT Project
                                                                                                                         Pure

  Cut costs, Increase                                                                                Cloud               Business
                               Server                                                                                    Project
     productivity                                                                                   Servers
                           Virtualization
                              for Prod
                                                                                                          Multi domain
                                                                                                          Automation
 Commodity IT            Linux                  Server UnixMF
                                                    Legacy
                                                                                                                         Quantum
   Services             Servers                  consolidation
                                                                                                                         Computer
                                                       Specific
                                                       domain
  Investment
for regulations                                      Automation


                               Using                      Implementing                                  Looking
                           Pini Cohen’s work Copyright 2010 @STKI
                           Do not remove source or attribution from any graphic or portion of graphic                           20
Technologies Maturity Model
                  2010– End Point Devices
Business Value
  Investment
                                                      Mobile                                                    Desktop as
to make money                                                                                                    a Service
                                                      Devices
                                                                                 MAC for the
Cut costs, Increase                                                               Business
                                                                                                    Microsoft
                       Traditional                                                                                      IT Project
   productivity                                                                                      BPOS
                      SBC for niche                                     VDI                                             Pure
                                                                                                                        Business
                      environment                                                              Application              Project
                                                                                              virtualization
Commodity IT          Office                                 Windows 7
  Services            2007
                                                                                                      Software
                                                                                                     Appliances
  Investment
for regulations

                          Using                      Implementing                                  Looking
                      Pini Cohen’s work Copyright 2010 @STKI
                      Do not remove source or attribution from any graphic or portion of graphic                               21
Technologies Maturity Model
                            2010- Storage
Business Value
  Investment
to make money                                                                     Sophisticated
                                                             CDP                snaps for creating
                                                                                  environments
Cut costs, Increase
                                                Dedup                     Green
   productivity                                   for                    Storage

                                                Backup                                                   Storage
                                                                                     Thin              Virtualization
                                                                                 Provisioning
Commodity IT
                        NAS and                                               FCOE
  Services               SAN
                                                      Flash
                                                      Drives                                           Cloud
  Investment                 Email                                                                    Storage
for regulations            Archiving


                          Using                      Implementing                                  Looking
                      Pini Cohen’s work Copyright 2010 @STKI
                      Do not remove source or attribution from any graphic or portion of graphic                        22
Storage Size and Growth
in Selected Industries
   Industry                      2010 1Q Size                            Planned
                                 RAW                                     Growth per
                                                                         year
   Defense                       500TB-4P                                50%- 100%
   Finance                       400TB-1P                                40% - 75%
   Health                        140TB-350TB                             30%-50%
   Your Text here                                                                          Your Text here
   Manufacturing –               40TB-200TB                              20%-50%
   Retail
   Telco                         900TB-2.5 PETA                          30%-50%
   Governmental                  10TB-30TB                               25%-100%


   High Tech                     40TB-150TB                              20%-30%

              Pini Cohen’s work Copyright 2010 @STKI
              Do not remove source or attribution from any graphic or portion of graphic                    23
Israel Market Positioning Integration Brokers 
                SOA infrastructure


                  Vendors to Watch:
                                                                  Magic
                      ezBlox                                                      Tibco    IBM
                                                                                    Oracle
Local Support


                     Your Text here                                                                          Your Text here   Worldwide
                                                     Microsoft                                                                Leader

                               SoftwareAG

                                                                                  This analysis should be
                                                                                 used with its supporting
                                                                                        documents

                                         Israeli Market Presence
                                Pini Cohen’s work Copyright 2010 @STKI
                                Do not remove source or attribution from any graphic or portion of graphic                            24
Israel Market Positioning - ETL


                                                                                                    Informatica


                                                                                         IBM
Local Support


                    Your Text here                       Oracle                                             Your Text here
                                                        (OWB + ODI )


                            Microsoft

                                                                                  This analysis should be
                                                                                  used with its supporting
                                                                                        documents
                                        Israeli Market Presence
                               Pini Cohen’s work Copyright 2010 @STKI
                               Do not remove source or attribution from any graphic or portion of graphic                    25
Israel Market Positioning – Management
                Frameworks


                  Vendors to Watch:                                                                            CA
                                                                                                      HP
                     Microsoft
                     as central
                                                                                  BMC
Local Support


                      console
                                                                        IBM
                     Oracle as
                     Your Text here
                      central                                                                                  Your Text here
                      console


                                                                                    This analysis should be used
                                                                                   with its supporting documents


                                           Israeli Market Presence
                                  Pini Cohen’s work Copyright 2010 @STKI
                                  Do not remove source or attribution from any graphic or portion of graphic                    26
Israel Market Positioning – DBMS Open –
          General Usage


                                                                                                   Oracle


                                                                         Microsoft
Local Support


                Your Text here                                                                          Your Text here


                         IBM
                                                                             This analysis should be used
                                                                            with its supporting documents


                                    Israeli Market Presence
                           Pini Cohen’s work Copyright 2010 @STKI
                           Do not remove source or attribution from any graphic or portion of graphic                    27
Israel Market Positioning -Unix


                                                                                                         HP
                                                                                            IBM
                     Many clients ask themselves about the future of SUN                   Oracle/
Local Support


                                                                                             SUN
                    Your Text here                                                                            Your Text here


                                                                                   This analysis should be
                                                                                  used with its supporting
                                                                                         documents
                                          Israeli Market Presence
                                 Pini Cohen’s work Copyright 2010 @STKI
                                 Do not remove source or attribution from any graphic or portion of graphic                    28
Israel Market Positioning – Industry Standard
                Processors X86 including blades (Intel  AMD)

                  Vendors to Watch:                                                                                HP

                     Cisco                                                                           IBM
Local Support


                      Your Text here                                                                          Your Text here
                                                        DELL

                             Oracle/
                              SUN
                                                                                    This analysis should be
                                                                                    used with its supporting
                                                                                          documents

                                          Israeli Market Presence
                                 Pini Cohen’s work Copyright 2010 @STKI
                                 Do not remove source or attribution from any graphic or portion of graphic                    29
Israel Market Positioning Desktops


                  Vendors to Watch:

                                                                                                     HP
                    Apple
Local Support


                   Not rarely I hear –                                  Lenovo
                    its allText here
                      Your the same!                         DELL                                            Your Text here


                             Acer
                                                                                   This analysis should be
                 White                                                             used with its supporting
                 boxes                                                                   documents

                                         Israeli Market Presence
                                Pini Cohen’s work Copyright 2010 @STKI
                                Do not remove source or attribution from any graphic or portion of graphic                    30
Israel Market Positioning Laptops


                  Vendors to Watch:
                                                                                                        Lenovo
                                                                                             HP
                     LG
                   Toshiba                                               DELL
Local Support


                    Sony
                    Apple here
                     Your Text                                                                               Your Text here   Worldwide
                                                                                                                              Leader


                                                                                   This analysis should be
                                                                                   used with its supporting
                                                                                         documents

                                         Israeli Market Presence
                                Pini Cohen’s work Copyright 2010 @STKI
                                Do not remove source or attribution from any graphic or portion of graphic                          31
Israel Market Positioning High-end Storage
                (total including MF)


                                                                                                            EMC
Local Support


                                                             IBM                HDS

                    Your Text here                                                                          Your Text here


                              HP
                                                                                   This analysis should be
                                                                                   used with its supporting
                                                                                         documents

                                        Israeli Market Presence
                               Pini Cohen’s work Copyright 2010 @STKI
                               Do not remove source or attribution from any graphic or portion of graphic                    32
Israel Market Positioning Midrange Storage
                SCSI

                                                                                                                EMC
                  Vendors to Watch:
                                                                                                        NETAPP
                                                                     IBM XIV N DS
                      DataDirect
Local Support


                      Networks

                     Your Text here
                                                               HP                                       Your Text here
                                                                                        Midrange storage share is
                                                                                        rising on the expenses of
                                                 HDS                                         highend storage


                                                                                     This analysis should be
                                                                                    used with its supporting
                                                                                           documents

                                            Israeli Market Presence
                                   Pini Cohen’s work Copyright 2010 @STKI
                                   Do not remove source or attribution from any graphic or portion of graphic            33
Israel Market Positioning General Storage
                Solution – starting point for general use
                                                                            Leaders
                                                                                                              EMC
                                                                                                      NETAPP


                                                                           HP
Local Support


                    Your Text here           IBM XIV N DS                                                   Your Text here


                                             HDS


                                                                                 This analysis should be
                                                                                used with its supporting
                                                                                       documents

                                        Israeli Market Presence
                               Pini Cohen’s work Copyright 2010 @STKI
                               Do not remove source or attribution from any graphic or portion of graphic                    34
Israel Market Positioning Storage NAS


                  Vendors to Watch:                                                                      NETAPP


                        HDS
Local Support


                         HP
                     Your Text here                                                                           Your Text here
                                                            EMC
                        Isilon
                       Systems


                                                                                    This analysis should be
                                                                                    used with its supporting
                                                                                          documents

                                          Israeli Market Presence
                                 Pini Cohen’s work Copyright 2010 @STKI
                                 Do not remove source or attribution from any graphic or portion of graphic                    35
Israel Market Positioning
                (Enterprise Backup SW)

                   Backup to
                                                                                                        Symantec
                   Cloud is an
                     option
Local Support


                                                                               EMC
                     Your Text here                        IBM                                                Your Text here


                                                HP


                                                                                    This analysis should be
                                                                                    used with its supporting
                                                                                          documents
                                          Israeli Market Presence
                                 Pini Cohen’s work Copyright 2010 @STKI
                                 Do not remove source or attribution from any graphic or portion of graphic                    36
Market Status and Recommendations

Users are using these integrators (support, maintenance)
 in ESM – Enterprise System Management  BSM  CMDB:

HP Malam-Team
Matrix
CA    Your Text here                                                                          Your Text here
Aman
Yana (Maraton)
IBM
Ness


                  Pini Cohen’s work Copyright 2010 @STKI
                  Do not remove source or attribution from any graphic or portion of graphic                    37   37
Market Status and Recommendations

 Users are using these integrators (support, maintenance) in
  DBMS open area:

Oracle
 Veracity
 Glasshouse
 Priority Text here Many smallgood integrators Your Text here
         Your
                                                 in this area
 ACS
 Matrix
 Microsoft
 IBM
 Malam-Team             many other exist

                  Pini Cohen’s work Copyright 2010 @STKI
                  Do not remove source or attribution from any graphic or portion of graphic   38
Market Status and Recommendations

Users are using these integrators (support, maintenance)
 in Servers-Platform Open area:

HP
TEAMMalam         EMET
IBM Your Text here                                                                         Your Text here

WE
Harel Bynet
PenguinIT CCC


               Pini Cohen’s work Copyright 2010 @STKI
               Do not remove source or attribution from any graphic or portion of graphic                    39
Market Status and Recommendations

Users are using these integrators (support, maintenance)
 in Clients area:

One1                                Malam-Team
Taldor
Calanit )excellence in migration projects) Text here
       Your Text here                     Your
Dorcom
Omnitech
HP
Matrix
Hayun

               Pini Cohen’s work Copyright 2010 @STKI
               Do not remove source or attribution from any graphic or portion of graphic   40
Market Status and Trends

Survey has shown that these integrators are used:
 (providers – from service point of view) in Storage area:

EMC
Netapp Text here
      Your                                                                                  Your Text here

HDS
IBM Malam-Team Ankor Glasshouse
HP
WE


               Pini Cohen’s work Copyright 2010 @STKI
               Do not remove source or attribution from any graphic or portion of graphic                    41
Market Status and Trends
Survey has shown that these integrators are used:
 (providers – from service point of view) in backup area:

GlassHouse
IBM
HP     Your Text here                                                                          Your Text here

Emet


                   Pini Cohen’s work Copyright 2010 @STKI
                   Do not remove source or attribution from any graphic or portion of graphic                    42
Selected ESM products and integrators

         Selected products and Integrators
                                 Team
              Matrix /           Malam                                                Yana
         IGS Tangram Ness        Netcom AMAN          CCC Bynet Techmind              (Maraton)     HeadON          WE Ticomsoft   Ludan   SecureTeam    In2it


CA                           x     x                             x           x


Tivoli    x       x                                     x                                          x (netcool)       x             x       x             x

                         Your Text here                                                                                  Your Text here
HP                                             x                                           x                              x


BMC               x                            x


                                       Pini Cohen’s work Copyright 2010 @STKI
                                       Do not remove source or attribution from any graphic or portion of graphic                                       43
Storage Selected Vendors and
                      SI’s in Israel
                            T EAM /
                            Malam/
           Bezeq           omnitech/               Glass
           Int.    ANKOR    netcom        WE       House        CCC Matrix Bynet EMET ONE1 T aldor Benefit                     Harel   ELAD

EMC           x               x                        x                   x          x                     x     x      X      x
IBM           x      x                     x                      x        x                    x           x             x     x
HP                            x
                   Your Text here
                                                                           x                                x Your Text here    x
NETAPP               x        x            x           x                                        x           x     x                     x

 HDS          x               x                                                                                   x
 Fujistu                                                                                                                  x


                               Pini Cohen’s work Copyright 2010 @STKI
                               Do not remove source or attribution from any graphic or portion of graphic                                   44
Selected Vendors and SI’s in Israel – Enterprise
 B/R SW


                       Glass Team                                                   Real
Vendor            EMET House Malam                 CCC Matrix Y ael                 Network       ANKOR New Age Dorcom WE

HP DP                         x            x                                              x                       x
EMC Legato                    x
Symantec (NB) Text here
            Your    x         x            x                                 x            x       Your Textx
                                                                                                   x       here
IBM TSM                                                          X                                 x                  x


                     Pini Cohen’s work Copyright 2010 @STKI
                     Do not remove source or attribution from any graphic or portion of graphic                           45

Summit 2010 Infra Ratios Positionning Integrators

  • 1.
    Architecture and Infrastructure: StaffingRatios, Maturity model, vendor positioning , integrators used, resellers Pini Cohen Architecture and Infrastructure EVP & Senior Analyst pinicohenstki.blogspot.com
  • 2.
    Table of content •Staffing ratios: ESBSOA, Enterprise System Management CMDB, DBA, Servers – Windows, Linux, PC , Storage • Maturity Models: DevelopmentSOA, Enterprise System ManagementCMDB, Platforms, PC, Storage • Storage size and growth ratio • Positioning of vendors: ESBSOA, ETL , Enterprise System Management suites, DBMS, Unix Servers IntelAMD servers, Desktops, Laptops, High End Storage, Midrange Storage, General purpose Storage, NAS , Backup SW • Integrators used in: Enterprise System Management , DBMS support, Serversplatforms , Clients support, Storage, Backup • Resellers of : ESM products, Storage, backup SW Pini Cohen’s work Copyright 2010 @STKI Do not remove source or attribution from any graphic or portion of graphic 2
  • 3.
    EAISOA Support Ratios EAI SOA variations are very big: • From static (old) messaging interface (MQ) to new and changing “SOA” service • How “thick” is the interface: 20 times a day to 20,000 a minute • How involved are the applications developers? • Example of service : “update flight details to web site”, “credit scoring” , etc. • How Yourcount?! Example: there is one big service “Retrieve document” to Text here Your Text here but this services is accessing 10 applications and 3 document management environments. It also has several variationsaccess methods. So what should be the count?! Source: STKI Pini Cohen’s work Copyright 2010 @STKI Do not remove source or attribution from any graphic or portion of graphic 3
  • 4.
    EAISOA Support Ratios Numberof Services/Interfaces supported by Integration/ESB/SOA team FTE Per FTE # of Services 25 percentile 37 Your Text here Median 100 Your Text here 75 percentile 125 Source: STKI Pini Cohen’s work Copyright 2010 @STKI Do not remove source or attribution from any graphic or portion of graphic 4
  • 5.
    ESM (Enterprise System Management) Ratios ESM Ratios are very different from companies implementing ESM solutions since the level of implementation, internal processes , tools and automation is very different. The KPI itself –” per Servers “– is not ideal as well since it doe not here indication to Routers, Storagehere Your Text give Your Text devices, “check readers”, etc. Data point in the STKI survey 1 FTE per 1000 server. STKI comment “close the project!” Source: STKI Pini Cohen’s work Copyright 2010 @STKI Do not remove source or attribution from any graphic or portion of graphic 5
  • 6.
    ESM (Enterprise SystemManagement) support ratio Numbers of servers in Open (Win, Linux, Unix) covered by ESM team (including BSM, CMDB, etc. – if implemented) FTE member: Per FTE # of Servers 25 percentile 179 Your Text here Your Text here Median 362 75 percentile 608 This is an increase of 20% from last years data Source: STKI Pini Cohen’s work Copyright 2010 @STKI Do not remove source or attribution from any graphic or portion of graphic 6
  • 7.
    DBMS Support Ratios DBMSsupport ratios metrics are not trivial: • Per DBMS but sometimes there are several DBMS single application or one DBMS for several applications • Huge variety. In the same organization: 20 application per FTE for MSSQL (small applications) 1.5 applications per FTE for Oracle (core business) Your Text here Your Text here • Applications DBMS vs. Infrastructure DBMS • Sometimes part of the job is done internally and some by the vendor (application producer) Source: STKI Pini Cohen’s work Copyright 2010 @STKI Do not remove source or attribution from any graphic or portion of graphic 7
  • 8.
    DBMS Support Ratios Numberof applications (in the Open) supported by DBA FTE Per FTE # of Applications 25 percentile 75 Your Text here Median 120 Your Text here 75 percentile 163 Source: STKI Pini Cohen’s work Copyright 2010 @STKI Do not remove source or attribution from any graphic or portion of graphic 8
  • 9.
    Server Ratios -Windows Windows Server growth is huge Many clients claimed they are understaffed – not able to perform the patches on time, capacity planning, consolidation project is too slow, keeping track of all changes,Text here Your etc. Your Text here STKI observation – Virtualization has potential of savings but must start with adequate resources (staff). Source: STKI Pini Cohen’s work Copyright 2010 @STKI Do not remove source or attribution from any graphic or portion of graphic 9
  • 10.
    Server Ratios -Windows  Number of Windows Servers (logical ) per System member Per FTE Windows Servers 25 percentile 69 servers Median 120 Servers 75 percentile 178 Servers Your Text here Your Text here • Change from last year – about 20% increase • Server is either physical or virtual • This includes SBC (CitrixWTSJetro) support  For development environment’s ratios can grow up to 600 Servers per FTE  Organizations with 100% identical servers in branches can get ratios of 1:500 servers per FTE Source: STKI Pini Cohen’s work Copyright 2010 @STKI Do not remove source or attribution from any graphic or portion of graphic 10
  • 11.
    Server Ratios –UnixLinux  Number of Unix (OS) and Linux servers per System member: Per FTE Unix Linux Servers 25 percentile 10servers Median 20 Servers 75 Your Text here percentile 53 Servers Text here Your  Roughly same ratios as last year’s data  Good metric for Unix is hard to find: • Per CPU (but there are machines with many virtual OS on each CPU) • Per OS (but there are sometimes huge machines with 1 OS) • Per physical server Source: STKI Pini Cohen’s work Copyright 2010 @STKI Do not remove source or attribution from any graphic or portion of graphic 11
  • 12.
    PC Support Ratios Supportper PC is not equal to Support per Employee since there might be organizations with more PC and Employees (some employees has more than one PC) or vice versa (one PC is used for several employees working in shifts). The difference is small. Service desk ratios variation is related a lot to the “application support” and even “business support”. Your Text here Your Text here Applicationbusiness related support might be up to 30% of service desk effort Source: STKI Pini Cohen’s work Copyright 2010 @STKI Do not remove source or attribution from any graphic or portion of graphic 12
  • 13.
    PC Support Ratiosand TCO 2nd level support is dependent on geographical locations and related devices (“check readers”) PC Second Level support Ratios variation is very big since in some organizations the field technicians are part of new system implementation, some are responsible for HW (and some not…) Your Text here Your Text here Thin client reduces the need for 2 nd level support but increases the need for infrasystem support Is the SBC system part of System or PC ?! Source: STKI Pini Cohen’s work Copyright 2010 @STKI Do not remove source or attribution from any graphic or portion of graphic 13
  • 14.
    PC Support Ratios Support Per PC for FTE Per FTE Service Second Third – Total Desk Level Image Support per PC 25 percentile 210 275 1368 100 Median 385 400 2000 160 Your Text here75 percentile 458 635 Your Text here 3635 222 Source: STKI  Support per Employee for FTE Per FTE Service Second Third – Total Desk Level Image Support per Empl. 25 percentile 200 250 1330 91 Median 300 404 1940 162 75 percentile 458 533 3467 185 Pini Cohen’s work Copyright 2010 @STKI Do not remove source or attribution from any graphic or portion of graphic 14
  • 15.
    Storage Ratios  Manyissues in storage ratios: • What is Usable storage? • Answer: after Raids and Storage needed for internal usage • But it is not usable storage for applications – DRP, “cold copies”) • Raid 1 vs. Raid 0 vs. Raid 5 (and other Raid types) • VTL storage here Your Text (more storage but helps operations!) Your Text here • Backup operation is handled by several teams • On January I had 100TB. On February I purchased another 100TB. What does that mean about my ratios? Pini Cohen’s work Copyright 2010 @STKI Do not remove source or attribution from any graphic or portion of graphic 15
  • 16.
    Storage Ratios  Storageis the area where many clients complained they are understaffed – not able to control the allocations, proactive maintenance , new technologies  Want to have better ratios? allocate each application highend storage x4 of what was asked…. Your Text here Your Text here  STKI predicts – IT failures caused by Storage Source: STKI Pini Cohen’s work Copyright 2010 @STKI Do not remove source or attribution from any graphic or portion of graphic 16
  • 17.
    Storage Ratios  Numberof Raw TB and Usable TB per Storage Staff Member FTE (including backup and DRP of storage): Per FTE RAW Storage Usable Storage 25 percentile 75 TB 36 TB Your Median Text here 200 TB 92 Your Text here TB 75 percentile 333 TB 221 TB  About (unbelievable!) 100% increase from last years data (Median Raw Storage capacity per FTE) Source: STKI Pini Cohen’s work Copyright 2010 @STKI Do not remove source or attribution from any graphic or portion of graphic 17
  • 18.
    Technologies Maturity Model DEV 2010 – Middleware and Development Trends Business Value Investment Semantic AGILE to make money Full SOA – BPM Organization Cut costs, Increase GUI change integration TDD IT Project productivity ESB Open Source Pure Business WPF ALM tools Project EAI PaaS Commodity IT SOA Services ETL Governance tools Investment for regulations Using Implementing Looking Pini Cohen’s work Copyright 2010 @STKI Do not remove source or attribution from any graphic or portion of graphic 18
  • 19.
    Technologies Maturity Model 2010– Enterprises System Management CMDB Business Value Investment to make money Cut costs, Increase productivity End User IT Project Application Experience RBA Pure Monitoring Business Project Commodity IT BSM CMDB with System closed loop Services Management CMDB – change Basic – management Automatic Investment discovery for regulations Using Implementing Looking Pini Cohen’s work Copyright 2010 @STKI Do not remove source or attribution from any graphic or portion of graphic 19
  • 20.
    Technologies Maturity Model 2010- Servers Business Value Investment to make money IT Project Pure Cut costs, Increase Cloud Business Server Project productivity Servers Virtualization for Prod Multi domain Automation Commodity IT Linux Server UnixMF Legacy Quantum Services Servers consolidation Computer Specific domain Investment for regulations Automation Using Implementing Looking Pini Cohen’s work Copyright 2010 @STKI Do not remove source or attribution from any graphic or portion of graphic 20
  • 21.
    Technologies Maturity Model 2010– End Point Devices Business Value Investment Mobile Desktop as to make money a Service Devices MAC for the Cut costs, Increase Business Microsoft Traditional IT Project productivity BPOS SBC for niche VDI Pure Business environment Application Project virtualization Commodity IT Office Windows 7 Services 2007 Software Appliances Investment for regulations Using Implementing Looking Pini Cohen’s work Copyright 2010 @STKI Do not remove source or attribution from any graphic or portion of graphic 21
  • 22.
    Technologies Maturity Model 2010- Storage Business Value Investment to make money Sophisticated CDP snaps for creating environments Cut costs, Increase Dedup Green productivity for Storage Backup Storage Thin Virtualization Provisioning Commodity IT NAS and FCOE Services SAN Flash Drives Cloud Investment Email Storage for regulations Archiving Using Implementing Looking Pini Cohen’s work Copyright 2010 @STKI Do not remove source or attribution from any graphic or portion of graphic 22
  • 23.
    Storage Size andGrowth in Selected Industries Industry 2010 1Q Size Planned RAW Growth per year Defense 500TB-4P 50%- 100% Finance 400TB-1P 40% - 75% Health 140TB-350TB 30%-50% Your Text here Your Text here Manufacturing – 40TB-200TB 20%-50% Retail Telco 900TB-2.5 PETA 30%-50% Governmental 10TB-30TB 25%-100% High Tech 40TB-150TB 20%-30% Pini Cohen’s work Copyright 2010 @STKI Do not remove source or attribution from any graphic or portion of graphic 23
  • 24.
    Israel Market PositioningIntegration Brokers SOA infrastructure Vendors to Watch: Magic ezBlox Tibco IBM Oracle Local Support Your Text here Your Text here Worldwide Microsoft Leader SoftwareAG This analysis should be used with its supporting documents Israeli Market Presence Pini Cohen’s work Copyright 2010 @STKI Do not remove source or attribution from any graphic or portion of graphic 24
  • 25.
    Israel Market Positioning- ETL Informatica IBM Local Support Your Text here Oracle Your Text here (OWB + ODI ) Microsoft This analysis should be used with its supporting documents Israeli Market Presence Pini Cohen’s work Copyright 2010 @STKI Do not remove source or attribution from any graphic or portion of graphic 25
  • 26.
    Israel Market Positioning– Management Frameworks Vendors to Watch: CA HP Microsoft as central BMC Local Support console IBM Oracle as Your Text here central Your Text here console This analysis should be used with its supporting documents Israeli Market Presence Pini Cohen’s work Copyright 2010 @STKI Do not remove source or attribution from any graphic or portion of graphic 26
  • 27.
    Israel Market Positioning– DBMS Open – General Usage Oracle Microsoft Local Support Your Text here Your Text here IBM This analysis should be used with its supporting documents Israeli Market Presence Pini Cohen’s work Copyright 2010 @STKI Do not remove source or attribution from any graphic or portion of graphic 27
  • 28.
    Israel Market Positioning-Unix HP IBM Many clients ask themselves about the future of SUN Oracle/ Local Support SUN Your Text here Your Text here This analysis should be used with its supporting documents Israeli Market Presence Pini Cohen’s work Copyright 2010 @STKI Do not remove source or attribution from any graphic or portion of graphic 28
  • 29.
    Israel Market Positioning– Industry Standard Processors X86 including blades (Intel AMD) Vendors to Watch: HP Cisco IBM Local Support Your Text here Your Text here DELL Oracle/ SUN This analysis should be used with its supporting documents Israeli Market Presence Pini Cohen’s work Copyright 2010 @STKI Do not remove source or attribution from any graphic or portion of graphic 29
  • 30.
    Israel Market PositioningDesktops Vendors to Watch: HP Apple Local Support Not rarely I hear – Lenovo its allText here Your the same! DELL Your Text here Acer This analysis should be White used with its supporting boxes documents Israeli Market Presence Pini Cohen’s work Copyright 2010 @STKI Do not remove source or attribution from any graphic or portion of graphic 30
  • 31.
    Israel Market PositioningLaptops Vendors to Watch: Lenovo HP LG Toshiba DELL Local Support Sony Apple here Your Text Your Text here Worldwide Leader This analysis should be used with its supporting documents Israeli Market Presence Pini Cohen’s work Copyright 2010 @STKI Do not remove source or attribution from any graphic or portion of graphic 31
  • 32.
    Israel Market PositioningHigh-end Storage (total including MF) EMC Local Support IBM HDS Your Text here Your Text here HP This analysis should be used with its supporting documents Israeli Market Presence Pini Cohen’s work Copyright 2010 @STKI Do not remove source or attribution from any graphic or portion of graphic 32
  • 33.
    Israel Market PositioningMidrange Storage SCSI EMC Vendors to Watch: NETAPP IBM XIV N DS DataDirect Local Support Networks Your Text here HP Your Text here Midrange storage share is rising on the expenses of HDS highend storage This analysis should be used with its supporting documents Israeli Market Presence Pini Cohen’s work Copyright 2010 @STKI Do not remove source or attribution from any graphic or portion of graphic 33
  • 34.
    Israel Market PositioningGeneral Storage Solution – starting point for general use Leaders EMC NETAPP HP Local Support Your Text here IBM XIV N DS Your Text here HDS This analysis should be used with its supporting documents Israeli Market Presence Pini Cohen’s work Copyright 2010 @STKI Do not remove source or attribution from any graphic or portion of graphic 34
  • 35.
    Israel Market PositioningStorage NAS Vendors to Watch: NETAPP HDS Local Support HP Your Text here Your Text here EMC Isilon Systems This analysis should be used with its supporting documents Israeli Market Presence Pini Cohen’s work Copyright 2010 @STKI Do not remove source or attribution from any graphic or portion of graphic 35
  • 36.
    Israel Market Positioning (Enterprise Backup SW) Backup to Symantec Cloud is an option Local Support EMC Your Text here IBM Your Text here HP This analysis should be used with its supporting documents Israeli Market Presence Pini Cohen’s work Copyright 2010 @STKI Do not remove source or attribution from any graphic or portion of graphic 36
  • 37.
    Market Status andRecommendations Users are using these integrators (support, maintenance) in ESM – Enterprise System Management BSM CMDB: HP Malam-Team Matrix CA Your Text here Your Text here Aman Yana (Maraton) IBM Ness Pini Cohen’s work Copyright 2010 @STKI Do not remove source or attribution from any graphic or portion of graphic 37 37
  • 38.
    Market Status andRecommendations  Users are using these integrators (support, maintenance) in DBMS open area: Oracle  Veracity  Glasshouse  Priority Text here Many smallgood integrators Your Text here Your in this area  ACS  Matrix  Microsoft  IBM  Malam-Team many other exist Pini Cohen’s work Copyright 2010 @STKI Do not remove source or attribution from any graphic or portion of graphic 38
  • 39.
    Market Status andRecommendations Users are using these integrators (support, maintenance) in Servers-Platform Open area: HP TEAMMalam EMET IBM Your Text here Your Text here WE Harel Bynet PenguinIT CCC Pini Cohen’s work Copyright 2010 @STKI Do not remove source or attribution from any graphic or portion of graphic 39
  • 40.
    Market Status andRecommendations Users are using these integrators (support, maintenance) in Clients area: One1 Malam-Team Taldor Calanit )excellence in migration projects) Text here Your Text here Your Dorcom Omnitech HP Matrix Hayun Pini Cohen’s work Copyright 2010 @STKI Do not remove source or attribution from any graphic or portion of graphic 40
  • 41.
    Market Status andTrends Survey has shown that these integrators are used: (providers – from service point of view) in Storage area: EMC Netapp Text here Your Your Text here HDS IBM Malam-Team Ankor Glasshouse HP WE Pini Cohen’s work Copyright 2010 @STKI Do not remove source or attribution from any graphic or portion of graphic 41
  • 42.
    Market Status andTrends Survey has shown that these integrators are used: (providers – from service point of view) in backup area: GlassHouse IBM HP Your Text here Your Text here Emet Pini Cohen’s work Copyright 2010 @STKI Do not remove source or attribution from any graphic or portion of graphic 42
  • 43.
    Selected ESM productsand integrators Selected products and Integrators Team Matrix / Malam Yana IGS Tangram Ness Netcom AMAN CCC Bynet Techmind (Maraton) HeadON WE Ticomsoft Ludan SecureTeam In2it CA x x x x Tivoli x x x x (netcool) x x x x Your Text here Your Text here HP x x x BMC x x Pini Cohen’s work Copyright 2010 @STKI Do not remove source or attribution from any graphic or portion of graphic 43
  • 44.
    Storage Selected Vendorsand SI’s in Israel T EAM / Malam/ Bezeq omnitech/ Glass Int. ANKOR netcom WE House CCC Matrix Bynet EMET ONE1 T aldor Benefit Harel ELAD EMC x x x x x x x X x IBM x x x x x x x x x HP x Your Text here x x Your Text here x NETAPP x x x x x x x x HDS x x x Fujistu x Pini Cohen’s work Copyright 2010 @STKI Do not remove source or attribution from any graphic or portion of graphic 44
  • 45.
    Selected Vendors andSI’s in Israel – Enterprise B/R SW Glass Team Real Vendor EMET House Malam CCC Matrix Y ael Network ANKOR New Age Dorcom WE HP DP x x x x EMC Legato x Symantec (NB) Text here Your x x x x x Your Textx x here IBM TSM X x x Pini Cohen’s work Copyright 2010 @STKI Do not remove source or attribution from any graphic or portion of graphic 45