Downloaded 166 times
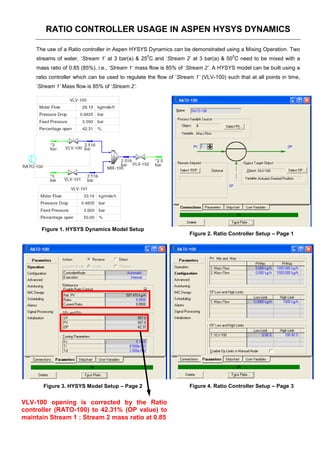
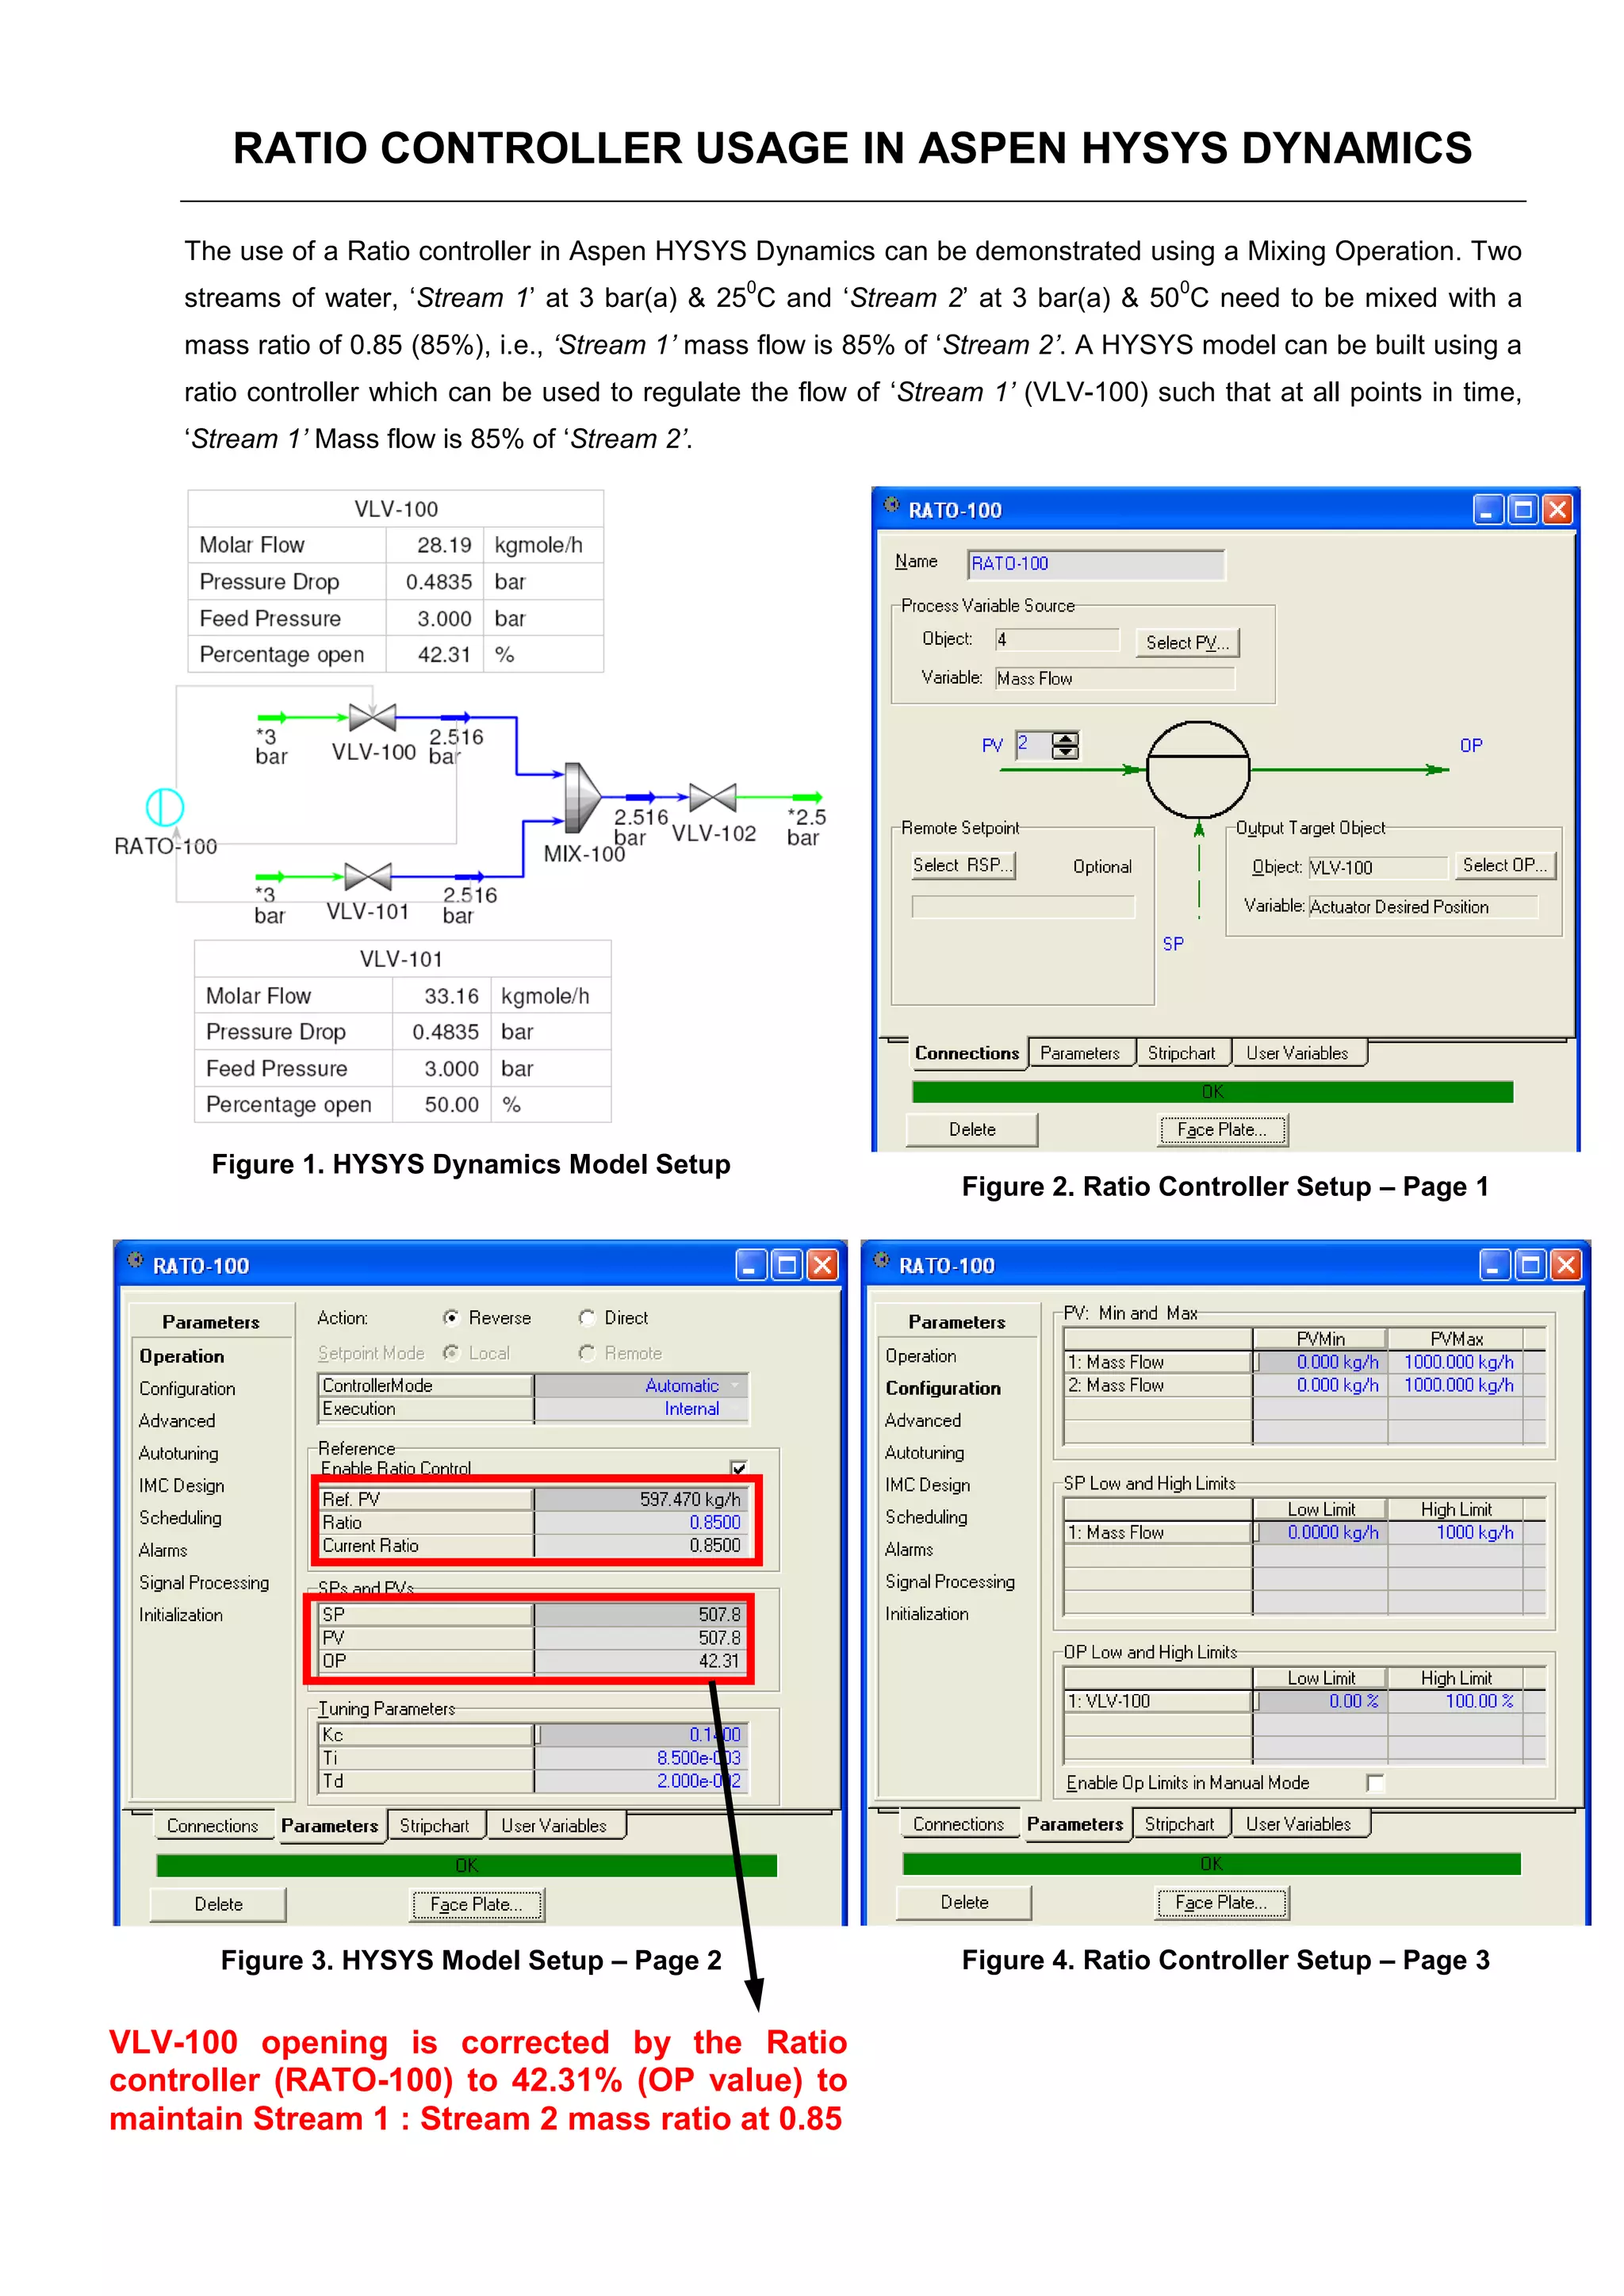

The document describes the implementation of a ratio controller in Aspen Hysys dynamics for a mixing operation involving two water streams. It outlines a model where the mass flow of 'stream 1' is regulated to be 85% of 'stream 2' using a ratio controller. The required adjustments to maintain this ratio are demonstrated through specific control settings within the Hysys model.


