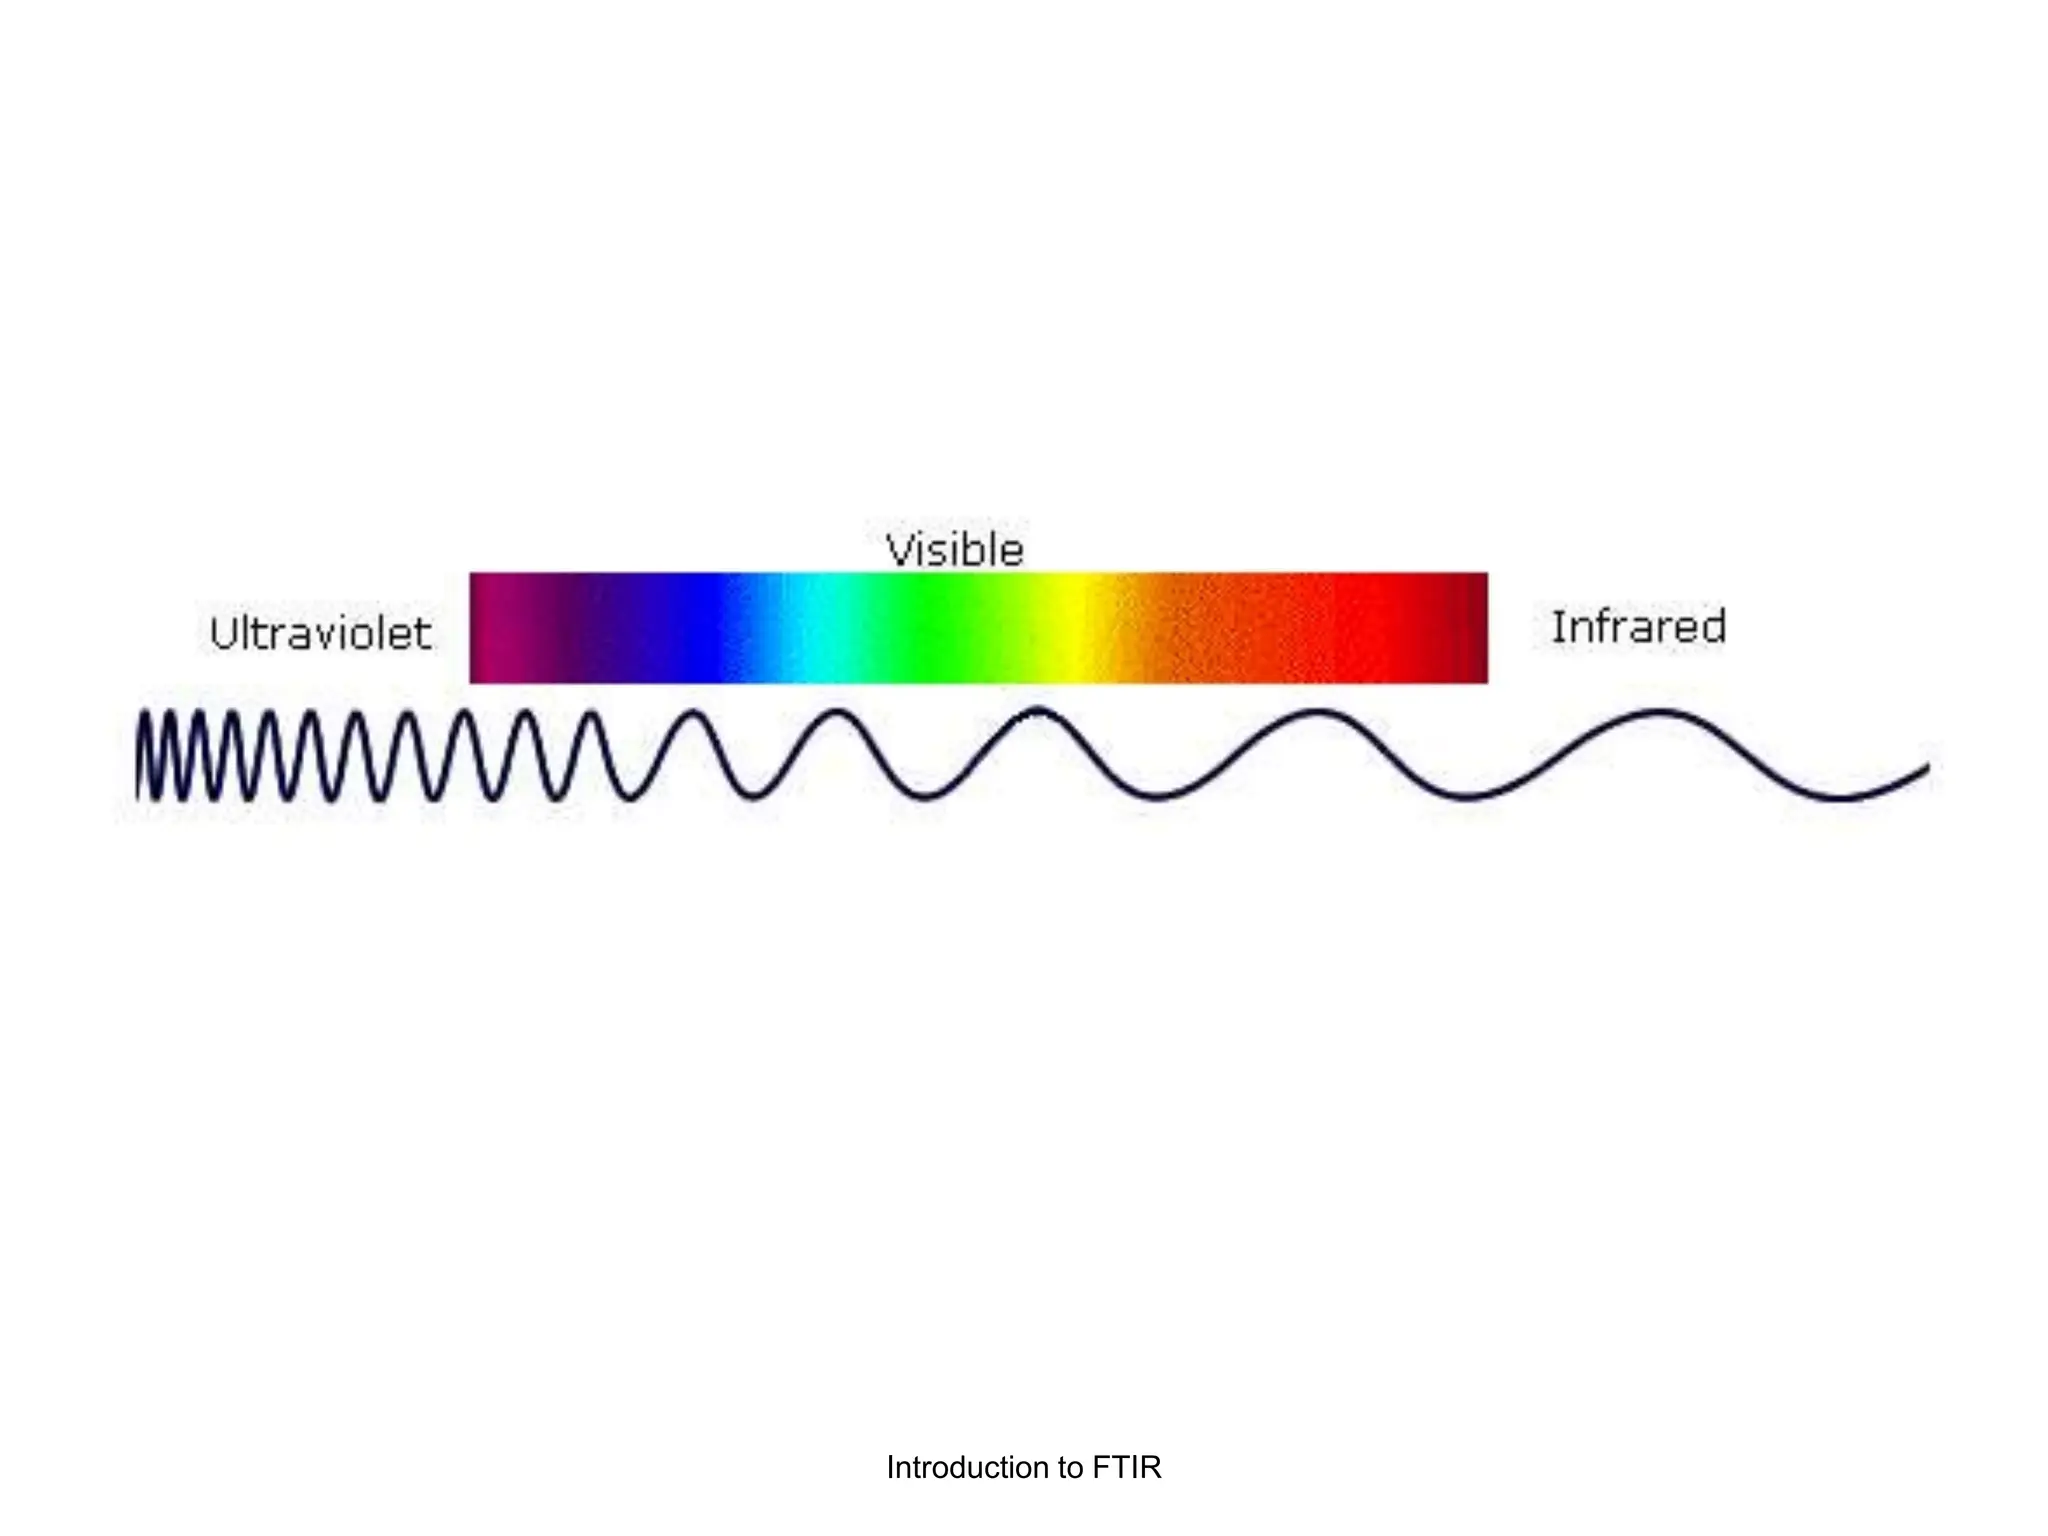
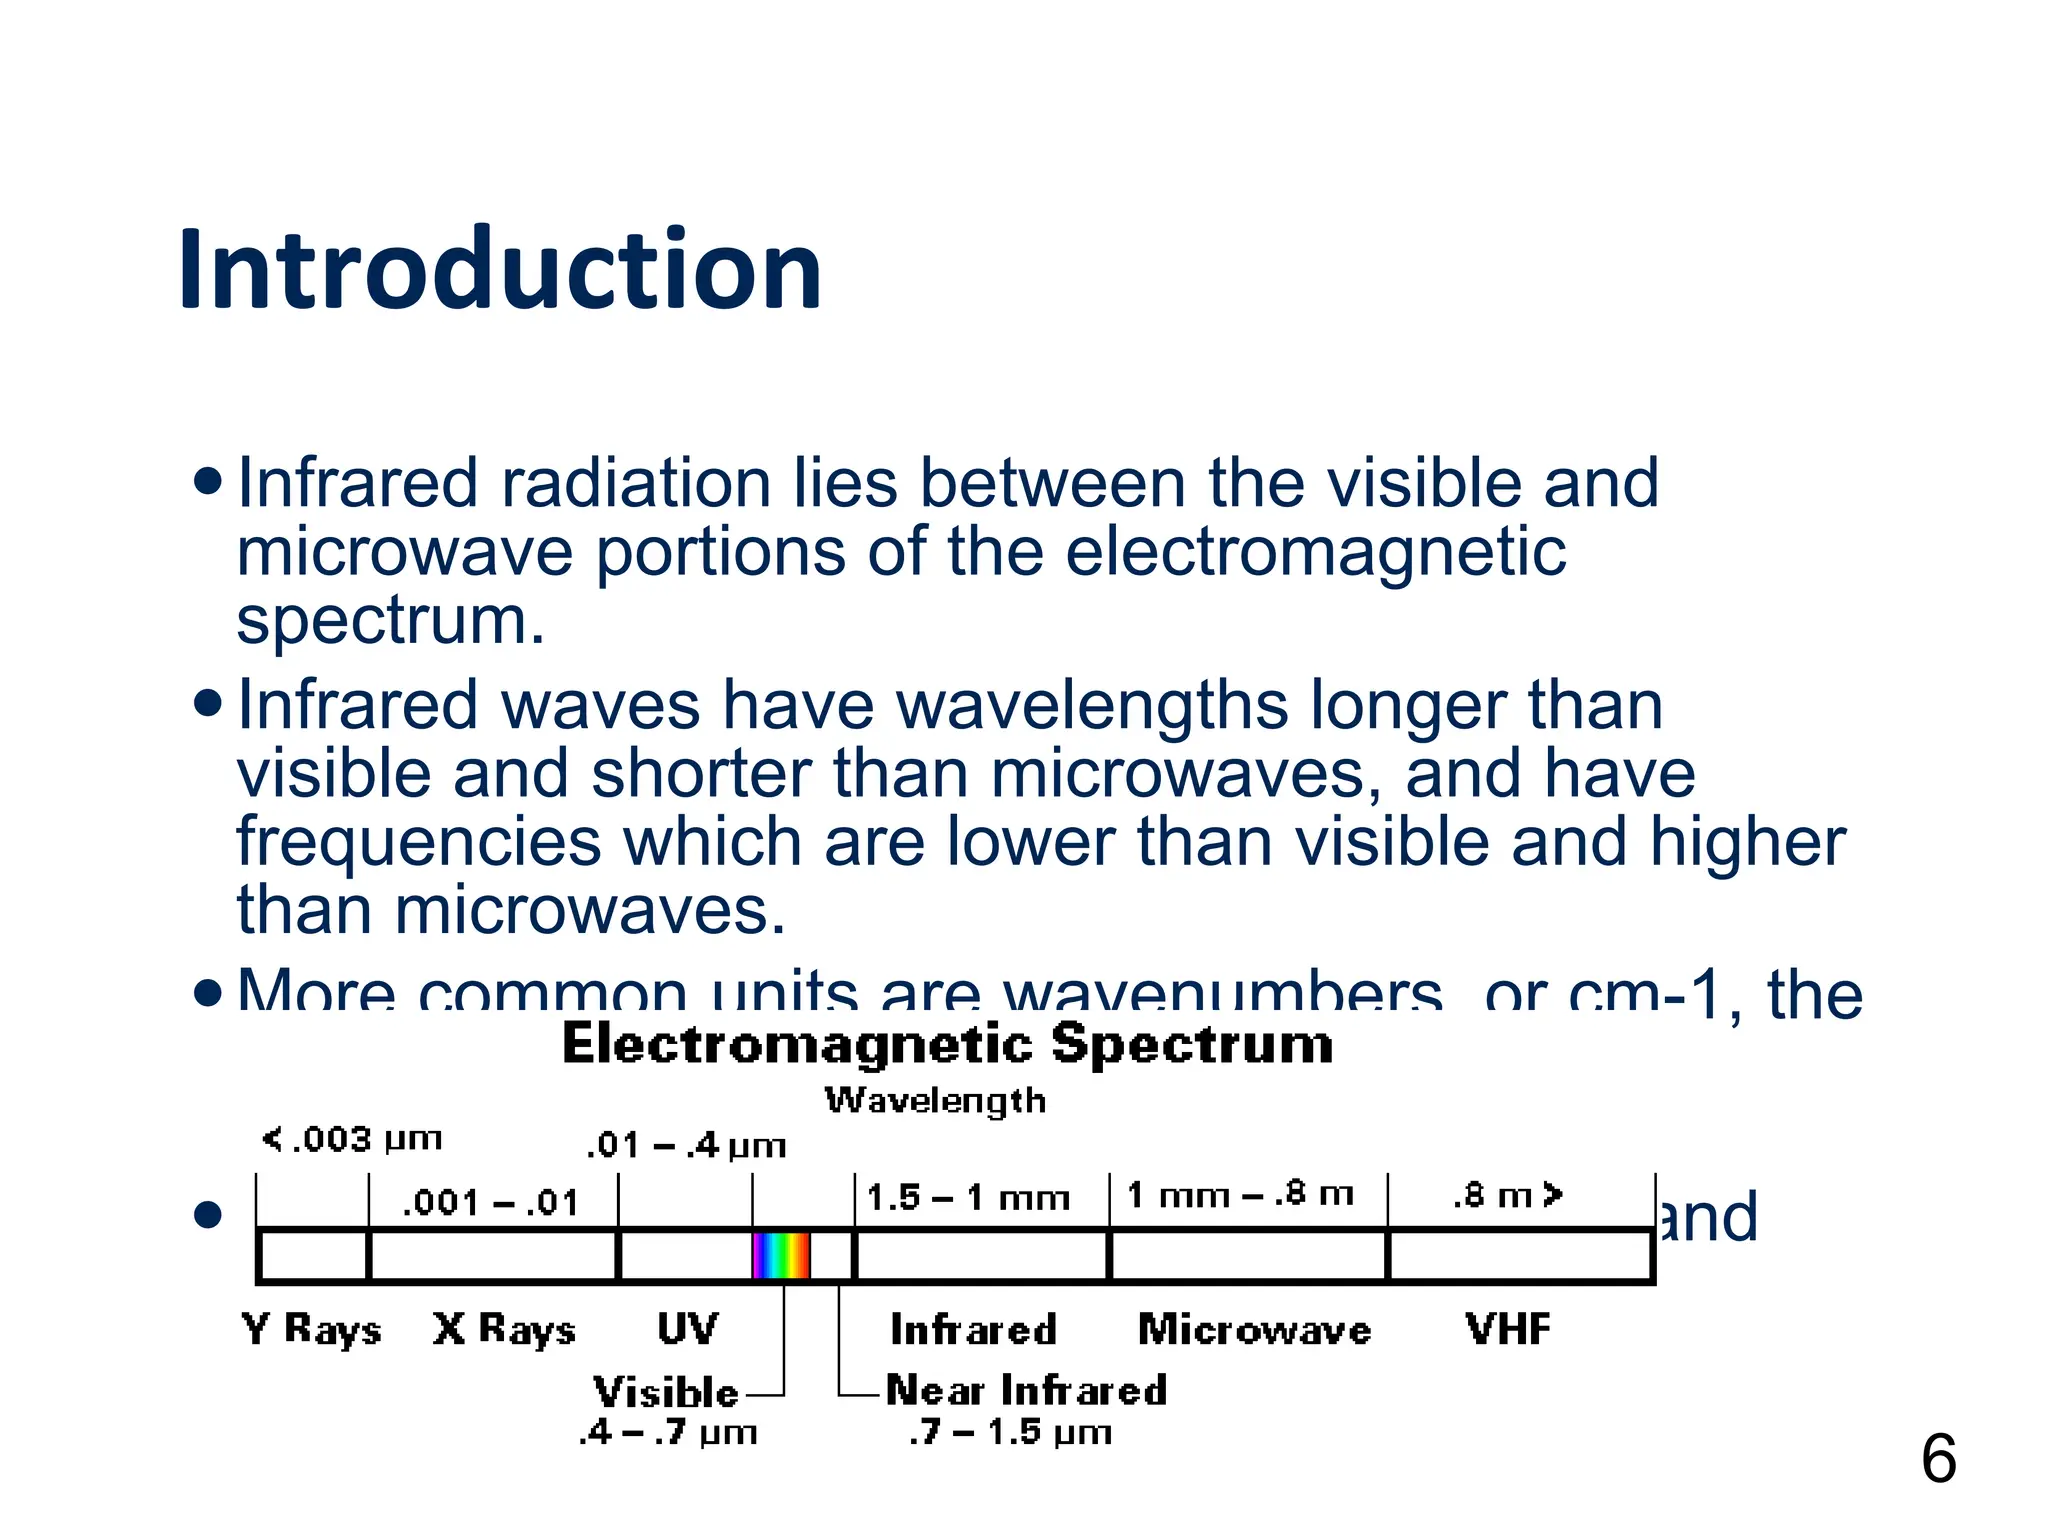
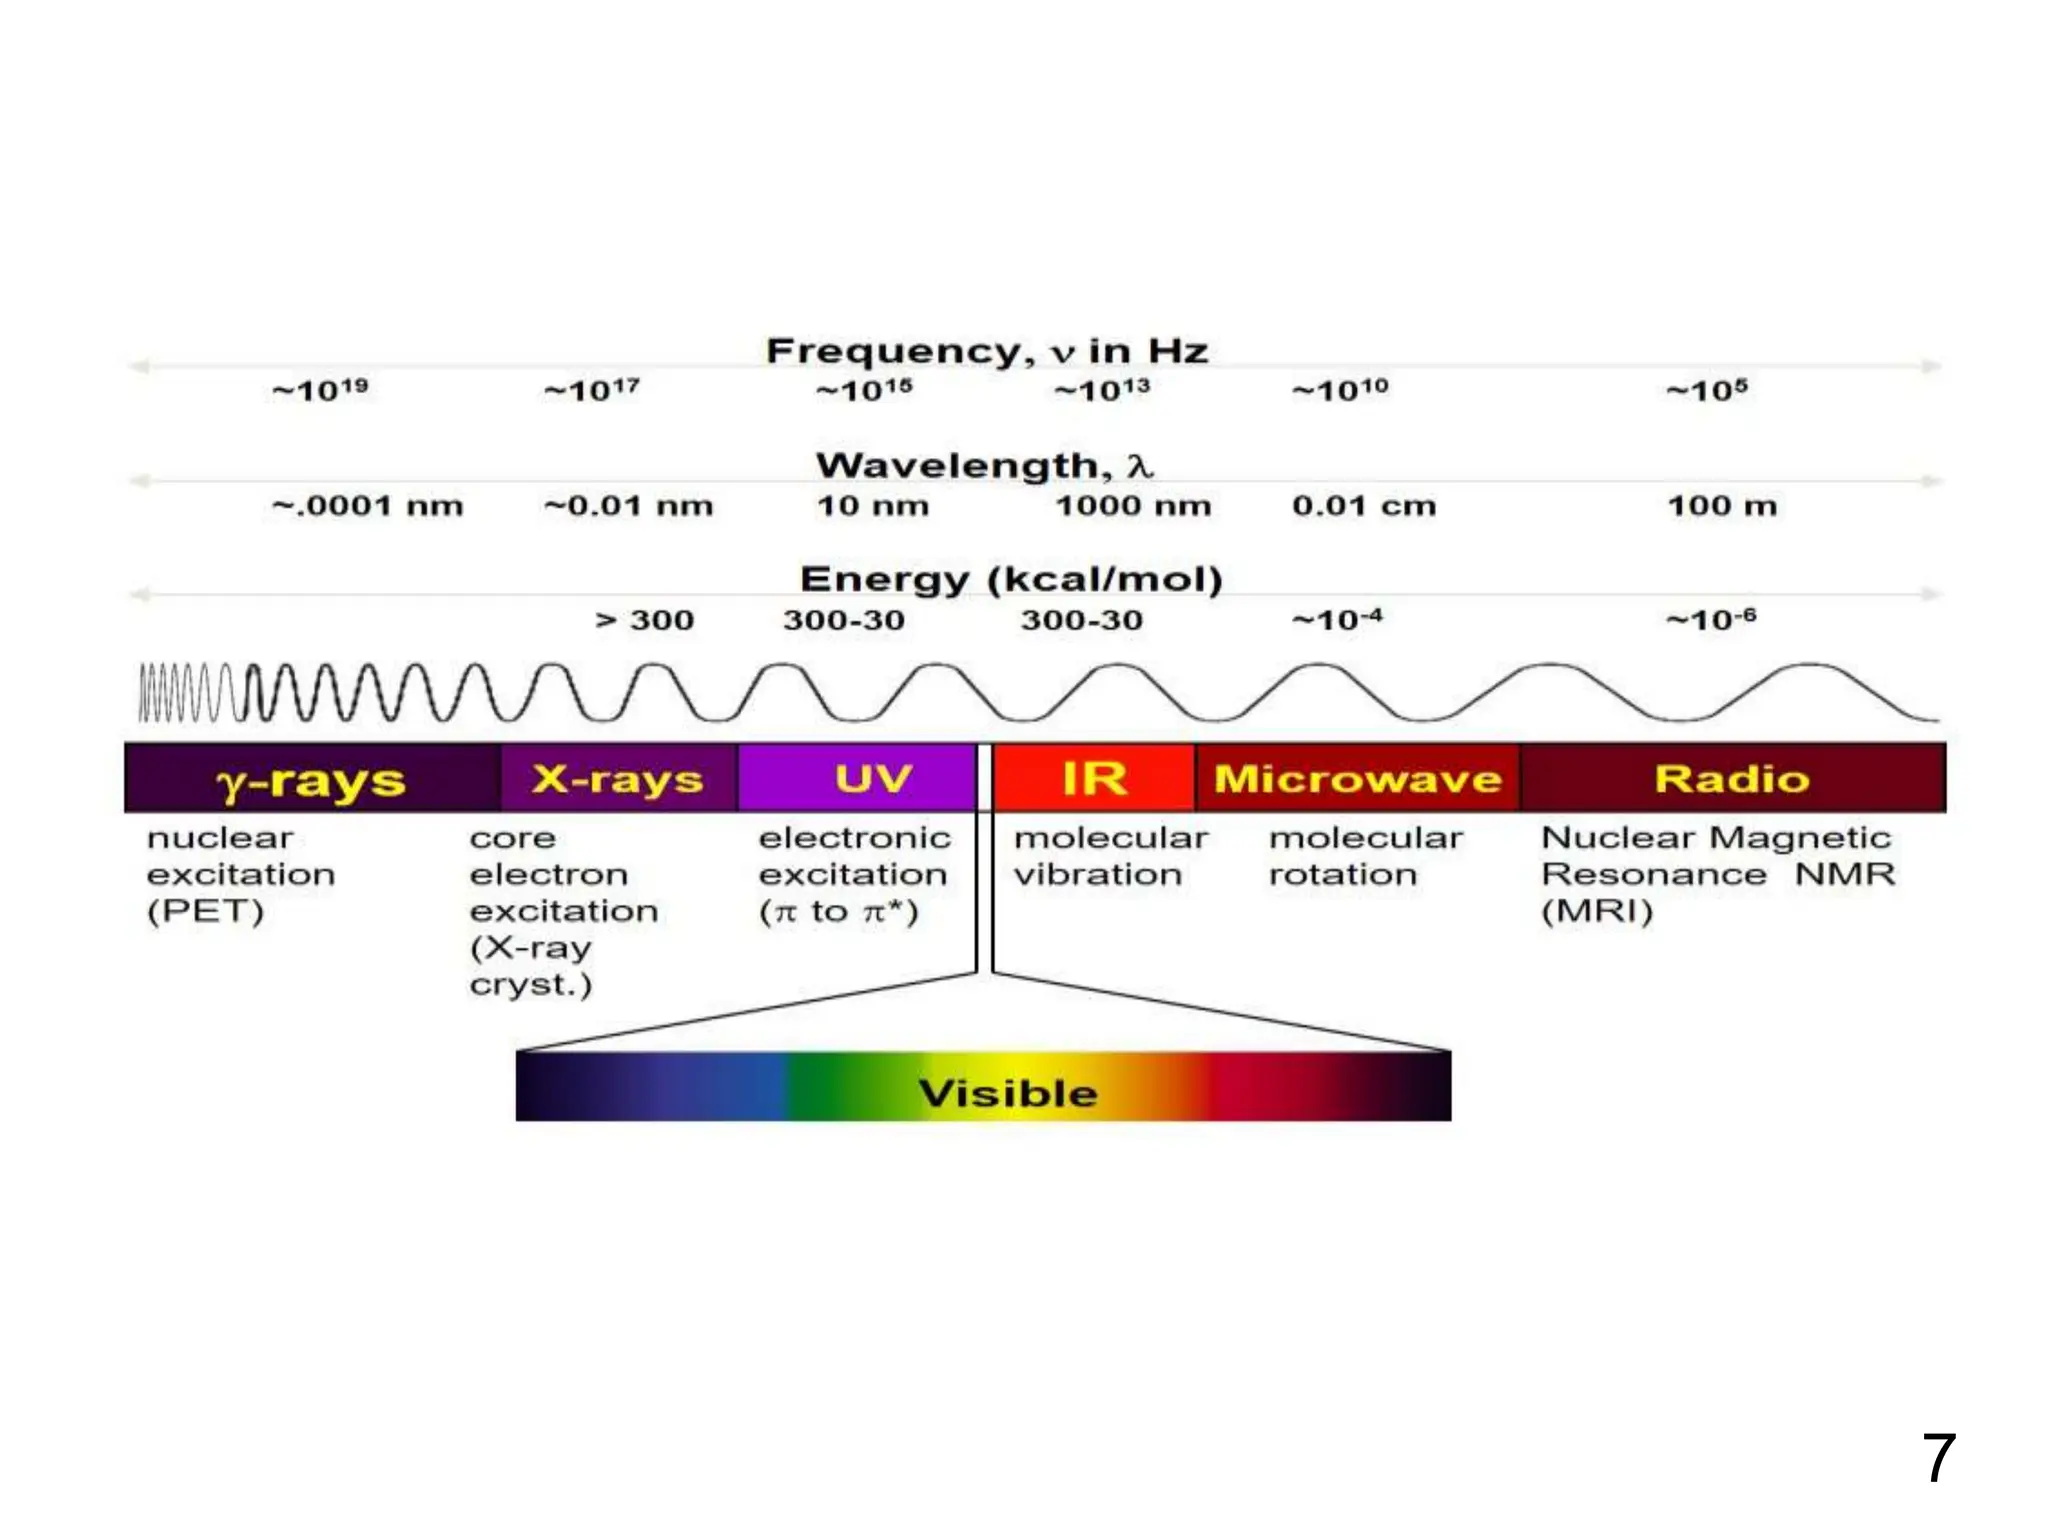
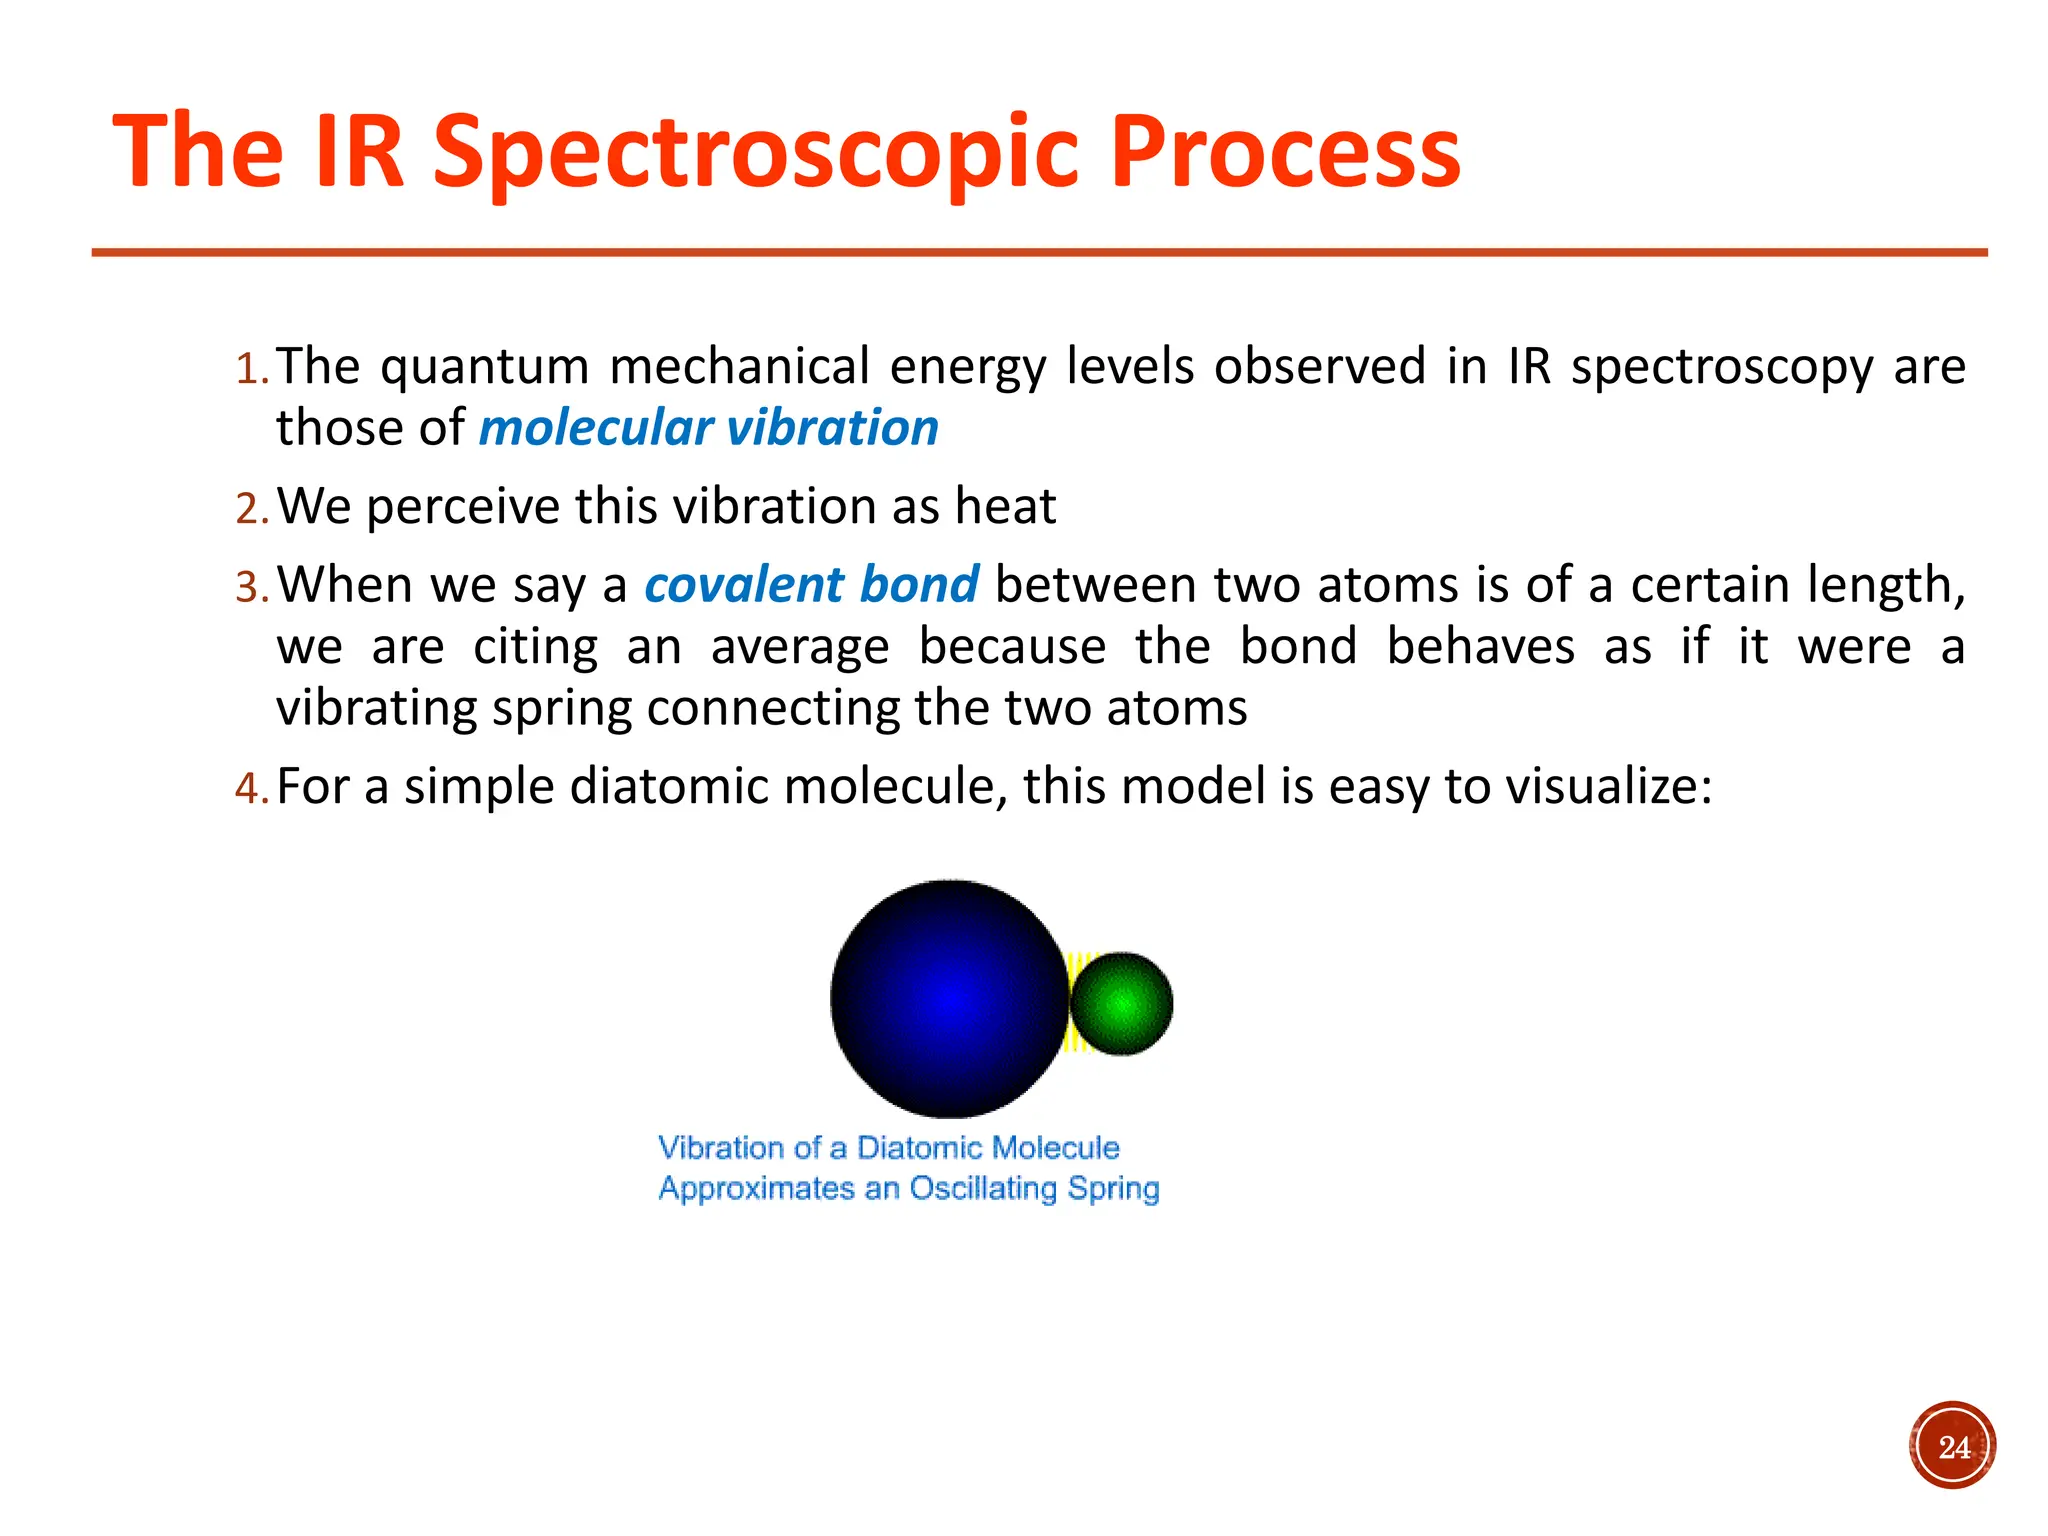
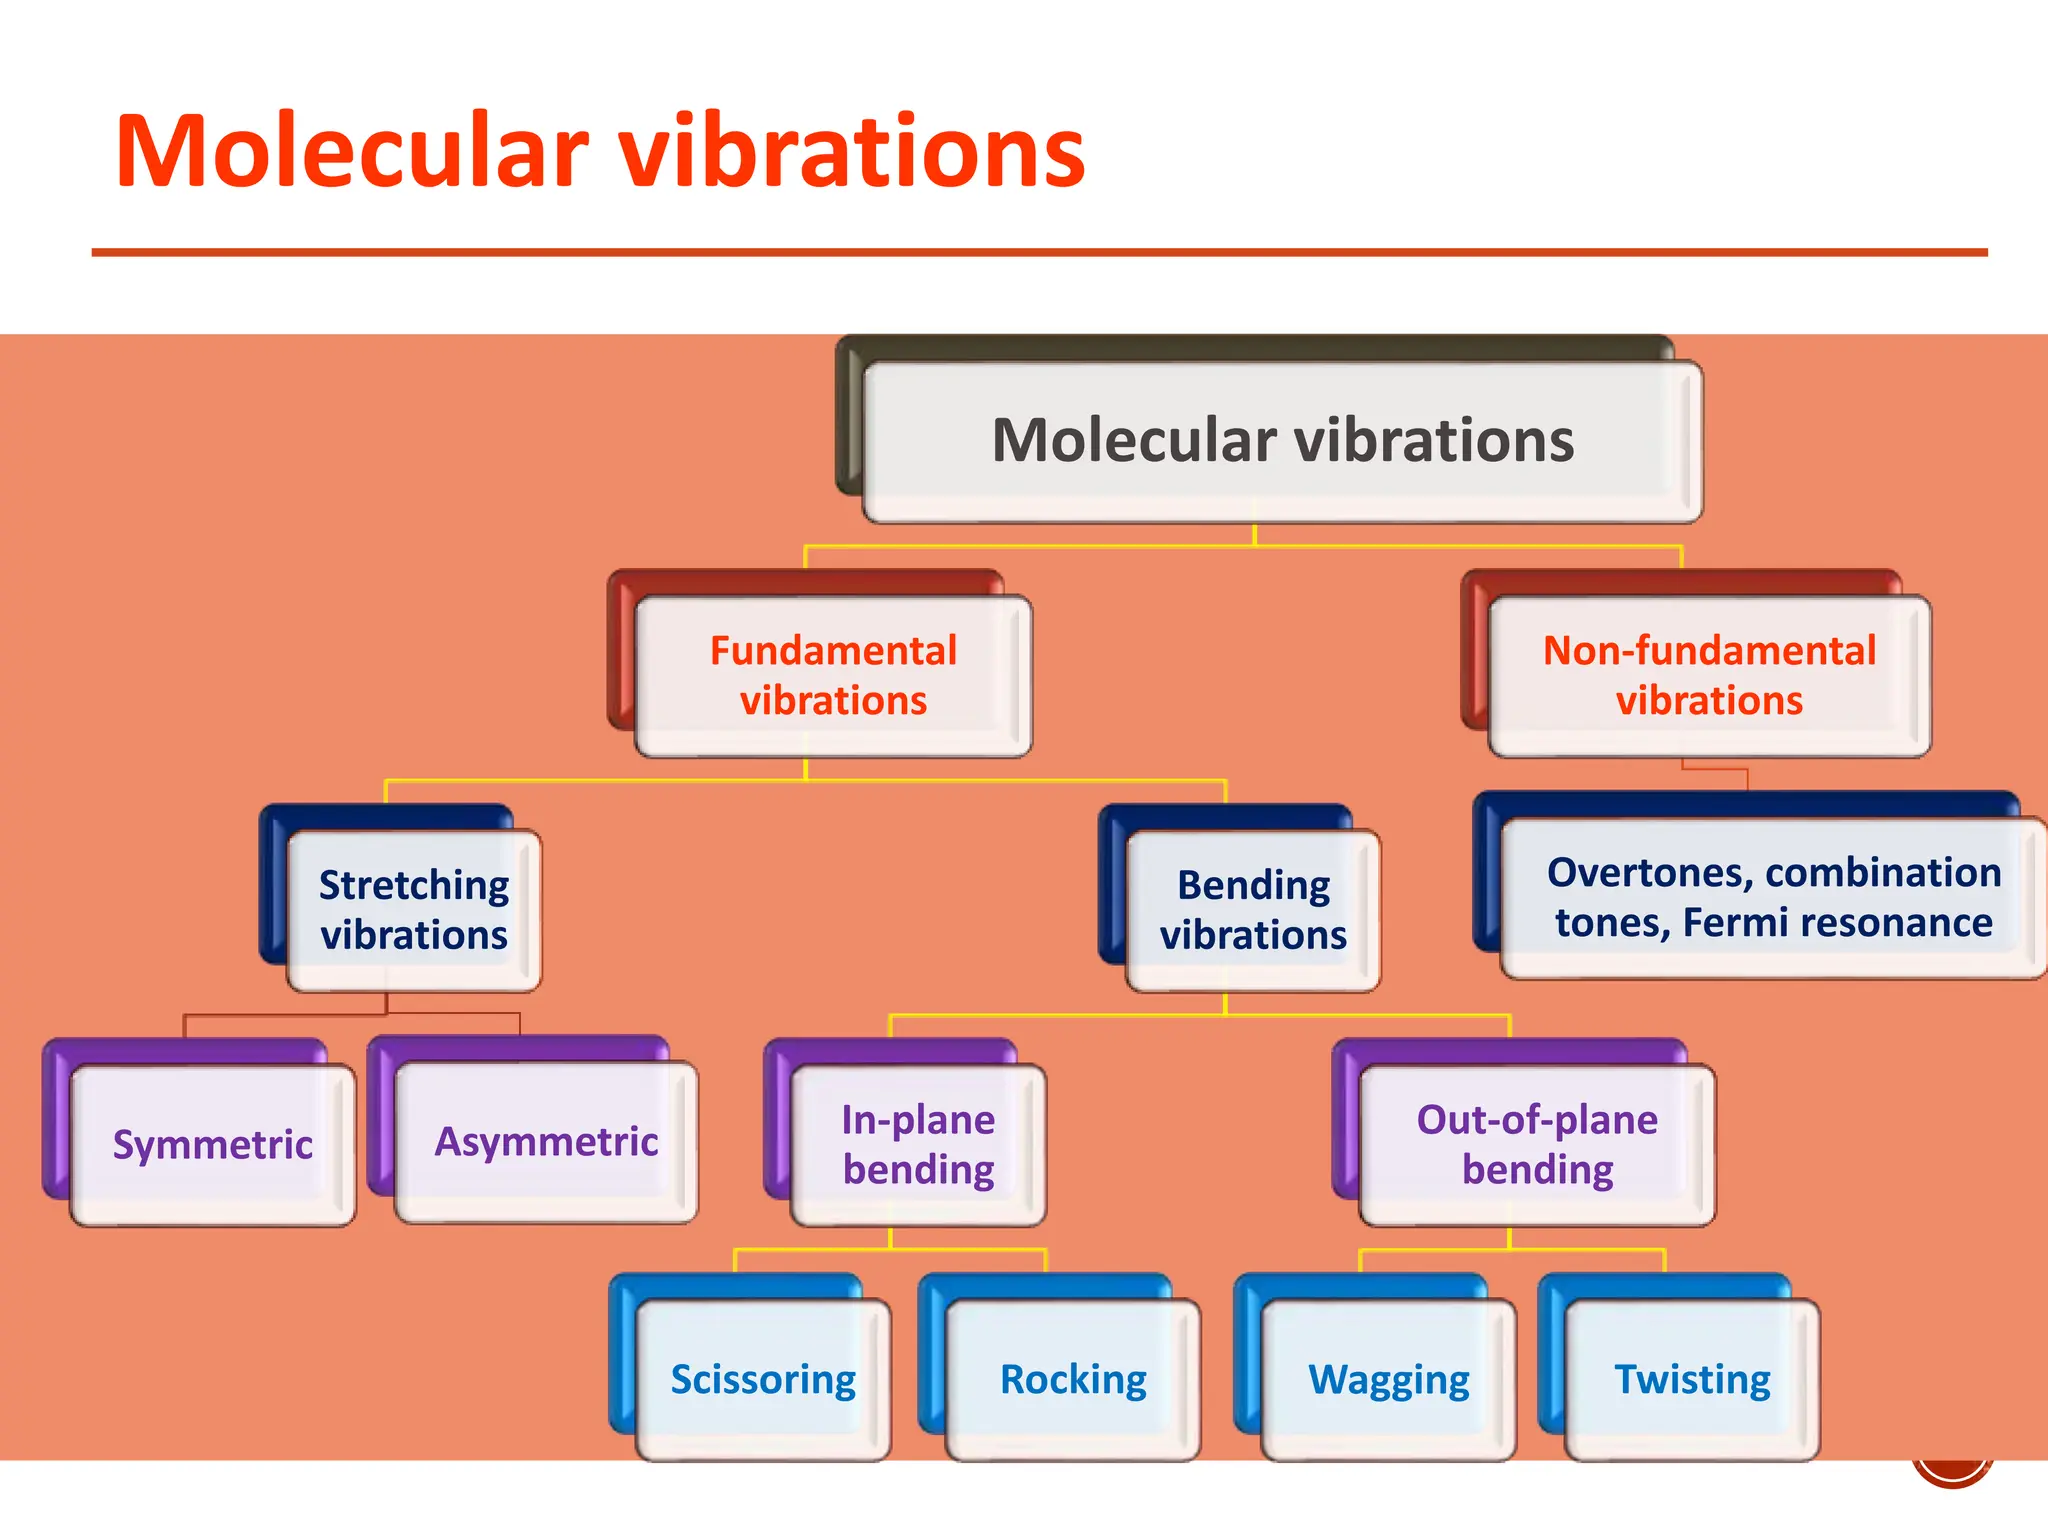
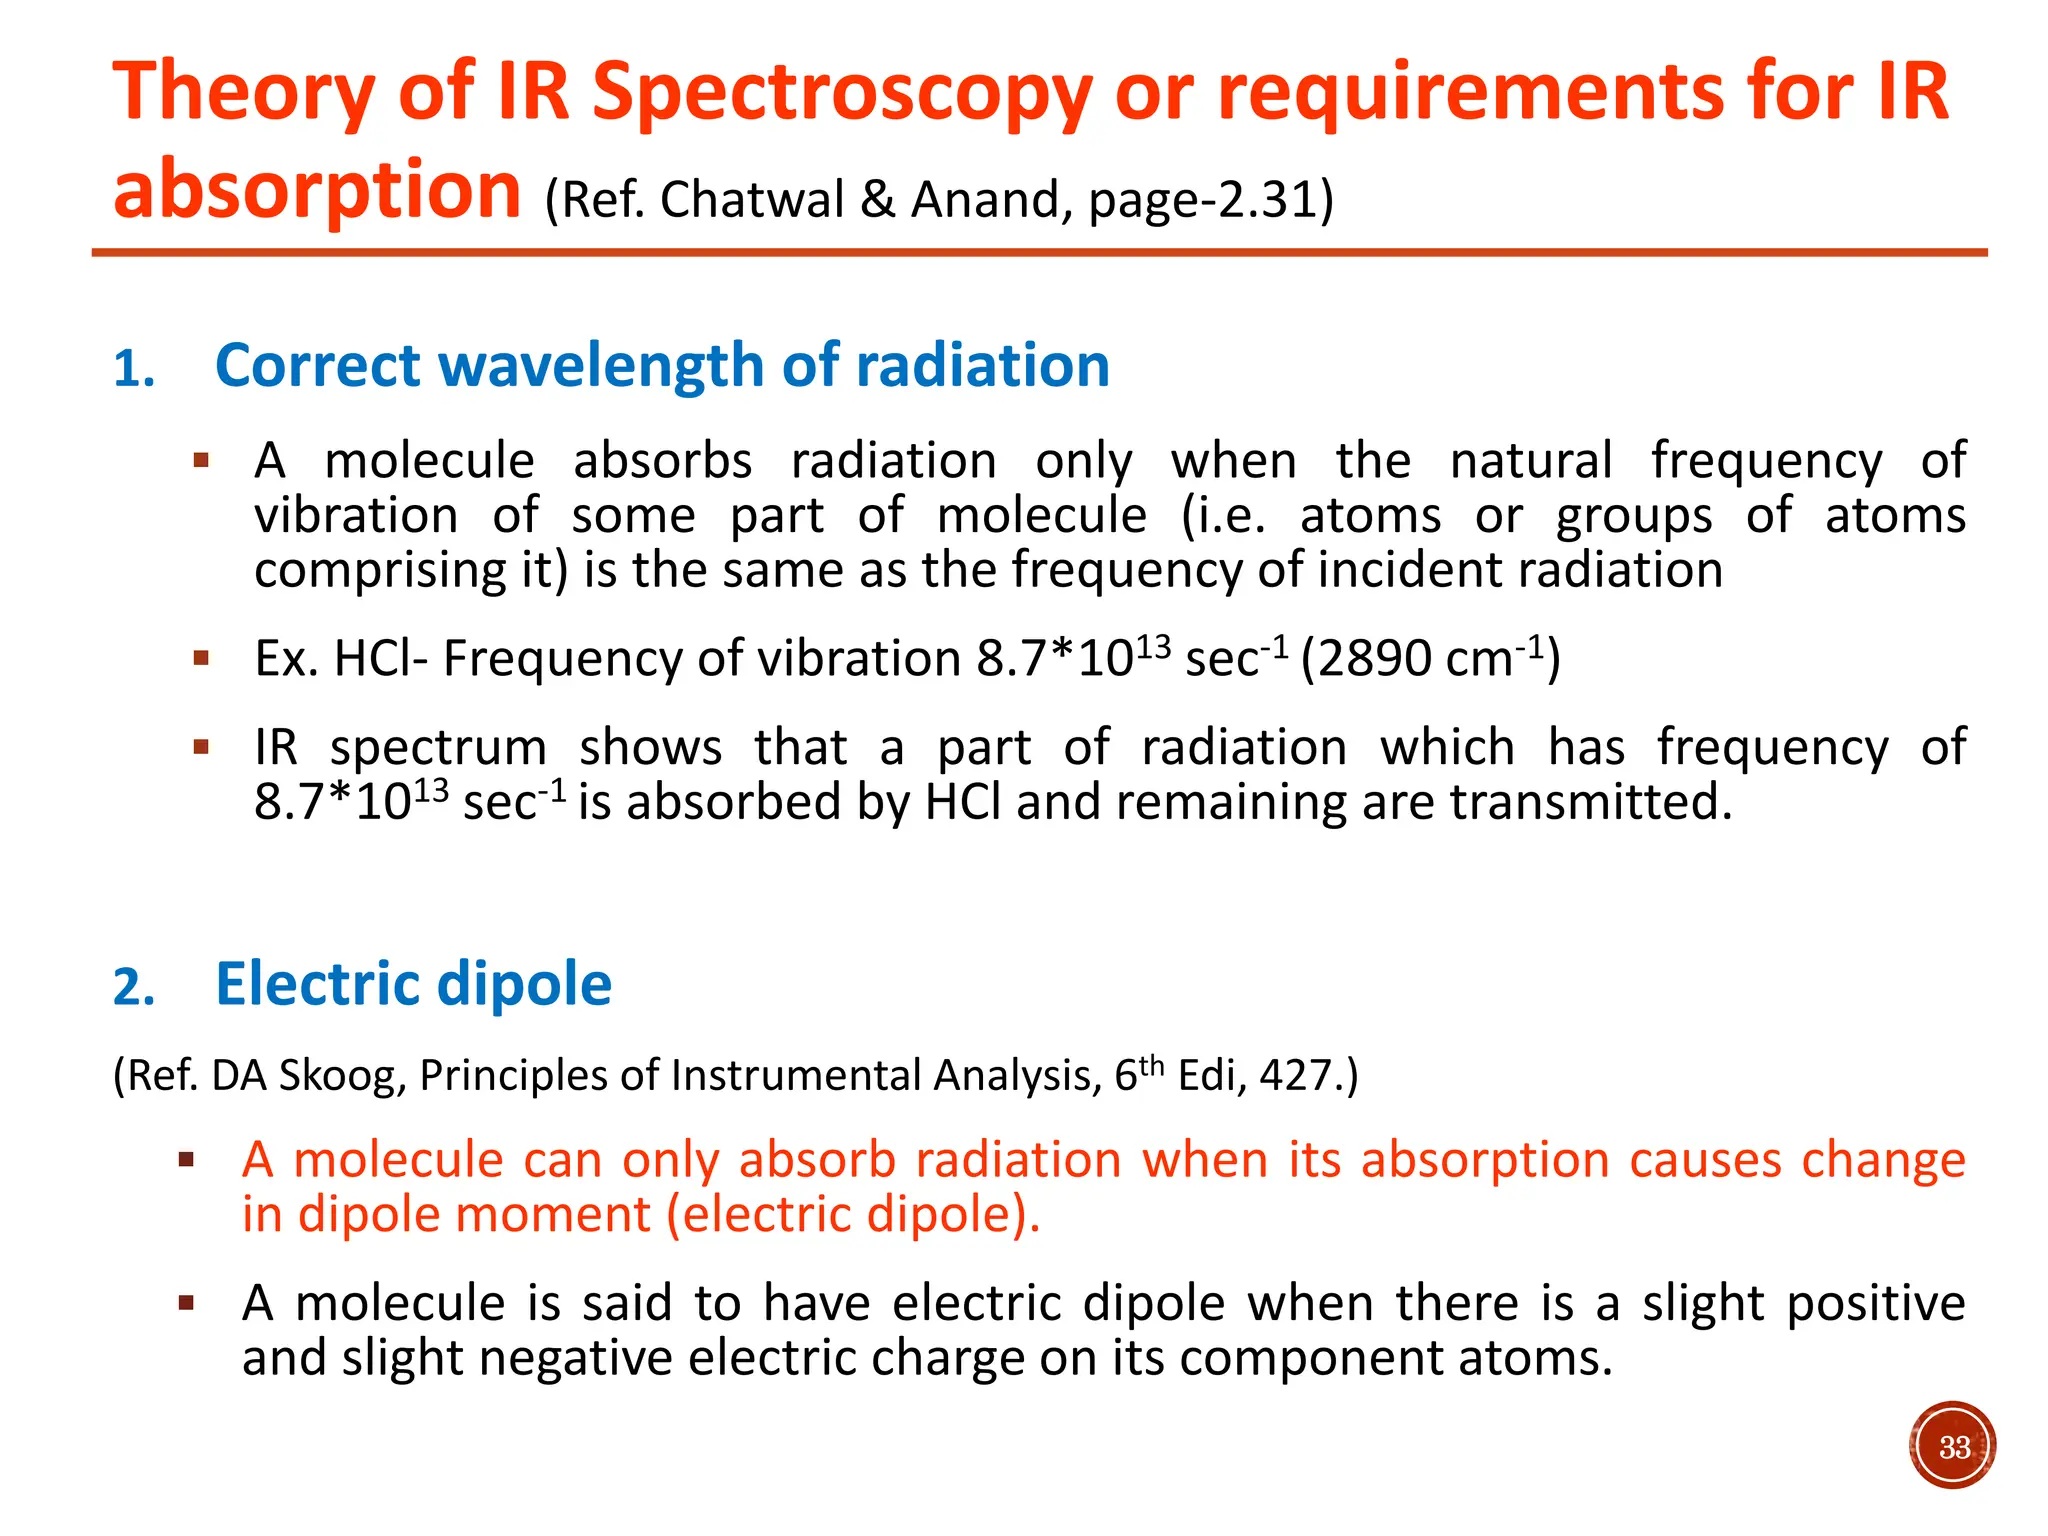
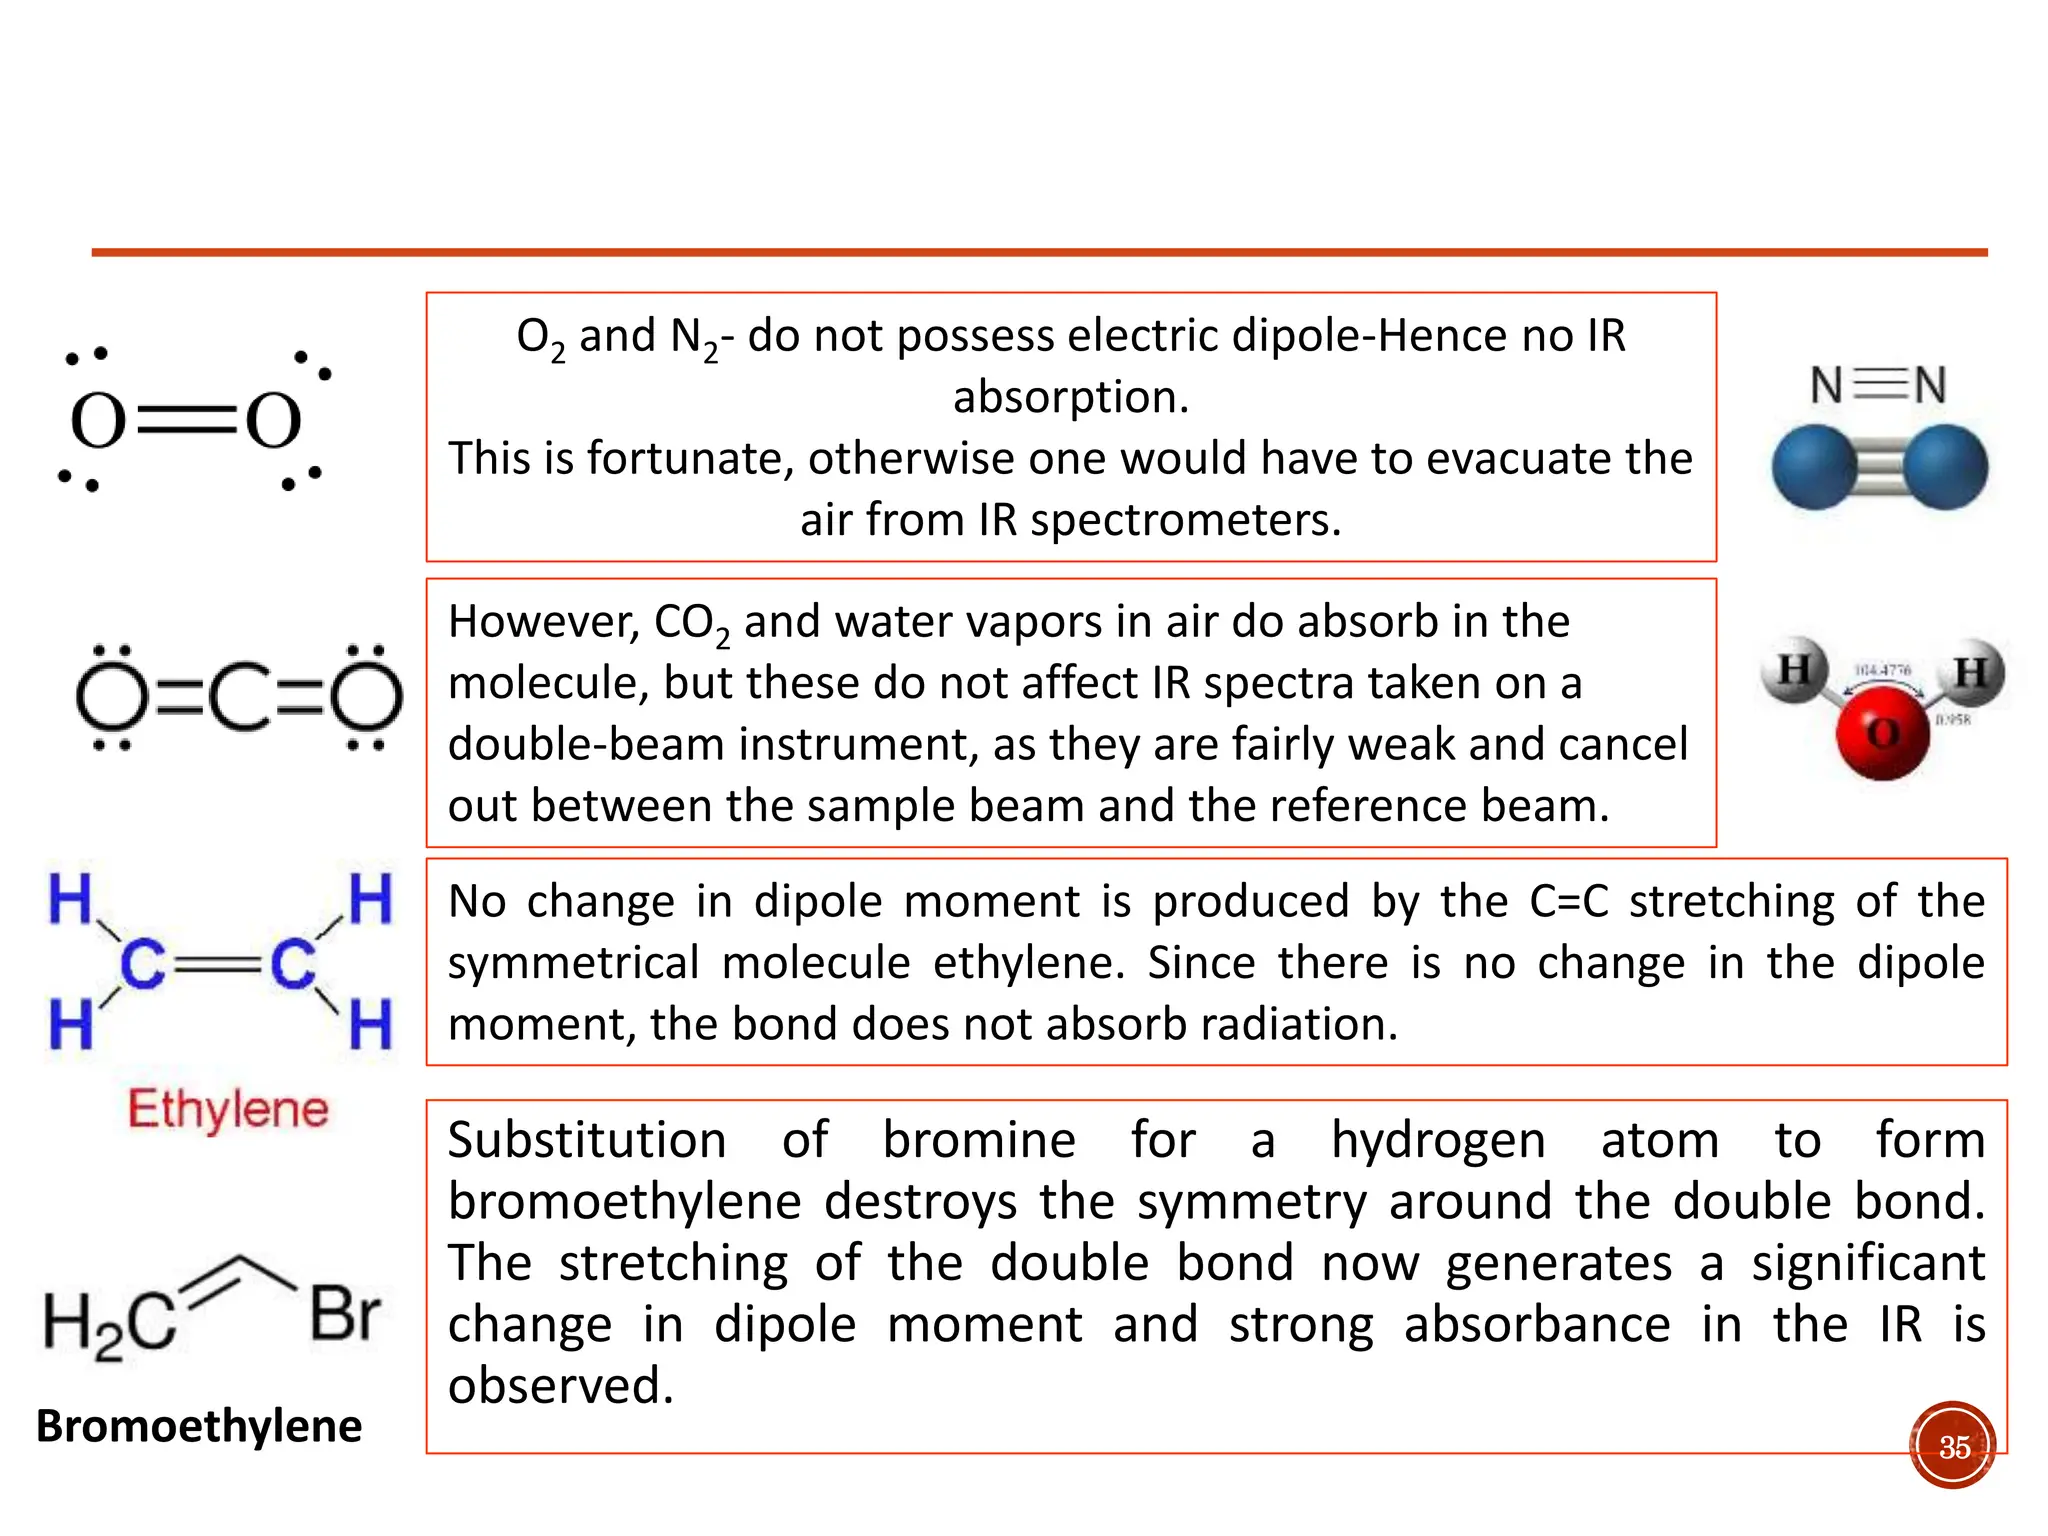
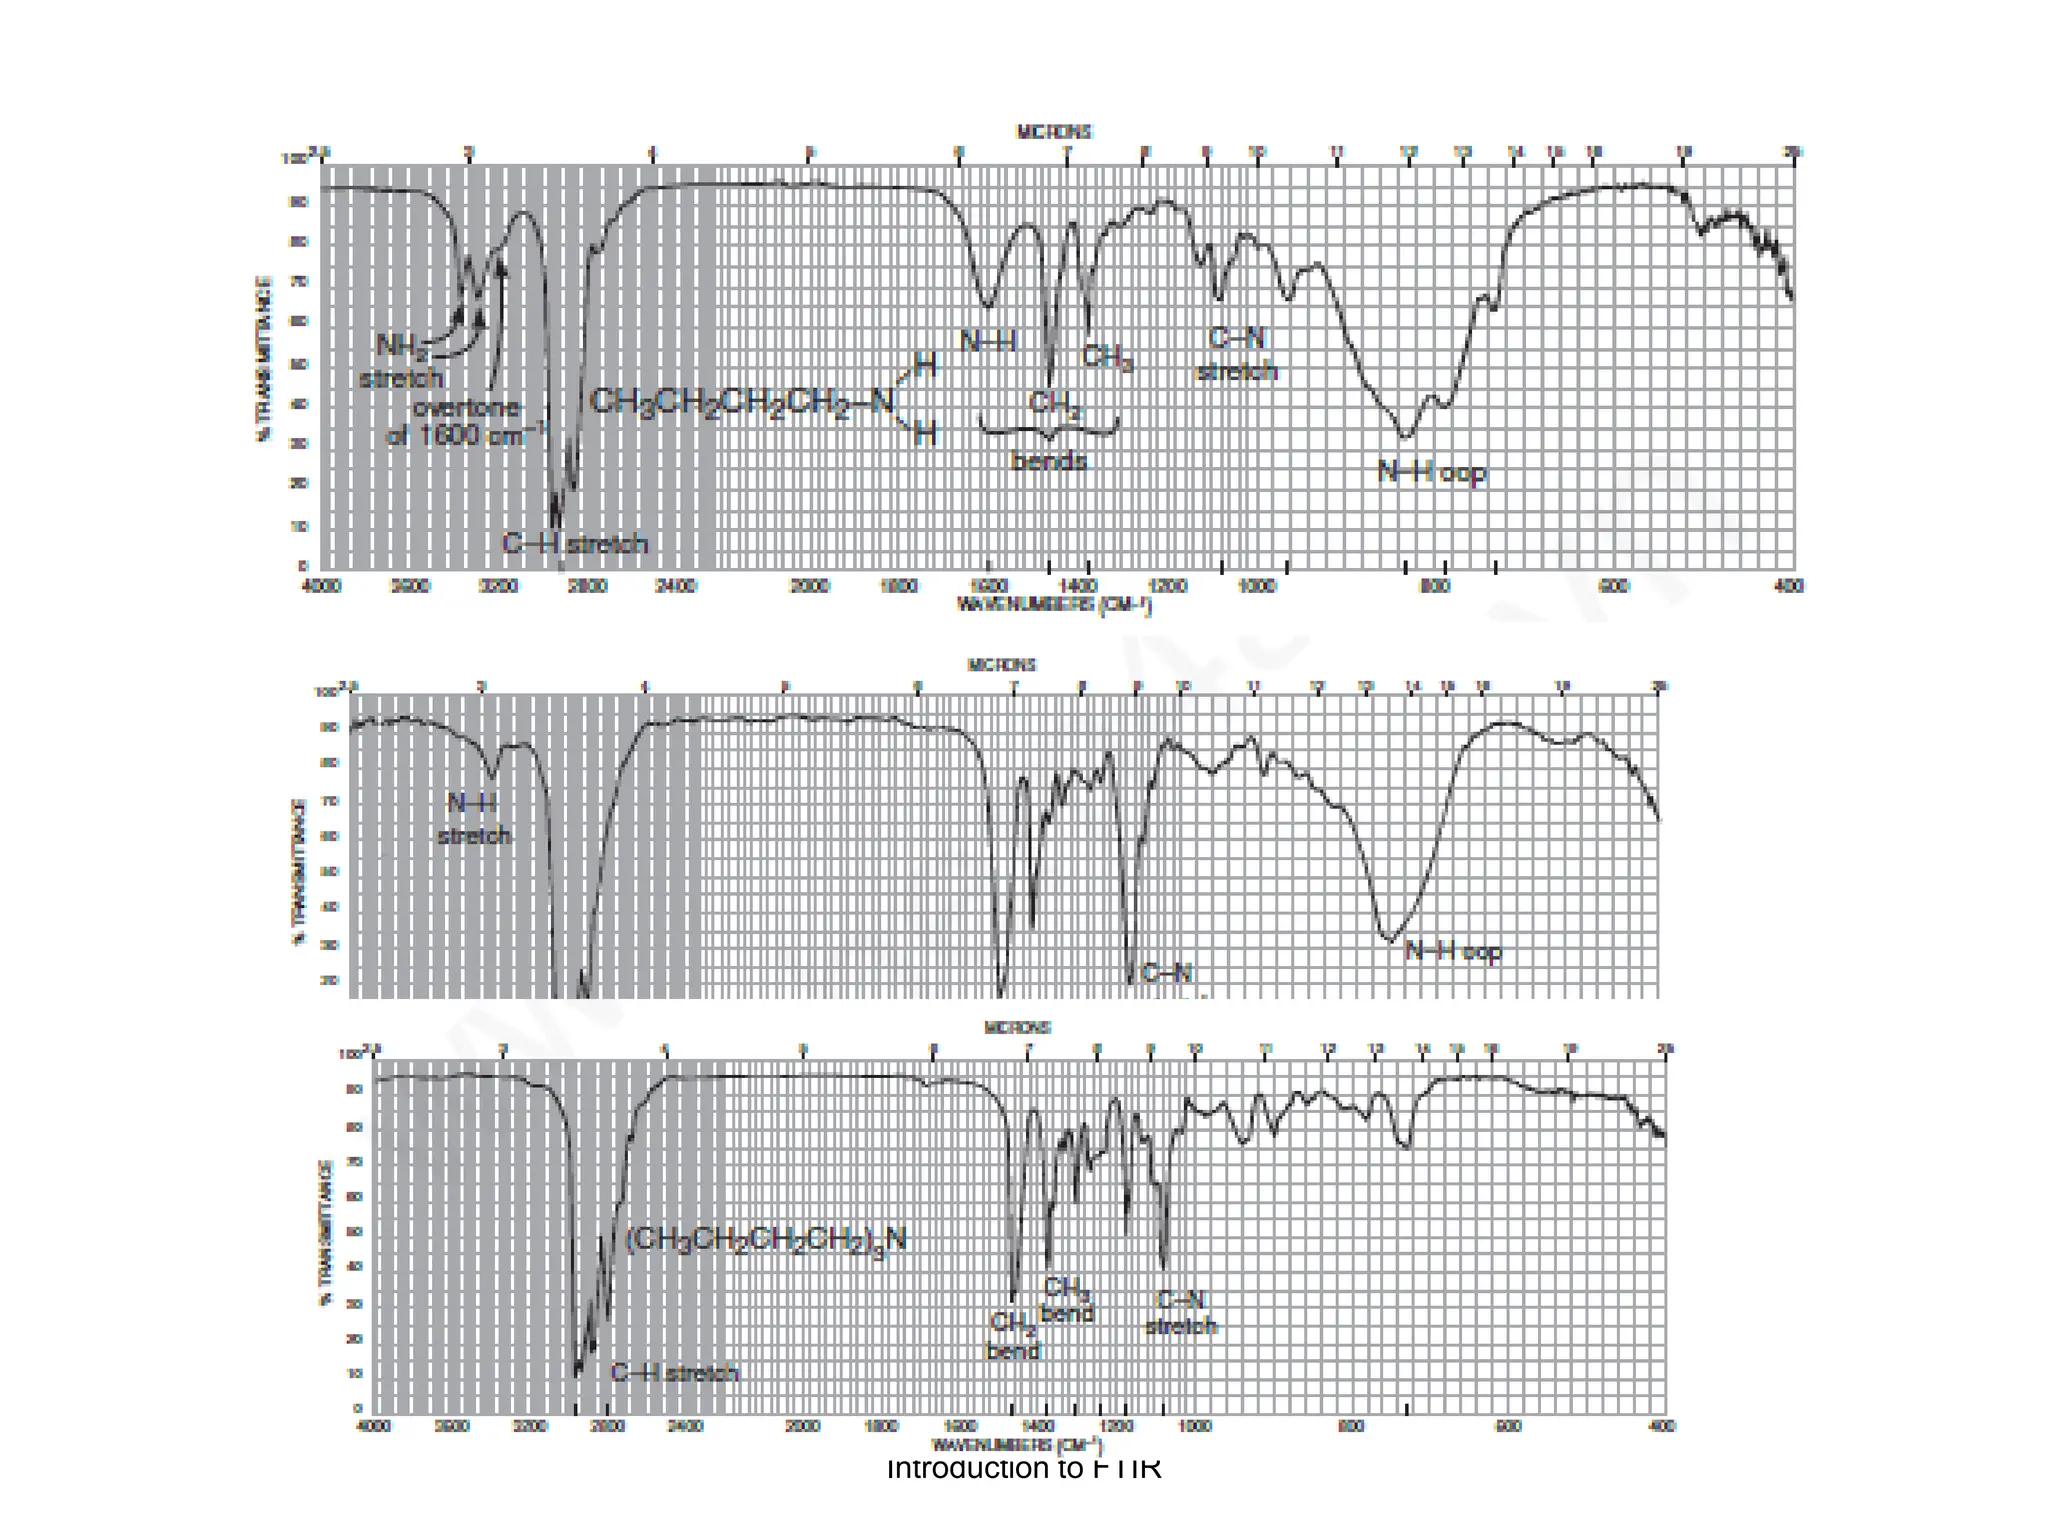
Infrared spectroscopy measures the absorption of infrared radiation by molecules to determine their structure. Infrared radiation excites molecular vibrations in covalent bonds. For a vibration to be infrared active, it must induce a change in the dipole moment of the molecule.
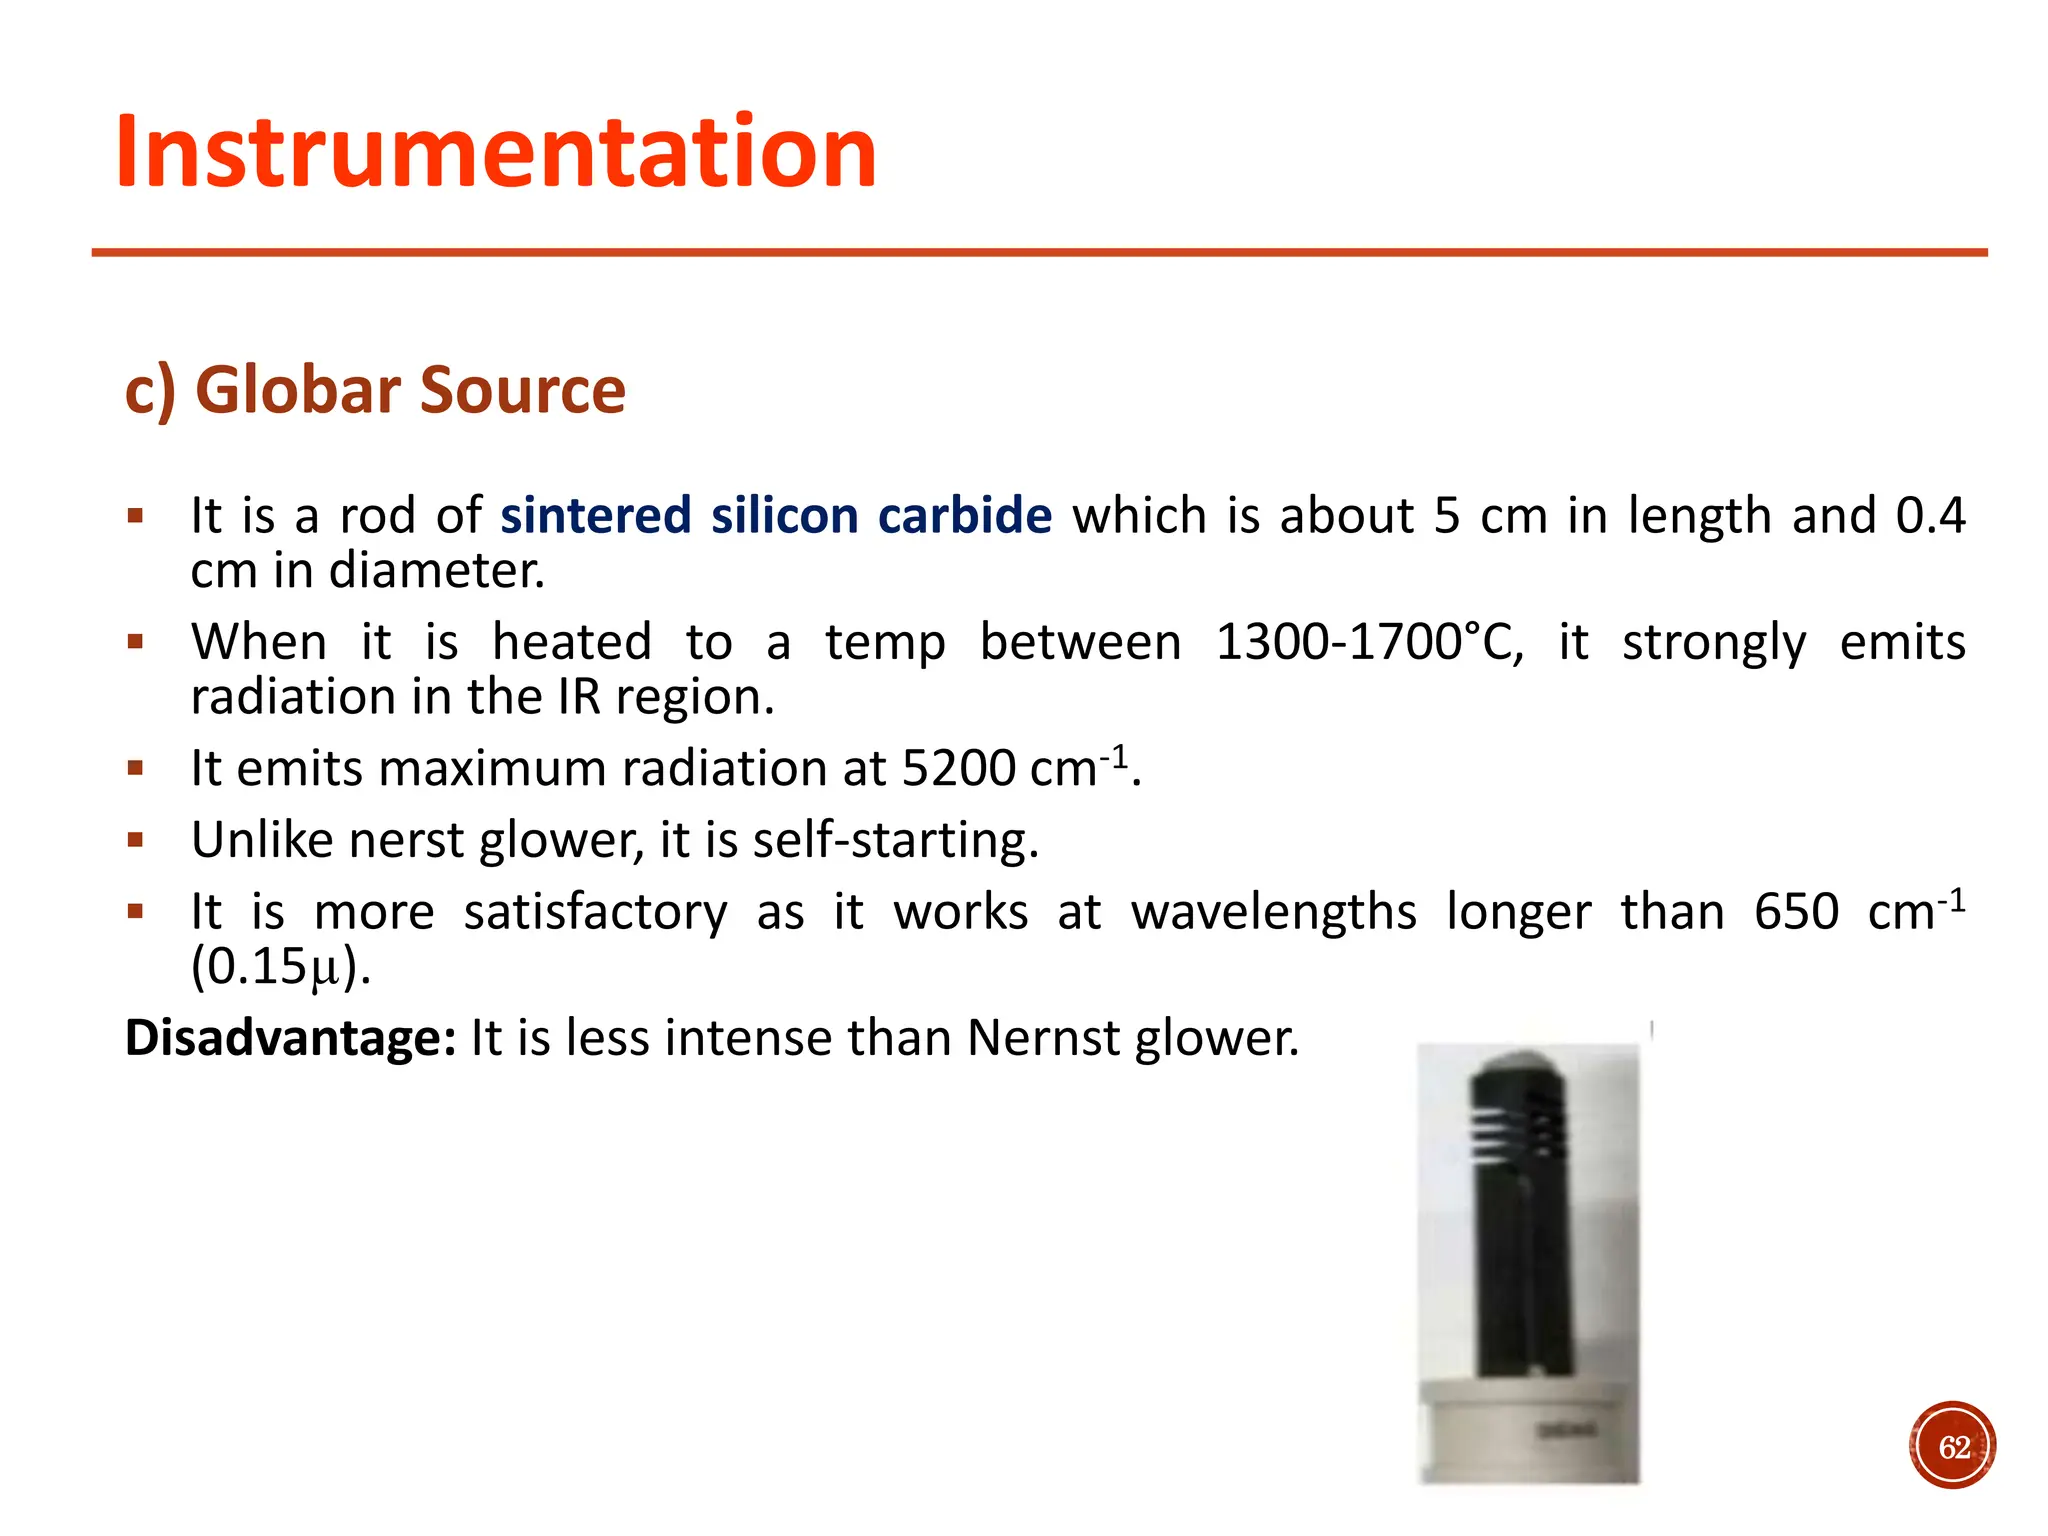
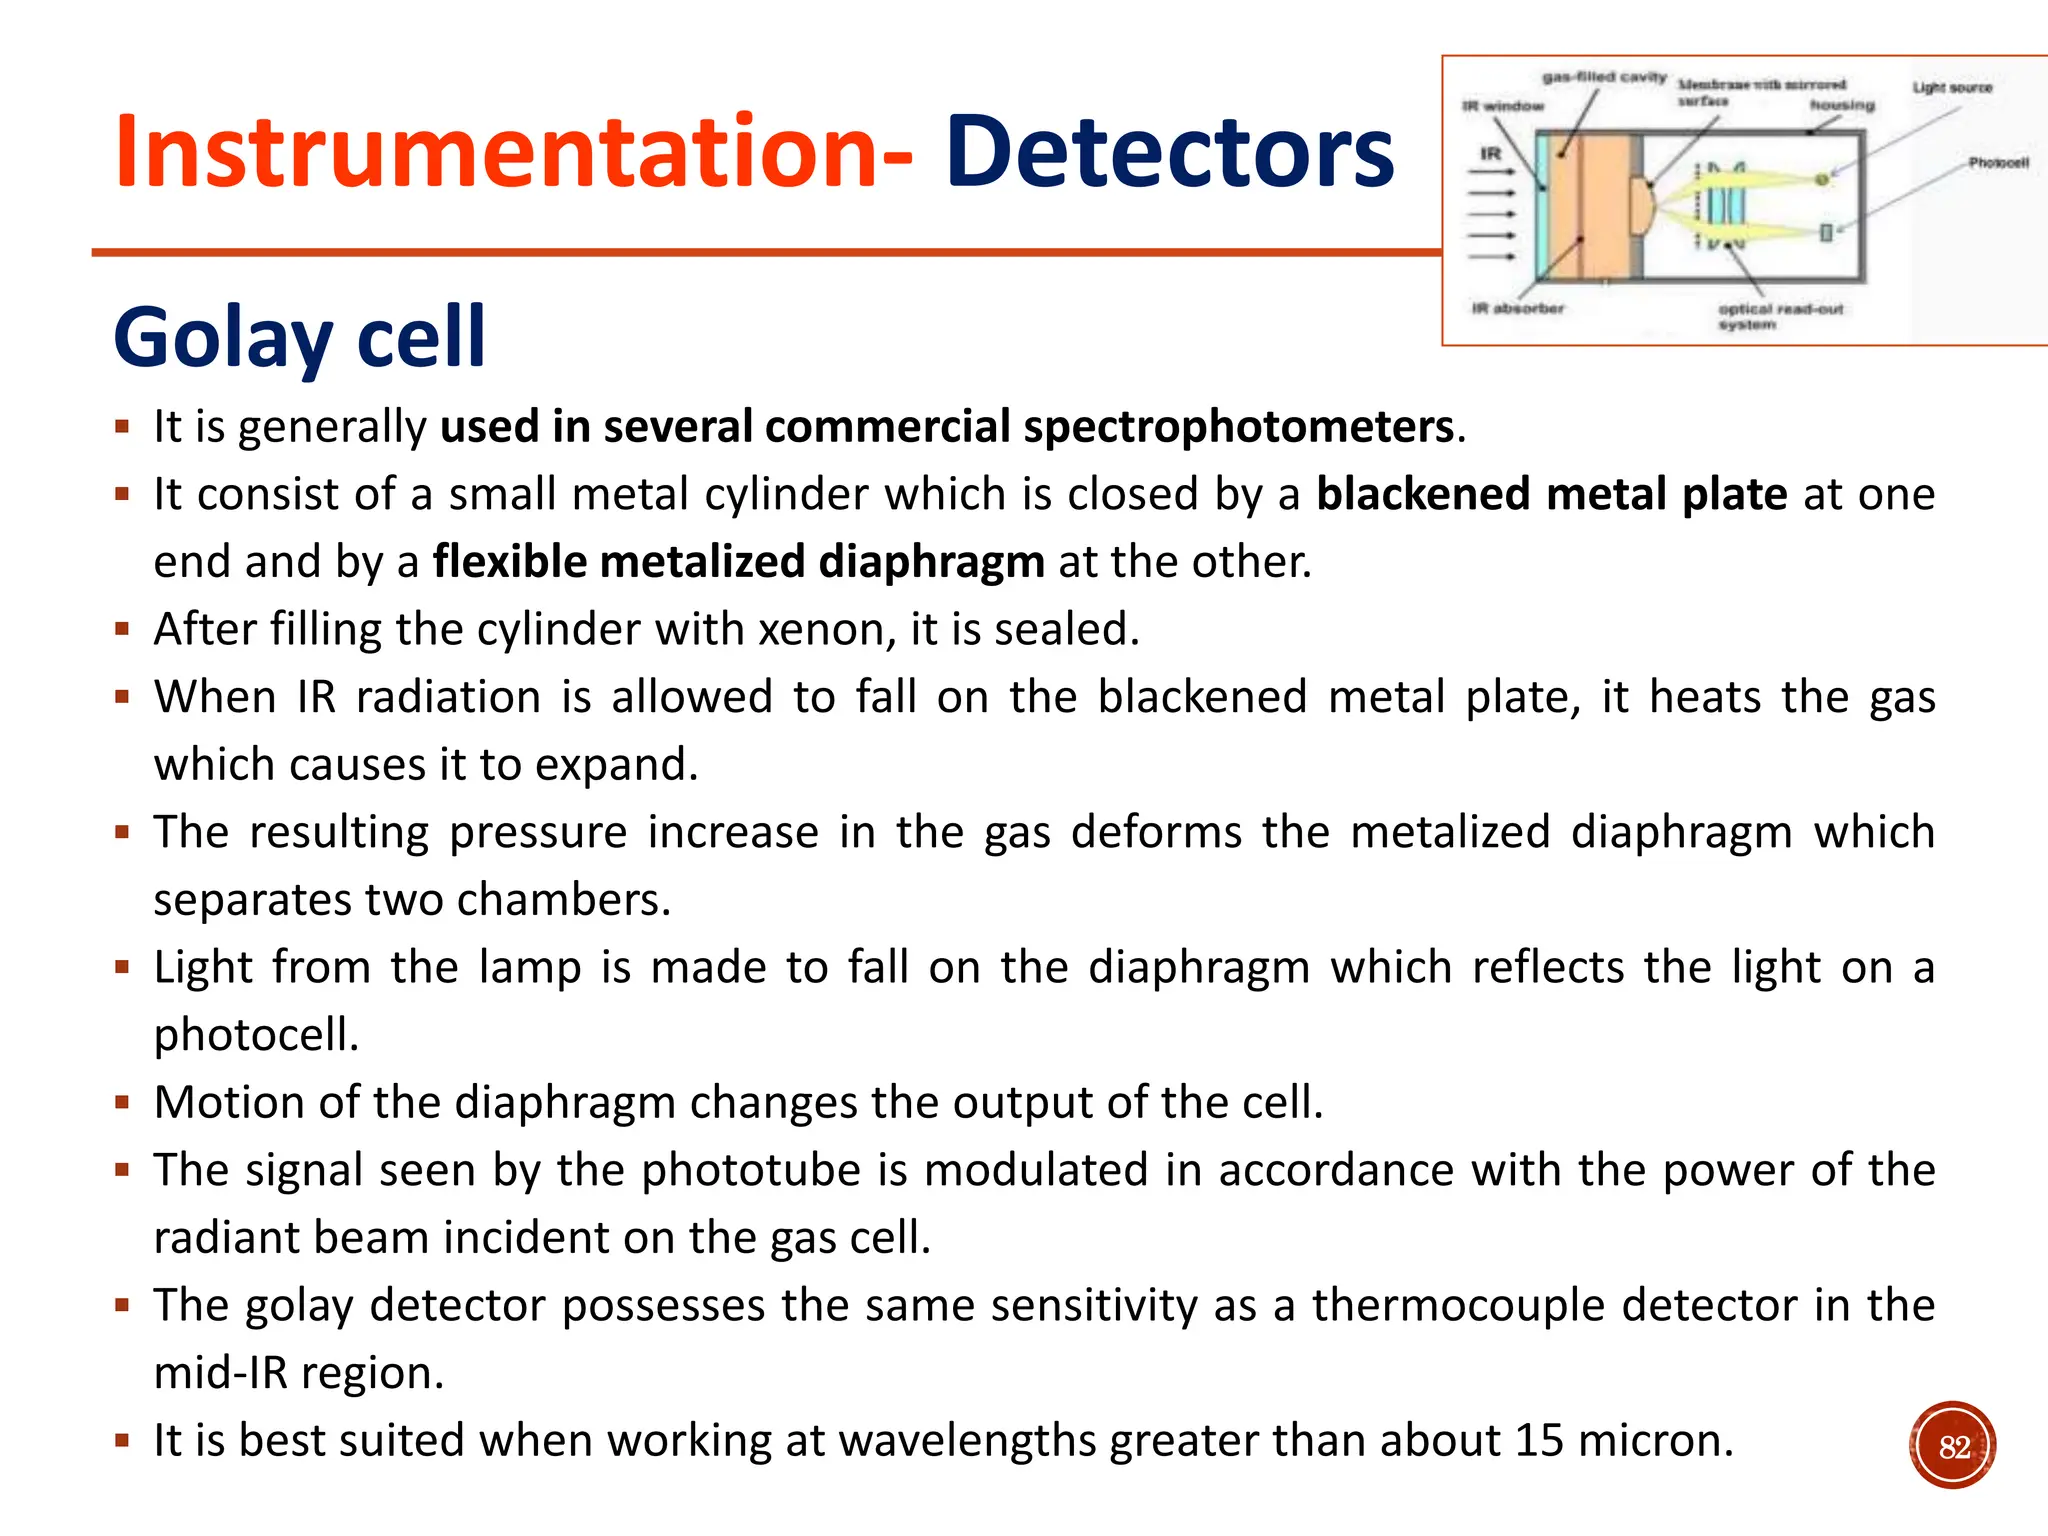
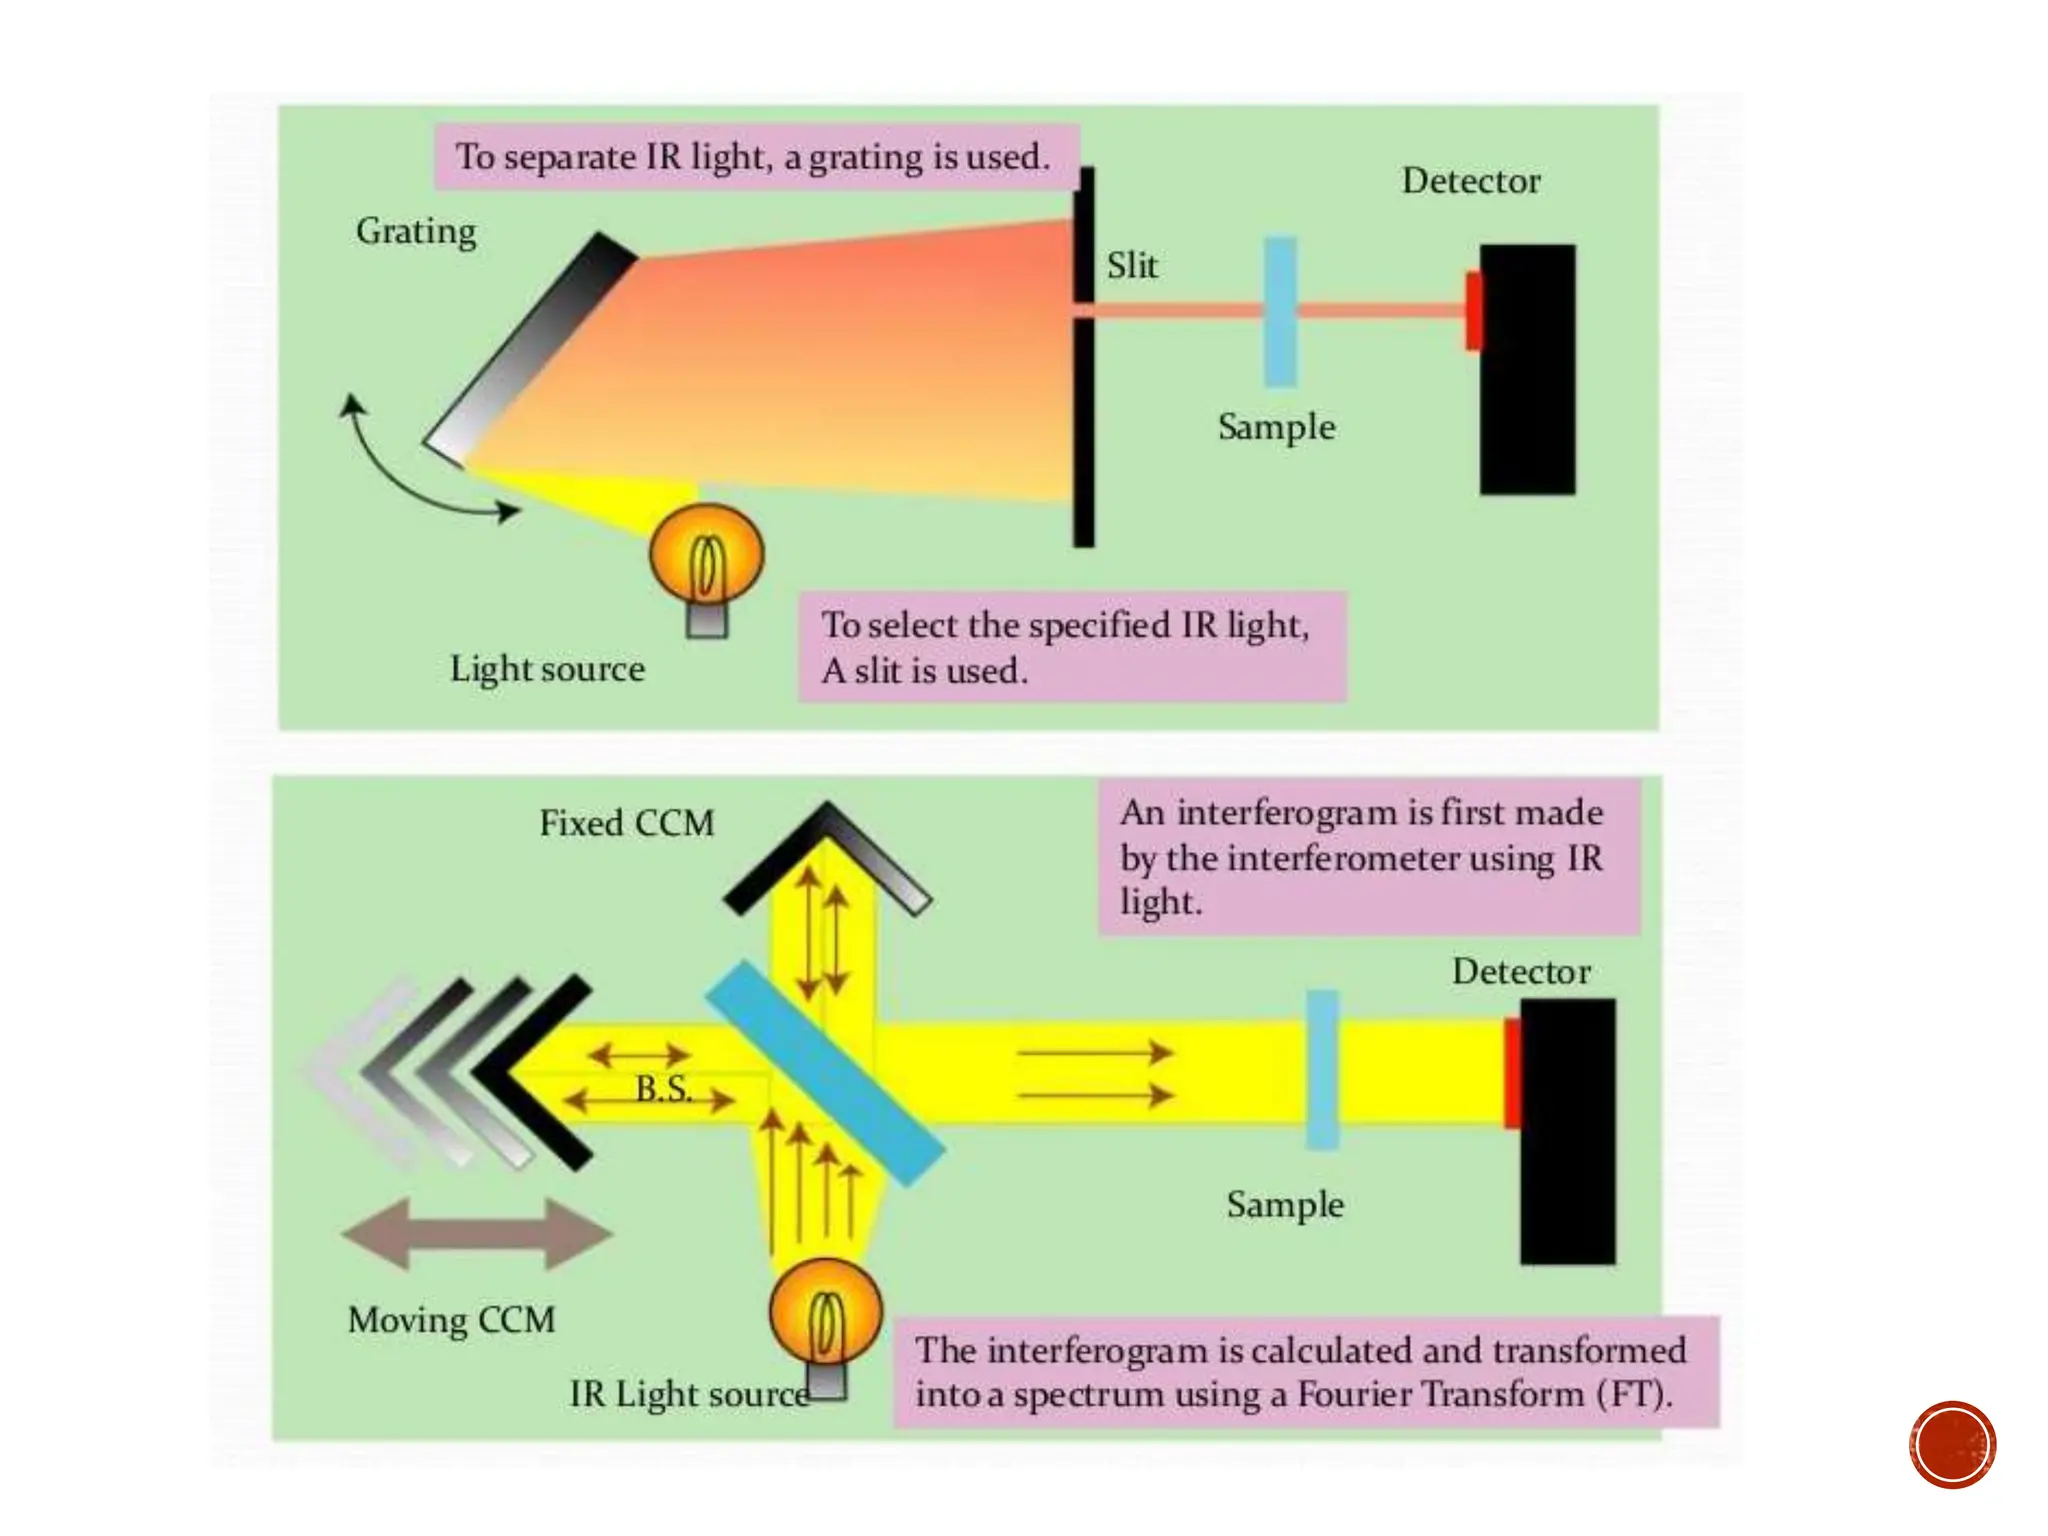
Infrared spectroscopy instruments consist of an infrared radiation source, a sample holder, a detector, and a readout system. Common infrared radiation sources include incandescent lamps, Nernst glowers, and globars. Monochromators like prism and grating monochromators are used to select specific wavelengths from the radiation source.
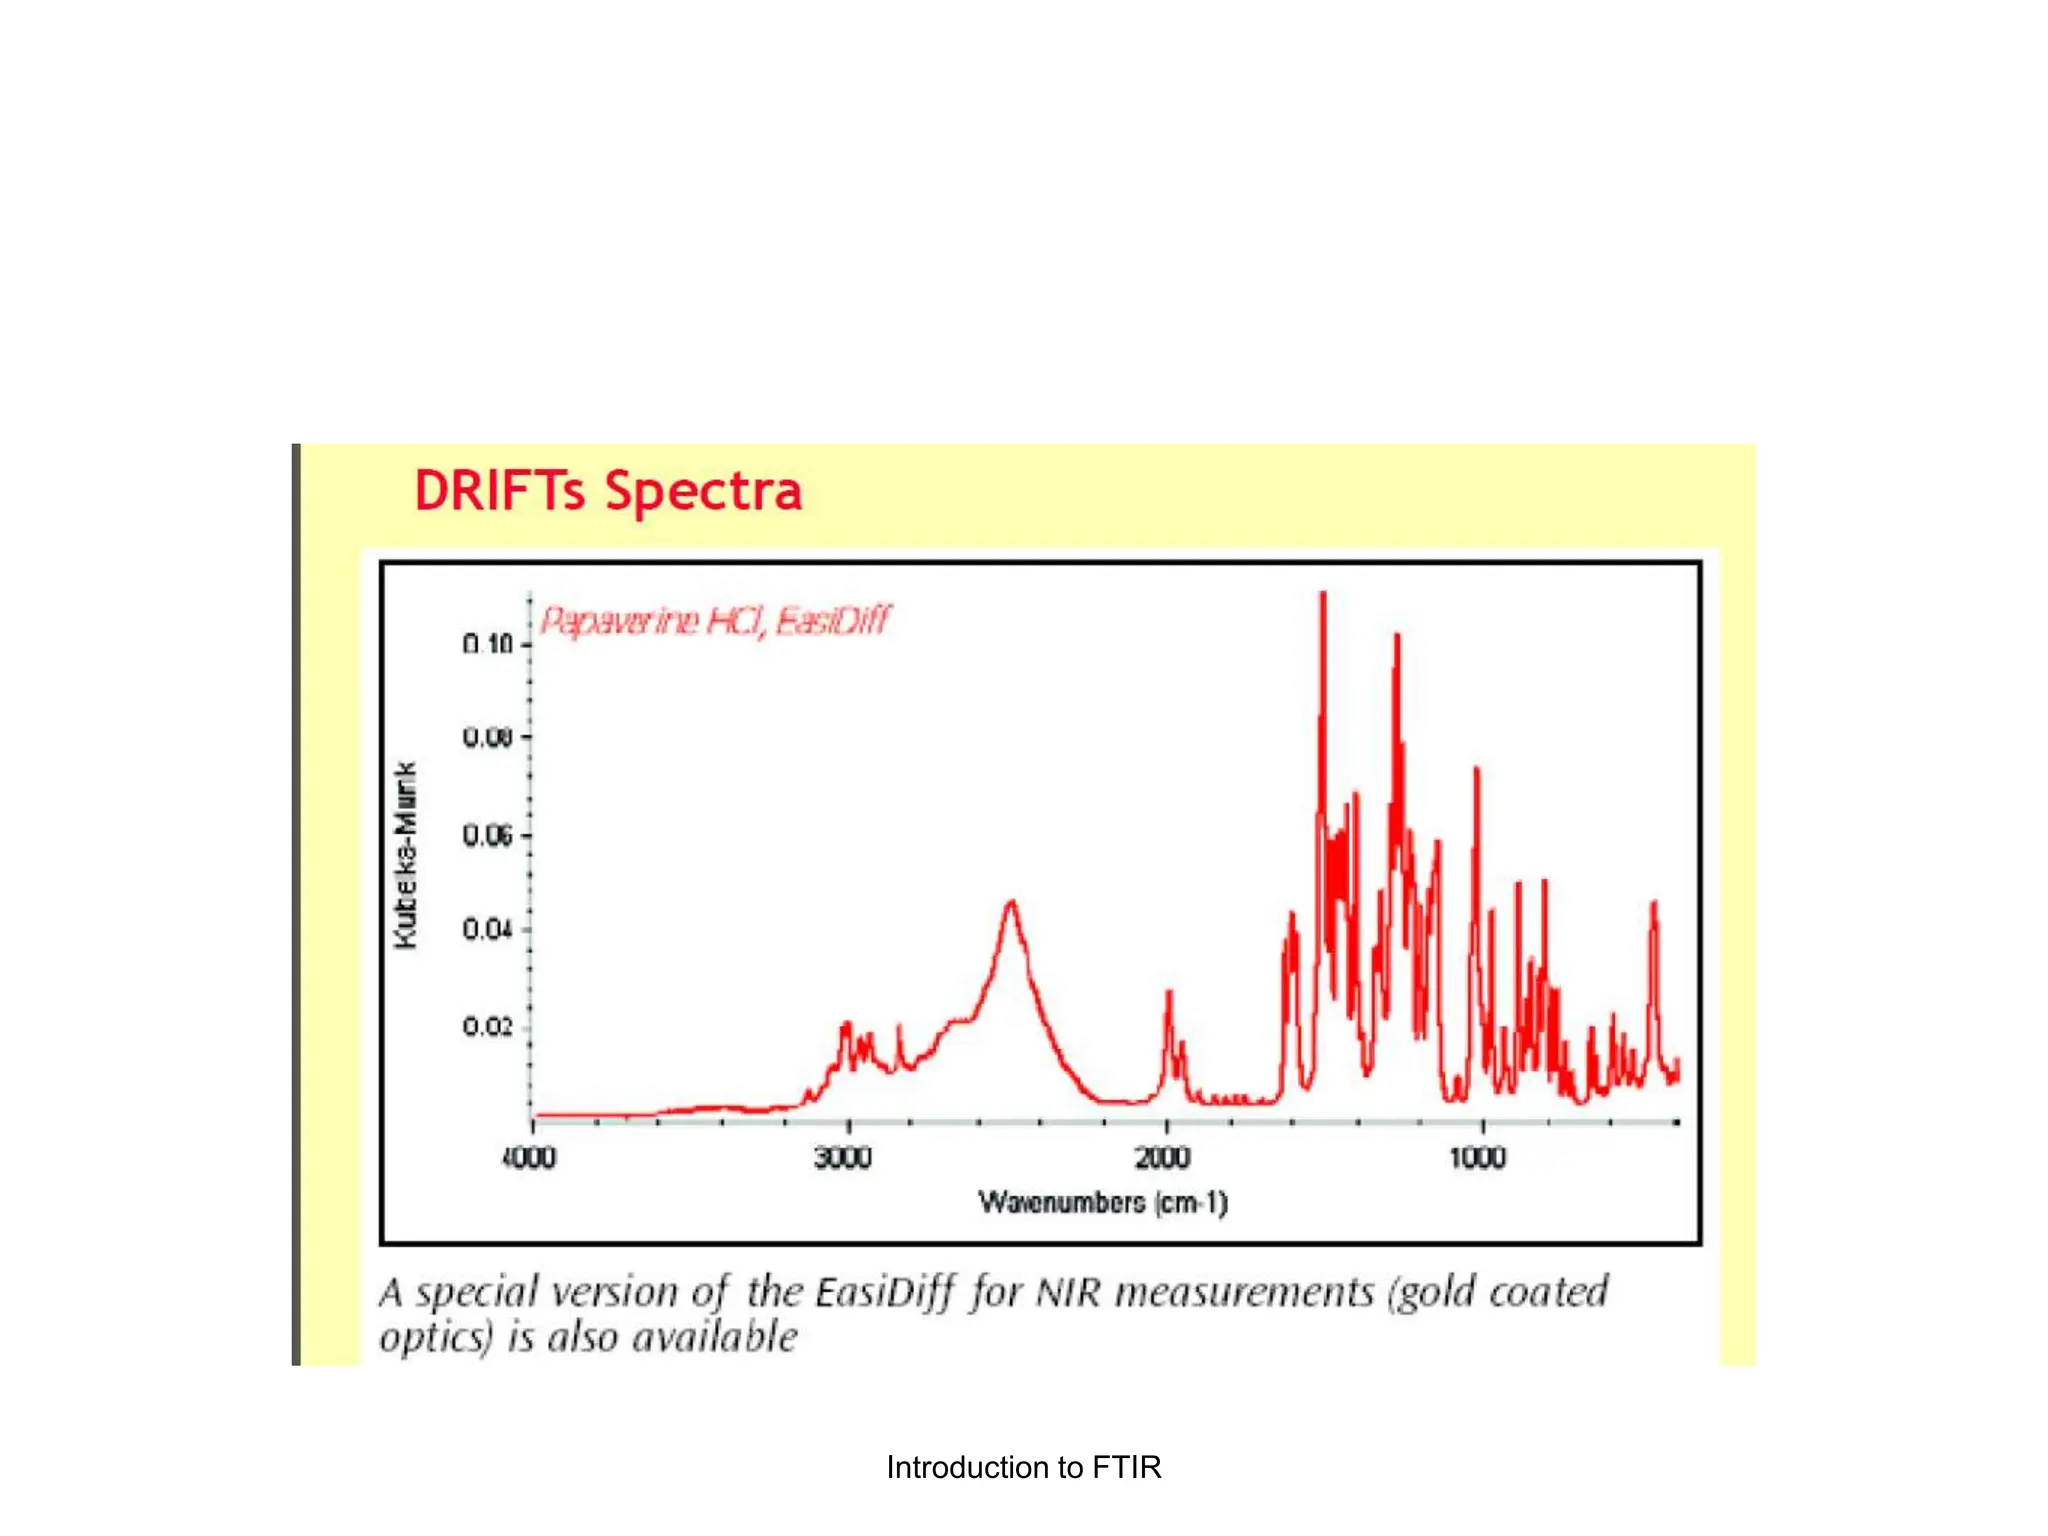
Infrared spectroscopy can analyze solids, liquids, and gases. Solid samples can be prepared by dissolving in solvent