The document surveys rainfall prediction methods using data mining techniques, highlighting the importance of accurate forecasting for agricultural planning, especially in India. It compares traditional linear models like SARIMA to nonlinear approaches including multilayer perceptron neural networks (MLP-NN), evaluating their performance based on statistical parameters. The study utilizes historical rainfall data to assess and improve prediction models, indicating the potential of artificial intelligence techniques in this field.
![RAINFALL PREDICTION USING DATA
MINING TECHNIQUES - A SURVEY
B. Kavitha Rani1 and A.Govardhan2
1
Department of Computer Science &Engineering, JITS, Karimnagar, India
Kavi_gdk1978@yahoo.co.in
2
Professor of CSE, SIT, JNTUH, Hyderabad
govardhan_cse@yahoo.co.in
ABSTRACT
Rainfall is considered as one of the major components of the hydrological process; it takes
significant part in evaluating drought and flooding events. Therefore, it is important to have an
accurate model for rainfall prediction. Recently, several data-driven modeling approaches have
been investigated to perform such forecasting tasks as multilayer perceptron neural networks
(MLP-NN). In fact, the rainfall time series modeling (SARIMA) involvesimportant temporal
dimensions. In order to evaluate the incomes of both models, statistical parameters were used to
make the comparison between the two models. These parameters include the Root Mean Square
Error RMSE, Mean Absolute Error MAE, Coefficient Of Correlation CC and BIAS. Two-Third
of the data was used for training the model and One-third for testing.
KEYWORDS
SARIMA, MAE, RMSE, time series
1. INTRODUCTION
Characteristics and amount of rainfall are not easily known until it occurs. As rainfall plays a
crucial role in evaluation and management of drought and flood events, it is very important to be
able to forecast rainfall. Agriculture is the predominant occupation in India, accounting for about
52% of employment and the service sector makes up a further 34% and industrial sector around
14% [4]. Agricultural and allied sectors accounted for about 60% of the total workforce in 2009
same as in 1993–94.Most of the sub-continent depends on the rainfall for the agriculture needs.
The rainfall data is available for the data mining techniques which can be useful for predicting the
rainfall which can be very useful for taking decisions over crop planting in the areas.
Knowledge of seasonal rainfall, in advance, helps in proper agricultural planning. The nation is,
primarily, dependent on the reasonably accurate prediction of the total amount of rainfall from the
beginning of June to the end of September e.g., in case of a likely below normal rainfall situation
adequate arrangements could be made for the procurement, transport, and distribution of food
grains.
Data Mining aims at discovering knowledge out of data and presenting it in a form that is easily
compressible to humans. It is a process that is developed to examine large amounts of data
routinely collected. Data mining is most useful in an exploratory analysis scenario in which there
Natarajan Meghanathan et al. (Eds) : ITCSE, ICDIP, ICAIT - 2013
pp. 23–30, 2013. © CS & IT-CSCP 2013
DOI : 10.5121/csit.2013.3903](https://image.slidesharecdn.com/rainfallpredictionusingdata-131219033336-phpapp02/85/RAINFALL-PREDICTION-USING-DATA-MINING-TECHNIQUES-A-SURVEY-1-320.jpg)
![24
Computer Science & Information Technology (CS & IT)
are no predetermined notions about what will constitute an "interesting" outcome. Data mining is
the search for new, valuable, and nontrivial information in large volumes of data. Best results
are achieved by balancing the knowledge of human experts in describing problems and goals with
the search capabilities of computers. In practice, the two primary goals of data mining tend to be
classification and prediction. Prediction [1] [2]involves using some variables or fields in the
dataset to predict unknown or future values of other variables of interest. Classification [3] refers
to the task of analyzing a set of pre-classified data objects to learn a model (or a function) that can
be used to classify unseen data object into one of several predefined classes. Description, on the
other hand, focuses on finding patterns describing the data that can be interpreted by humans. For
a given a collection of records (training set) each record contains a set of attributes, out of which
one of the attribute is the class attribute or class variable. Other attributes are often called
independent or predictor attributes (or variables). The set of examples used to learn the
classification model is called the training data set. We need to find a model for class attribute as a
function of the values of other attributes. Further previously unseen records should be assigned a
class as accurately as possible. A test set is used to determine the accuracy of the model. Usually,
the given data set is divided into training and test sets, training set used to build the model and test
set used to validate it.
2. LITERATURE SURVEY
The rainfall forecasting problem has been traditionally tackled using linear techniques, such as
auto regressive (AR),Autoregressive–moving-average model with exogenous inputs (ARMAX),
and KalmanFilter(KF), but also using nonlinear regression [5][6]Box and Jenkins, (1970)[36].
Most of the forecasting methods consider one day ahead forecast. For the rainfall a longer term
forecast such as ten days ahead or a month ahead is more of interest, though it is more difficult
than the one day ahead problem. In fact, there are several considerable drawbacks to the use of
KF in rainfall forecasting application. These include (1) the necessity of accurate stochastic
modeling, which may not be possible in the case for rainfall; (2) the requirement for a priori
information of the system measurement and develop covariance matrices for each new pattern,
which could be challenging to accurately determine and (3) the weak observability of some of
temporal pattern states that may lead to unstable estimates for the forecasted value [4].
In this context, motivation for utilizing non-linear modeling approach based on the Artificial
Intelligence (AI) techniques has received considerable attention from the hydrologists in the last
two decades [7]. A study was conducted on detection of nonlinear response and damage
detection on signal processing, and concluded that artificial neural networks (ANN) can be used
for modeling and forecasting nonlinear time series. Recently ,numerous ANN-based rainfallrunoff models have been proposed to forecast stream flow [8][9][10] and reservoir inflow. In
addition, neural networks and fuzzy logic have been used as effective modeling tools in different
environmental processes such as waste water treatment, water treatment and air pollution. Several
water quality prediction models have been developed utilizing ANN and Adaptive neuro fuzzy
inference system (ANFIS)methods[11][12][19].Rainfall-runoff models utilizing ANN model
showed significant level accuracy if compared with traditional regression models, used an
artificial neural networks to predict the performance of a membrane bioreactor. They were able to
estimate concentrations of chemical oxygen demand, phosphate, ammonia and nitrate.
Altunkaynak et al. (2005)[30] used fuzzy logic modeling to forecast dissolved oxygen
concentration and compared the accuracy of fuzzylogic modeling and autoregressive integrated
moving average (ARIMA)[13] models in predicting water consumption in a city. They found that
relative error rates for fuzzy logic and ARIMA were 2.5 and 2.8, respectively.
An Artificial Neural Network (ANN) is a flexible mathematical structure, which is capable of
identifying complex non-linear relationship between input and output data set. ANN models have](https://image.slidesharecdn.com/rainfallpredictionusingdata-131219033336-phpapp02/85/RAINFALL-PREDICTION-USING-DATA-MINING-TECHNIQUES-A-SURVEY-2-320.jpg)
![Computer Science & Information Technology (CS & IT)
25
been found useful and efficient, particularly in problems for which the characteristics of the
processes are difficult to describe using physical equations[11]. Artificial neural networks (ANN)
are a class of models, inspired by biological nervous systems, denoted by neurons, and working in
parallel. The elements are connected by synoptic weights, which are allowed to adapt through a
learning process. Now a days, neural networks are applied in hydrological [13], pattern
recognition, vision, speech recognition, classification, and control systems.
Hall et al. (1993, 1999)[30] and Hsu et al. (1995) [31] have applied artificial neural network for
rainfall- runoff modeling. Goswamiet al. [35] have used ANNs with three layers, namely, input
layer, hidden layer and output layer for experimental forecasts of all India Summer Monsoon
Rainfall. French et.al.(1992) [31] discussed on rainfall forecasting using neural networks. Here an
attempt to represent the rainfall process in terms of a single–hidden layer feed forward Neural
Network is made (Kulshrestha et al , 2006)[31][33].
Hung, N.Q. et.al (2009)[33], studied artificial neural networks models for rainfall forecasting.
Somvanshi, V.K. et.al. (2006)[33]studied the modeling and prediction of rainfall using artificial
neural networks and Box-Jenkins methodology. Other applications of ANN in hydrology are
forecasting daily water demands and flow forecasting.
3. SCOPE OF THE PROBLEM
The following are the main objectives of the study considered in this problem.
Building of SARIMA models to forecast monthly rainfall in Coastal Andhra, Telangana and
Rayalaseema regions in Andhra Pradesh state in India using Box-Jenkins methodology.
Building feed-forward neural networks models to forecast monthly rainfall in Coastal Andhra,
Telangana and Rayalaseema regions in Andhra Pradesh state in India.
A comparative study is carried out to investigate the forecasting capability of feed-forward neural
networks model and Box-Jenkins methods, which are among those forecasting models most
successfully applied in practice. This study investigates application of neural networks models
and the results of which will be compared with those obtained by Box-Jenkins method.
The FFNN model performance is evaluated using percentage better comparison with SARIMA
models.
4. DATASET
Monthly rainfall(in MM) data for Coastal Andhra, Telangana and Rayalaseema regions in Andhra
Pradesh state during the years 1871-2011 is collected from Climatology & Hydrometeorology
Division, Indian Institute of Tropical Meteorology (IITM), Pune, India. This data consists of
1680 monthly observations, in which 140 years of data during 1871-2005 is used for model fitting
and remaining 6 years of data during 2006-2011 is used as out-of-sample set to measure the
predictability of the selected model using mean absolute error and root mean squared error
statistics.
5. FORECASTING METHODS
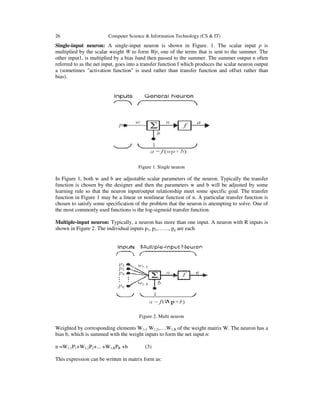
Neuron model- The multilayer perception neural network is built up of simple components. In
the beginning, we will describe a single input neuron which will then be extended to multiple
inputs. Next, we will stack these neurons together to produce layers [4]. Finally, the layers are
cascaded together to form the network.](https://image.slidesharecdn.com/rainfallpredictionusingdata-131219033336-phpapp02/85/RAINFALL-PREDICTION-USING-DATA-MINING-TECHNIQUES-A-SURVEY-3-320.jpg)
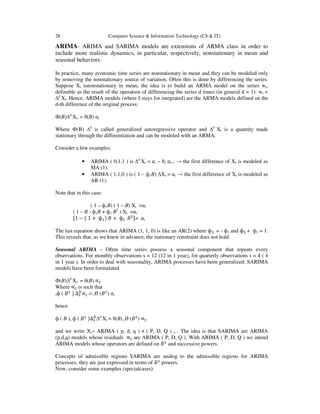
![Computer Science & Information Technology (CS & IT)
n =Wp+b
27
(4)
Where the matrix W is the single neuron case has only one row. Now the neuron output can be
written as:
a =f(Wp+b) (5)
A particular convention in assigning the indices of the elements of the weight matrix has been
adopted [4].The first index indicates the particular neuron destination for the weight. The second
index indicates the source of the signal fed to the neuron. Thus, the indices in W1,2 say that this
weight represents the connection to the first (and only) neuron from the second source [4]. A
multiple-input neuron using abbreviated notation is shown in Figure 2.As shown in Figure 2, the
input vector p is represented by the solid vertical bar at left. The dimensions of p are displayed
below the variable as Rx1, indicating that the input is a single vector of R elements. These inputs
go to the weight matrix W, which has R columns but only one row in this single neuron case. A
constant 1 enters the neuron as input and is multiplied by a scalar bias b. The net input to the
transfer function f is n, which is the sum of the bias b and the product Wp. The neuron's output is
a scalar in this case. If there exit more than one neuron, thenetwork output would be a vector.
6. MULTILAYER PERCEPTRONS
A multilayer feed forward neural network is an interconnection of perceptrons in which data and
calculations flow in a single direction, from the input data to the output. The number of layers in
a neural network is the number of layers of perceptrons. MLP- neural networks consist of units
arranged in layers [14][24][28]. Each layer is composed of nodes and in the fully connected
network considered here each node connects to every node in subsequent layers. Each MLP is
composed of a minimum of three layers consisting of an input layer, one or more hidden layers
and an output layer. The input layer distributes the inputs to subsequent layers. Input nodes have
linear activation functions and no thresholds. Each hidden unit node and each output node have
thresholds associated with them in addition to the weights. The hidden unit nodes have nonlinear
activation functions and the outputs have linear activation functions. Hence, each signal feeding
into a node in a subsequent layer has the original input multiplied by a weight with a threshold
added and then is passed through an activation function that may be linear or nonlinear(hidden
units). Neural networks allows flexibility in modeling real world complex relationships and able
to estimate the posterior probability, which provides the basis for establishing classification rule
and performing statistical analysis [13]
Time Series forecasting
The Box-Jenkins method [36] is one of the most widely used time series forecasting methods in
practice. It is also one of the most popular models in traditional time series forecasting and is
often used as a benchmark model for comparison with any other forecasting method.
It is often difficult to identify a forecasting model because the underlying laws may not be clearly
understood. In addition, hydrological time series may display signs of seasonality and
nonlinearity which traditional linear forecasting techniques are ill equipped to handle, often
producing unsatisfactory results. Researchers confronted with problems of this nature
increasingly resort to techniques that are heuristic and non-linear. Such techniques include the use
of neural networks models.](https://image.slidesharecdn.com/rainfallpredictionusingdata-131219033336-phpapp02/85/RAINFALL-PREDICTION-USING-DATA-MINING-TECHNIQUES-A-SURVEY-5-320.jpg)
![Computer Science & Information Technology (CS & IT)
29
1. Xt = ܽt – sѲଵ ܽt – 12 is ARIMA ( 0, 0, 0 ) × ( 0, 0, 1 ) 12 . There is only one seasonal
MA component, special by s = 12, Q = 1. So, the ACF is characterized by finite
extension and takes value only at lag k = 12. The PACF is infinite extended with
exponential decay, visible at multiple of 12 lags, which is alternate or monotonic
according to the sign of Ѳଵ .
2. Xt = sѲଵ Xt – 12 + ܽt is ARIMA ( 0, 0, 0 ) × ( 1,0, 0 ) 12 . The seasonal AR component
is specified by s = 12, P = 1. So, the ACF is characterized by infinite extension. The
PACF is with finite extended and takes value only at lag k = 12.
7. CONCLUSION
For rainfall prediction, artificial neural network was applied to predict the summary rainfall data
in Thailand. According to the experiments, predictions of the summary rainfall data using back
propagation neural network were acceptably accuracy. In the future works, some additional inputs
were employed for rainfall prediction such as Sea Surface Temperature (SST) areas around
Andhra Pradesh and Southern part of India.
REFERENCES
[1]
[2]
[3]
[4]
[5]
[6]
[7]
[8]
[9]
[10]
[11]
[12]
[13]
[14]
Franck Le Duff , Cristian Muntean, Marc Cuggiaa, Philippe Mabob,Predicting Survival Causes After
Out of Hospital Cardiac Arrest using Data Mining Method, MEDINFO 2004 M. Fieschi et al. (Eds)
Amsterdam: IOS Press
Gisele L. Pappa, Anthony J. Baines and Alex A. Freitas, Predicting post-synaptic activity in proteins
with data mining, bioinformatics, vol 21, Pp. ii19-ii25
L. S. Kumar, y. H. Lee, j. X. Yeo and j. T. Ong, tropical rain classification and estimation of rain
from z-r (reflectivity-rain rate) relationships, progress in electromagnetics research b, vol. 32,
107{127, 2011}
A. El-Shafie, A. Noureldin, M. R. Taha, and A. Hussain, Dynamic versus static neural network model
for rainfall forecasting at Klang River Basin, Malaysia Hydrol. Earth Syst. Sci. Discuss., 8, 6489–
6532, 2011,doi:10.5194/hessd-8-6489-2011 C.L. Wu, K.W. Chau, Prediction of rainfall time series
using modular soft computing methods, Engineering Applications of Artificial Intelligence,2012
Elsevier Ltd. All rights .http://dx.doi.org/10.1016/j.engappai.2012.05.023
S. Alvisi, G. Mascellani, M. Franchini and A. Bárdossy, Water level forecasting through fuzzy logic
and artificial neural network approaches, Copernicus GmbH, 2006
Yilmaz, Abdullah Gokhan; Imteaz, MonzurAlam, ,Development of a hydrologic model using
artificial intelligence for Upper Euphrates Basin in Turkey
Pritpal Singh, Bhogeswar Borah, Indian summer monsoon rainfall prediction using artificial neural
network, springer 2013
Abhishek, Kumar,, Kumar, A., Ranjan, R. ,Kumar, S,A rainfall prediction model using artificial
neural network, Control and System Graduate Research Colloquium (ICSGRC), 2012 IEEE
Sunyoung Lee, Sungzoon Cho, Patrick M. Wong, Rainfall Prediction Using Artificial Neural
Networks , Journal of Geographic Information and Decision Analysis, vol. 2, no. 2, pp. 233 - 242,
1998
VidiBhuwana, Rainfall Runoff Modeling by Using Adaptive-Network-Based Fuzzy Inference System
(ANFIS) - Case Study Ciliwung River
Edvinaldrian, and yudhasetiawandjamil,application of multivariate anfis for daily rainfall Prediction:
influences of training data size, makara, sains, volume 12, no. 1, april 2008
RiaFaulina, , Suhartono2, Hybrid ARIMA-ANFIS for Rainfall Prediction in Indonesia, International
Journal of Science and Research (IJSR), India Online ISSN: 2319-7064 Volume 2 Issue 2, February
2013
Guhathakurta, P (2005) “Long-range monsoon rainfall prediction of 2005 for the districts and subdivision Kerala with artificial neural network”, Current Science, 90, 773-779
Rajeevan, M (2001) “Prediction of Indian summer monsoon: Status,problems and prospects”,
Current Science.](https://image.slidesharecdn.com/rainfallpredictionusingdata-131219033336-phpapp02/85/RAINFALL-PREDICTION-USING-DATA-MINING-TECHNIQUES-A-SURVEY-7-320.jpg)
![30
Computer Science & Information Technology (CS & IT)
[15] D. Mark, “Geographical information science; critical issues in an emerging cross – disciplinary
Research domain”, URISA Journal,vol. 12, February 1999.
[16] Tamil Nadu Meteorology Department, Chennai.
[17] European – Commission, “Forest Fires in Europe 2007, Technicalreport, Report No. 8, 2008.
[18] L.A. Zadeh, “Fuzzy sets”, Information And control vol. 8, 1965.
[19] Nguyen T. Danh, Huyah N. Phien and AshimD.Gupta 1999,“Neural network models for river flow
forecasting, “Journal ofWater SA, Vol.25.
[20] S. Lee, S. Cho and P.M. Wong 1998, “Rainfall prediction usingArtificial Neural Networks,” Journal
of Geographic Information andDecision Analysis, Vol. 2, No. 2.
[21] Hastenrath, S(1988) “Prediction of India Monsoon Rainfall: FurtherExploration”, Journal of Climate.
[22] El-Shafie A, Reda TM, Noureldin A (2007). A Neuro-Fuzzy Model forInflowForecasting of the Nile
River at Aswan High Dam. WaterResour. Manag., 21(3): 533-556.
[23] French MN, Krajewski WF, Cuykendal RR (1992). Rainfall Forecastingin Space and Time Using a
Neural Network. J. Hydrol. Amsterdam,137: 1–37.
[24] Halff AH, Halff HM, Azmoodeh M (1993). Predicting Runoff from RainfallUsing Neural Networks.
Proc. Engrg. Hydrol. ASCE, New York, pp.760–765.
[25] Maier HR, Dandy GC (1996). The Use of Artificial Neural Networks ForThe Prediction of Water
Quality Parameters. Water Resour. Res.,32(4): 1013-1022.
[26] Maria C, Valverde R, HaroldoFraga de Campos V, Nelson Jesus F(2005). Artificial Neural Network
Technique For Rainfall ForecastingApplied to The Sao Paulo Region. J. Hydrol. 301:146–162.
[27] Sahai AK, Somann MK, Satyan V (2000). All India Summer MonsoonRainfall Prediction Using an
Artificial Neural Netw. Clim. Dyn., 16(4):291- 302
[28] A. Altunkaynak, Z. Şen, Steady state flow with hydraulic conductivity change around large diameter
wells, hydrological processes, Wiley publisher
[29] Tony Hall, Precipitation Forecasting Using A Neural Network, Weather And Forecasting Volume 14
[30] Hsu, h.-m, m.w. Moncrieff, w.-w, tung, and c. Liu, 2006a: temporal variability of warm-season
precipitation over north america: statistical analysis of radar measutement. J. Atmos. Sci
[31] French, Mark N., Witold F. Krajewski, and Robert R. Cuykendall. “Rainfall forecasting in space and
time using a neural network.” Journal of hydrology137.1 (1992): 1-31.
[32] Neelamshihani., K. Kumbhar, ManojKulshreshtha, Modeling of extrusion process using response
surface methodology and artificial neural networks, journal of engineering science and technology,
vol. 1, no. 1 (2006) 31-40
[33] N. Q. Hung, M. S. Babel, S. Weesakul, and N. K. Tripathi,An artificial neural network model for
rainfall forecasting inBangkok, Thailand, Hydrol. Earth Syst. Sci., 13, 1413–1425, 2009
[34] V. K. Somvanshi, et al., “Modeling and prediction of rainfall using artificial neural network and
ARIMA techniques.” J. Ind. Geophys. Union, vol. 10, no. 2, pp. 141-151, 2006
[35] B. N. Goswami1, V. Venugopal, D. Sengupta, M. S. Madhusoodanan, Prince K. Xavier, Increasing
Trend of Extreme Rain Events Over India in a Warming Environment. Science 1 December 2006:
Vol. 314 no. 5804 pp. 1442-1445 DOI: 10.1126/science.1132027
[36] Box, G.E.P. and Jenkins, G.M. (1970), Time Series Analysis: Forecasting and Control, San
Francisco:Holden-Da y.](https://image.slidesharecdn.com/rainfallpredictionusingdata-131219033336-phpapp02/85/RAINFALL-PREDICTION-USING-DATA-MINING-TECHNIQUES-A-SURVEY-8-320.jpg)


![1st_Review_PPT[1].pptx](https://cdn.slidesharecdn.com/ss_thumbnails/1streviewppt1-230515064931-d4dfa3eb-thumbnail.jpg?width=640&height=640&fit=bounds)


![5G Explained! A High Level Overview [Introduction]](https://cdn.slidesharecdn.com/ss_thumbnails/5gexplainedahighleveloverview-260119165306-cc137a3e-thumbnail.jpg?width=640&height=640&fit=bounds)


