SlideShare a Scribd company logo
GRAPHICAL ANALYSIS
2/20/2021
VIKRAM NEERUGATTI, PROF. & HOD, DEPT. OF CSE, AUDISANKARA INSTITUTE OF TECHNOLOGY, GUDURU. 1
CREDITS
2/20/2021
VIKRAM NEERUGATTI, PROF. & HOD, DEPT. OF CSE, AUDISANKARA INSTITUTE OF TECHNOLOGY, GUDURU. 2
MRS sir
Google
CONTENT
2/20/2021
VIKRAM NEERUGATTI, PROF. & HOD, DEPT. OF CSE, AUDISANKARA INSTITUTE OF TECHNOLOGY, GUDURU. 3
 Introduction
 Graphical Analysis
 Box-whisker plots
 Scatter plots
 Pairs Plots
 Line Charts
 Pie charts
 Cleveland Dot Charts
 Bar Charts
 Copy Graphics to other Applications
INTRODUCTION-GRAPHICAL ANALYSIS
2/20/2021
VIKRAM NEERUGATTI, PROF. & HOD, DEPT. OF CSE, AUDISANKARA INSTITUTE OF TECHNOLOGY, GUDURU. 4
Graphical Analysis is a tool for science students to collect,
graph, and analyze data.
The primary advantages of graphical representation of data are:
Facilitates and improves learning:
graphics make data easy to understand
and eliminate language and literacy barriers.
Understanding content: visuals are more effective than text in
human understanding.
BOX-WHISKER PLOTS
2/20/2021
VIKRAM NEERUGATTI, PROF. & HOD, DEPT. OF CSE, AUDISANKARA INSTITUTE OF TECHNOLOGY, GUDURU. 5
BOX-WHISKER PLOTS
2/20/2021
VIKRAM NEERUGATTI, PROF. & HOD, DEPT. OF CSE, AUDISANKARA INSTITUTE OF TECHNOLOGY, GUDURU. 6
SCATTER PLOTS
2/20/2021
VIKRAM NEERUGATTI, PROF. & HOD, DEPT. OF CSE, AUDISANKARA INSTITUTE OF TECHNOLOGY, GUDURU. 7
Scatterplots show many points plotted in the Cartesian
plane.
Each point represents the values of two variables.
One variable is chosen in the horizontal axis and another in
the vertical axis.
The simple scatterplot is created using the plot() function.
SCATTER PLOTS
2/20/2021
VIKRAM NEERUGATTI, PROF. & HOD, DEPT. OF CSE, AUDISANKARA INSTITUTE OF TECHNOLOGY, GUDURU. 8
SCATTER PLOTS
2/20/2021
VIKRAM NEERUGATTI, PROF. & HOD, DEPT. OF CSE, AUDISANKARA INSTITUTE OF TECHNOLOGY, GUDURU. 9
PAIRS PLOTS
2/20/2021
VIKRAM NEERUGATTI, PROF. & HOD, DEPT. OF CSE, AUDISANKARA INSTITUTE OF TECHNOLOGY, GUDURU. 10
The pairs plot is a grid of scatterplots.
showing the bivariate relationships between all pairs of
variables in a multivariate dataset.
PAIRS PLOTS
2/20/2021
VIKRAM NEERUGATTI, PROF. & HOD, DEPT. OF CSE, AUDISANKARA INSTITUTE OF TECHNOLOGY, GUDURU. 11
LINE CHARTS
2/20/2021
VIKRAM NEERUGATTI, PROF. & HOD, DEPT. OF CSE, AUDISANKARA INSTITUTE OF TECHNOLOGY, GUDURU. 12
A line chart is a graph that connects a series of points by
drawing line segments between them.
These points are ordered in one of their coordinate (usually
the x-coordinate) value.
Line charts are usually used in identifying the trends in data.
The plot() function in R is used to create the line graph
LINE CHARTS
2/20/2021
VIKRAM NEERUGATTI, PROF. & HOD, DEPT. OF CSE, AUDISANKARA INSTITUTE OF TECHNOLOGY, GUDURU. 13
PIE CHARTS
2/20/2021
VIKRAM NEERUGATTI, PROF. & HOD, DEPT. OF CSE, AUDISANKARA INSTITUTE OF TECHNOLOGY, GUDURU. 14
R Programming language has numerous libraries to create charts and
graphs.
A pie-chart is a representation of values as slices of a circle with
different colors.
The slices are labeled and the numbers corresponding to each slice is
also represented in the chart.
In R the pie chart is created using the pie() function which takes
positive numbers as a vector input.
The additional parameters are used to control labels, color, title etc
PIE CHARTS
2/20/2021
VIKRAM NEERUGATTI, PROF. & HOD, DEPT. OF CSE, AUDISANKARA INSTITUTE OF TECHNOLOGY, GUDURU. 15
PIE CHARTS
2/20/2021
VIKRAM NEERUGATTI, PROF. & HOD, DEPT. OF CSE, AUDISANKARA INSTITUTE OF TECHNOLOGY, GUDURU. 16
CLEVELAND DOT CHARTS
2/20/2021
VIKRAM NEERUGATTI, PROF. & HOD, DEPT. OF CSE, AUDISANKARA INSTITUTE OF TECHNOLOGY, GUDURU. 17
dotchart() function in R Language is used to create a
dot chart of the specified data.
A dot chart is defined as a plot which is used to draw a
Cleveland dot plot.
CLEVELAND DOT CHARTS
2/20/2021
VIKRAM NEERUGATTI, PROF. & HOD, DEPT. OF CSE, AUDISANKARA INSTITUTE OF TECHNOLOGY, GUDURU. 18
CLEVELAND DOT CHARTS
2/20/2021
VIKRAM NEERUGATTI, PROF. & HOD, DEPT. OF CSE, AUDISANKARA INSTITUTE OF TECHNOLOGY, GUDURU. 19
BAR CHARTS
2/20/2021
VIKRAM NEERUGATTI, PROF. & HOD, DEPT. OF CSE, AUDISANKARA INSTITUTE OF TECHNOLOGY, GUDURU. 20
A bar chart represents data in rectangular bars with length
of the bar proportional to the value of the variable.
R uses the function barplot() to create bar charts.
R can draw both vertical and Horizontal bars in the bar
chart.
In bar chart each of the bars can be given different colors
BAR CHARTS
2/20/2021
VIKRAM NEERUGATTI, PROF. & HOD, DEPT. OF CSE, AUDISANKARA INSTITUTE OF TECHNOLOGY, GUDURU. 21
BAR CHARTS
2/20/2021
VIKRAM NEERUGATTI, PROF. & HOD, DEPT. OF CSE, AUDISANKARA INSTITUTE OF TECHNOLOGY, GUDURU. 22
COPY GRAPHICS TO OTHER APPLICATIONS
2/20/2021
VIKRAM NEERUGATTI, PROF. & HOD, DEPT. OF CSE, AUDISANKARA INSTITUTE OF TECHNOLOGY, GUDURU. 23
Plots panel –>
Export –> Save
as Image or Save
as PDF
COPY GRAPHICS TO OTHER APPLICATIONS
2/20/2021
VIKRAM NEERUGATTI, PROF. & HOD, DEPT. OF CSE, AUDISANKARA INSTITUTE OF TECHNOLOGY, GUDURU. 24
It's also possible to save the graph using R codes as
follow:
Specify files to save your image using a function such as
jpeg(), png(), svg() or pdf().
Additional argument indicating the width and the height of
the image can be also used. Create the plot.
COPY GRAPHICS TO OTHER APPLICATIONS
2/20/2021
VIKRAM NEERUGATTI, PROF. & HOD, DEPT. OF CSE, AUDISANKARA INSTITUTE OF TECHNOLOGY, GUDURU. 25
SUMMARY
2/20/2021
VIKRAM NEERUGATTI, PROF. & HOD, DEPT. OF CSE, AUDISANKARA INSTITUTE OF TECHNOLOGY, GUDURU. 26
 Introduction
 Graphical Analysis
 Box-whisker plots
 Scatter plots
 Pairs Plots
 Line Charts
 Pie charts
 Cleveland Dot Charts
 Bar Charts
 Copy Graphics to other Applications
ANY CLARIFICATIONS?
2/20/2021
VIKRAM NEERUGATTI, PROF. & HOD, DEPT. OF CSE, AUDISANKARA INSTITUTE OF TECHNOLOGY, GUDURU. 27
THANK YOU
2/20/2021
VIKRAM NEERUGATTI, PROF. & HOD, DEPT. OF CSE, AUDISANKARA INSTITUTE OF TECHNOLOGY, GUDURU. 28

More Related Content

What's hot

Machine Learning Based Botnet Detection
Machine Learning Based Botnet DetectionMachine Learning Based Botnet Detection
Machine Learning Based Botnet Detection
butest
 
Visual Thinking for Brainstorming, Planning, Learning, Collaborating, Harvesting
Visual Thinking for Brainstorming, Planning, Learning, Collaborating, HarvestingVisual Thinking for Brainstorming, Planning, Learning, Collaborating, Harvesting
Visual Thinking for Brainstorming, Planning, Learning, Collaborating, Harvesting
Giulia Forsythe
 
Satellite communications by dennis roddy (4th edition)
Satellite communications by dennis roddy (4th edition)Satellite communications by dennis roddy (4th edition)
Satellite communications by dennis roddy (4th edition)
Adam Năm
 
Progettazione e sviluppo di un'applicazione web per la gestione di dati di at...
Progettazione e sviluppo di un'applicazione web per la gestione di dati di at...Progettazione e sviluppo di un'applicazione web per la gestione di dati di at...
Progettazione e sviluppo di un'applicazione web per la gestione di dati di at...
daniel_zotti
 

What's hot (20)

GeoServer 2.4.x 한국어 사용자 지침서
GeoServer 2.4.x 한국어 사용자 지침서GeoServer 2.4.x 한국어 사용자 지침서
GeoServer 2.4.x 한국어 사용자 지침서
 
Yurii Pashchenko: Unlocking the potential of Segment Anything Model (UA)
Yurii Pashchenko: Unlocking the potential of Segment Anything Model (UA)Yurii Pashchenko: Unlocking the potential of Segment Anything Model (UA)
Yurii Pashchenko: Unlocking the potential of Segment Anything Model (UA)
 
Machine Learning Based Botnet Detection
Machine Learning Based Botnet DetectionMachine Learning Based Botnet Detection
Machine Learning Based Botnet Detection
 
[Platum Report] 중국 모바일 결제 시장 현황
[Platum Report] 중국 모바일 결제 시장 현황 [Platum Report] 중국 모바일 결제 시장 현황
[Platum Report] 중국 모바일 결제 시장 현황
 
Multiple object detection report
Multiple object detection reportMultiple object detection report
Multiple object detection report
 
Book of Urizen - Reader's Guide
Book of Urizen - Reader's GuideBook of Urizen - Reader's Guide
Book of Urizen - Reader's Guide
 
Visual Thinking for Brainstorming, Planning, Learning, Collaborating, Harvesting
Visual Thinking for Brainstorming, Planning, Learning, Collaborating, HarvestingVisual Thinking for Brainstorming, Planning, Learning, Collaborating, Harvesting
Visual Thinking for Brainstorming, Planning, Learning, Collaborating, Harvesting
 
위성이미지 객체 검출 대회 - 1등
위성이미지 객체 검출 대회 - 1등위성이미지 객체 검출 대회 - 1등
위성이미지 객체 검출 대회 - 1등
 
DomainKeys Identified Mail (DKIM).pptx
DomainKeys Identified Mail (DKIM).pptxDomainKeys Identified Mail (DKIM).pptx
DomainKeys Identified Mail (DKIM).pptx
 
Satellite communications by dennis roddy (4th edition)
Satellite communications by dennis roddy (4th edition)Satellite communications by dennis roddy (4th edition)
Satellite communications by dennis roddy (4th edition)
 
Digital Twin For The Railway Network
Digital Twin For The Railway NetworkDigital Twin For The Railway Network
Digital Twin For The Railway Network
 
VTU FINAL YEAR PROJECT REPORT Front pages
VTU FINAL YEAR PROJECT REPORT Front pagesVTU FINAL YEAR PROJECT REPORT Front pages
VTU FINAL YEAR PROJECT REPORT Front pages
 
OpenGL Mini Projects With Source Code [ Computer Graphics ]
OpenGL Mini Projects With Source Code [ Computer Graphics ]OpenGL Mini Projects With Source Code [ Computer Graphics ]
OpenGL Mini Projects With Source Code [ Computer Graphics ]
 
Image Forgery Detection
Image Forgery DetectionImage Forgery Detection
Image Forgery Detection
 
Imageprocessing
ImageprocessingImageprocessing
Imageprocessing
 
Currency Recognition System for Visually Impaired: Egyptian Banknote as a Stu...
Currency Recognition System for Visually Impaired: Egyptian Banknote as a Stu...Currency Recognition System for Visually Impaired: Egyptian Banknote as a Stu...
Currency Recognition System for Visually Impaired: Egyptian Banknote as a Stu...
 
GeoApps in the AWS Cloud - Jinesh Varia
GeoApps in the AWS Cloud - Jinesh VariaGeoApps in the AWS Cloud - Jinesh Varia
GeoApps in the AWS Cloud - Jinesh Varia
 
Progettazione e sviluppo di un'applicazione web per la gestione di dati di at...
Progettazione e sviluppo di un'applicazione web per la gestione di dati di at...Progettazione e sviluppo di un'applicazione web per la gestione di dati di at...
Progettazione e sviluppo di un'applicazione web per la gestione di dati di at...
 
B.Sc. III(VI Sem) Question Bank Advance Java(Unit:1,2, and 5)
B.Sc. III(VI Sem) Question Bank Advance Java(Unit:1,2, and 5)B.Sc. III(VI Sem) Question Bank Advance Java(Unit:1,2, and 5)
B.Sc. III(VI Sem) Question Bank Advance Java(Unit:1,2, and 5)
 
Multi-label Remote Sensing Image Retrieval based on Deep Features
Multi-label Remote Sensing Image Retrieval based on Deep FeaturesMulti-label Remote Sensing Image Retrieval based on Deep Features
Multi-label Remote Sensing Image Retrieval based on Deep Features
 

Similar to R Programming Unit 3 part-1

Pengenalan kepada autocad
Pengenalan kepada autocadPengenalan kepada autocad
Pengenalan kepada autocad
mohdfadil112279
 
09_KHIN AYE MU.docx - Abstract
09_KHIN AYE MU.docx - Abstract09_KHIN AYE MU.docx - Abstract
09_KHIN AYE MU.docx - Abstract
butest
 
09_KHIN AYE MU.docx - Abstract
09_KHIN AYE MU.docx - Abstract09_KHIN AYE MU.docx - Abstract
09_KHIN AYE MU.docx - Abstract
butest
 

Similar to R Programming Unit 3 part-1 (20)

presentation on solid manipulation in computer aided design
presentation on solid manipulation in computer aided designpresentation on solid manipulation in computer aided design
presentation on solid manipulation in computer aided design
 
Computer Networks Unit 1 part-2
Computer Networks Unit 1 part-2Computer Networks Unit 1 part-2
Computer Networks Unit 1 part-2
 
Data Acquisition Systems presentation
Data Acquisition  Systems presentationData Acquisition  Systems presentation
Data Acquisition Systems presentation
 
Unit 1 part-1
Unit 1 part-1Unit 1 part-1
Unit 1 part-1
 
Pengenalankepadaautocad
PengenalankepadaautocadPengenalankepadaautocad
Pengenalankepadaautocad
 
3D Modelling and Detailing in Tekla Structures
3D Modelling and Detailing in Tekla Structures3D Modelling and Detailing in Tekla Structures
3D Modelling and Detailing in Tekla Structures
 
Pengenalan kepada autocad
Pengenalan kepada autocadPengenalan kepada autocad
Pengenalan kepada autocad
 
Comparative Study on Analysis of G+10 Regular Residential Building subjected ...
Comparative Study on Analysis of G+10 Regular Residential Building subjected ...Comparative Study on Analysis of G+10 Regular Residential Building subjected ...
Comparative Study on Analysis of G+10 Regular Residential Building subjected ...
 
CEM and Radar Cross Section @ Zeus Numerix
CEM and Radar Cross Section @ Zeus NumerixCEM and Radar Cross Section @ Zeus Numerix
CEM and Radar Cross Section @ Zeus Numerix
 
DSCE_GWU_3D PRINTING TYPES APPLICATIONS APPLICATION
DSCE_GWU_3D PRINTING TYPES APPLICATIONS APPLICATIONDSCE_GWU_3D PRINTING TYPES APPLICATIONS APPLICATION
DSCE_GWU_3D PRINTING TYPES APPLICATIONS APPLICATION
 
My Quantum Journey
My Quantum JourneyMy Quantum Journey
My Quantum Journey
 
RURAL ROAD DESIGN ENHANCEMENT USING CIVIL 3D
RURAL ROAD DESIGN ENHANCEMENT USING CIVIL 3DRURAL ROAD DESIGN ENHANCEMENT USING CIVIL 3D
RURAL ROAD DESIGN ENHANCEMENT USING CIVIL 3D
 
PCA and SVD in brief
PCA and SVD in briefPCA and SVD in brief
PCA and SVD in brief
 
IRJET- Design and HW/SW Implementation of a Nonlinear Interpolator for Border...
IRJET- Design and HW/SW Implementation of a Nonlinear Interpolator for Border...IRJET- Design and HW/SW Implementation of a Nonlinear Interpolator for Border...
IRJET- Design and HW/SW Implementation of a Nonlinear Interpolator for Border...
 
CS6311- PROGRAMMING & DATA STRUCTURE II LABORATORY
CS6311- PROGRAMMING & DATA STRUCTURE II LABORATORYCS6311- PROGRAMMING & DATA STRUCTURE II LABORATORY
CS6311- PROGRAMMING & DATA STRUCTURE II LABORATORY
 
PCB DESIGN USING KICAD || SHASHANK M GOWDA
PCB DESIGN USING KICAD || SHASHANK M GOWDA  PCB DESIGN USING KICAD || SHASHANK M GOWDA
PCB DESIGN USING KICAD || SHASHANK M GOWDA
 
Computer-Aided Design of Raft Foundation using Excel VBA and FORTRAN
Computer-Aided Design of Raft Foundation using Excel VBA and FORTRANComputer-Aided Design of Raft Foundation using Excel VBA and FORTRAN
Computer-Aided Design of Raft Foundation using Excel VBA and FORTRAN
 
Algebraic methods for design QC-LDPC codes
Algebraic methods for design QC-LDPC codesAlgebraic methods for design QC-LDPC codes
Algebraic methods for design QC-LDPC codes
 
09_KHIN AYE MU.docx - Abstract
09_KHIN AYE MU.docx - Abstract09_KHIN AYE MU.docx - Abstract
09_KHIN AYE MU.docx - Abstract
 
09_KHIN AYE MU.docx - Abstract
09_KHIN AYE MU.docx - Abstract09_KHIN AYE MU.docx - Abstract
09_KHIN AYE MU.docx - Abstract
 

More from Vikram Nandini

More from Vikram Nandini (20)

IoT: From Copper strip to Gold Bar
IoT: From Copper strip to Gold BarIoT: From Copper strip to Gold Bar
IoT: From Copper strip to Gold Bar
 
Design Patterns
Design PatternsDesign Patterns
Design Patterns
 
Linux File Trees and Commands
Linux File Trees and CommandsLinux File Trees and Commands
Linux File Trees and Commands
 
Introduction to Linux & Basic Commands
Introduction to Linux & Basic CommandsIntroduction to Linux & Basic Commands
Introduction to Linux & Basic Commands
 
INTRODUCTION to OOAD
INTRODUCTION to OOADINTRODUCTION to OOAD
INTRODUCTION to OOAD
 
Ethics
EthicsEthics
Ethics
 
Manufacturing - II Part
Manufacturing - II PartManufacturing - II Part
Manufacturing - II Part
 
Manufacturing
ManufacturingManufacturing
Manufacturing
 
Business Models
Business ModelsBusiness Models
Business Models
 
Prototyping Online Components
Prototyping Online ComponentsPrototyping Online Components
Prototyping Online Components
 
Artificial Neural Networks
Artificial Neural NetworksArtificial Neural Networks
Artificial Neural Networks
 
IoT-Prototyping
IoT-PrototypingIoT-Prototyping
IoT-Prototyping
 
Design Principles for Connected Devices
Design Principles for Connected DevicesDesign Principles for Connected Devices
Design Principles for Connected Devices
 
Introduction to IoT
Introduction to IoTIntroduction to IoT
Introduction to IoT
 
Embedded decices
Embedded decicesEmbedded decices
Embedded decices
 
Communication in the IoT
Communication in the IoTCommunication in the IoT
Communication in the IoT
 
Introduction to Cyber Security
Introduction to Cyber SecurityIntroduction to Cyber Security
Introduction to Cyber Security
 
cloud computing UNIT-2.pdf
cloud computing UNIT-2.pdfcloud computing UNIT-2.pdf
cloud computing UNIT-2.pdf
 
Introduction to Web Technologies
Introduction to Web TechnologiesIntroduction to Web Technologies
Introduction to Web Technologies
 
Cascading Style Sheets
Cascading Style SheetsCascading Style Sheets
Cascading Style Sheets
 

Recently uploaded

Adversarial Attention Modeling for Multi-dimensional Emotion Regression.pdf
Adversarial Attention Modeling for Multi-dimensional Emotion Regression.pdfAdversarial Attention Modeling for Multi-dimensional Emotion Regression.pdf
Adversarial Attention Modeling for Multi-dimensional Emotion Regression.pdf
Po-Chuan Chen
 
Additional Benefits for Employee Website.pdf
Additional Benefits for Employee Website.pdfAdditional Benefits for Employee Website.pdf
Additional Benefits for Employee Website.pdf
joachimlavalley1
 
Accounting and finance exit exam 2016 E.C.pdf
Accounting and finance exit exam 2016 E.C.pdfAccounting and finance exit exam 2016 E.C.pdf
Accounting and finance exit exam 2016 E.C.pdf
YibeltalNibretu
 

Recently uploaded (20)

How to Break the cycle of negative Thoughts
How to Break the cycle of negative ThoughtsHow to Break the cycle of negative Thoughts
How to Break the cycle of negative Thoughts
 
Basic Civil Engg Notes_Chapter-6_Environment Pollution & Engineering
Basic Civil Engg Notes_Chapter-6_Environment Pollution & EngineeringBasic Civil Engg Notes_Chapter-6_Environment Pollution & Engineering
Basic Civil Engg Notes_Chapter-6_Environment Pollution & Engineering
 
INU_CAPSTONEDESIGN_비밀번호486_업로드용 발표자료.pdf
INU_CAPSTONEDESIGN_비밀번호486_업로드용 발표자료.pdfINU_CAPSTONEDESIGN_비밀번호486_업로드용 발표자료.pdf
INU_CAPSTONEDESIGN_비밀번호486_업로드용 발표자료.pdf
 
Basic phrases for greeting and assisting costumers
Basic phrases for greeting and assisting costumersBasic phrases for greeting and assisting costumers
Basic phrases for greeting and assisting costumers
 
slides CapTechTalks Webinar May 2024 Alexander Perry.pptx
slides CapTechTalks Webinar May 2024 Alexander Perry.pptxslides CapTechTalks Webinar May 2024 Alexander Perry.pptx
slides CapTechTalks Webinar May 2024 Alexander Perry.pptx
 
Matatag-Curriculum and the 21st Century Skills Presentation.pptx
Matatag-Curriculum and the 21st Century Skills Presentation.pptxMatatag-Curriculum and the 21st Century Skills Presentation.pptx
Matatag-Curriculum and the 21st Century Skills Presentation.pptx
 
aaaaaaaaaaaaaaaaaaaaaaaaaaaaaaaaaaaaaaaaaaaaaaaaaaaaaaa
aaaaaaaaaaaaaaaaaaaaaaaaaaaaaaaaaaaaaaaaaaaaaaaaaaaaaaaaaaaaaaaaaaaaaaaaaaaaaaaaaaaaaaaaaaaaaaaaaaaaaaaaaaaaaa
aaaaaaaaaaaaaaaaaaaaaaaaaaaaaaaaaaaaaaaaaaaaaaaaaaaaaaa
 
Adversarial Attention Modeling for Multi-dimensional Emotion Regression.pdf
Adversarial Attention Modeling for Multi-dimensional Emotion Regression.pdfAdversarial Attention Modeling for Multi-dimensional Emotion Regression.pdf
Adversarial Attention Modeling for Multi-dimensional Emotion Regression.pdf
 
Additional Benefits for Employee Website.pdf
Additional Benefits for Employee Website.pdfAdditional Benefits for Employee Website.pdf
Additional Benefits for Employee Website.pdf
 
The Art Pastor's Guide to Sabbath | Steve Thomason
The Art Pastor's Guide to Sabbath | Steve ThomasonThe Art Pastor's Guide to Sabbath | Steve Thomason
The Art Pastor's Guide to Sabbath | Steve Thomason
 
Danh sách HSG Bộ môn cấp trường - Cấp THPT.pdf
Danh sách HSG Bộ môn cấp trường - Cấp THPT.pdfDanh sách HSG Bộ môn cấp trường - Cấp THPT.pdf
Danh sách HSG Bộ môn cấp trường - Cấp THPT.pdf
 
Advances in production technology of Grapes.pdf
Advances in production technology of Grapes.pdfAdvances in production technology of Grapes.pdf
Advances in production technology of Grapes.pdf
 
Accounting and finance exit exam 2016 E.C.pdf
Accounting and finance exit exam 2016 E.C.pdfAccounting and finance exit exam 2016 E.C.pdf
Accounting and finance exit exam 2016 E.C.pdf
 
Salient features of Environment protection Act 1986.pptx
Salient features of Environment protection Act 1986.pptxSalient features of Environment protection Act 1986.pptx
Salient features of Environment protection Act 1986.pptx
 
Benefits and Challenges of Using Open Educational Resources
Benefits and Challenges of Using Open Educational ResourcesBenefits and Challenges of Using Open Educational Resources
Benefits and Challenges of Using Open Educational Resources
 
Instructions for Submissions thorugh G- Classroom.pptx
Instructions for Submissions thorugh G- Classroom.pptxInstructions for Submissions thorugh G- Classroom.pptx
Instructions for Submissions thorugh G- Classroom.pptx
 
2024_Student Session 2_ Set Plan Preparation.pptx
2024_Student Session 2_ Set Plan Preparation.pptx2024_Student Session 2_ Set Plan Preparation.pptx
2024_Student Session 2_ Set Plan Preparation.pptx
 
Sha'Carri Richardson Presentation 202345
Sha'Carri Richardson Presentation 202345Sha'Carri Richardson Presentation 202345
Sha'Carri Richardson Presentation 202345
 
Sectors of the Indian Economy - Class 10 Study Notes pdf
Sectors of the Indian Economy - Class 10 Study Notes pdfSectors of the Indian Economy - Class 10 Study Notes pdf
Sectors of the Indian Economy - Class 10 Study Notes pdf
 
GIÁO ÁN DẠY THÊM (KẾ HOẠCH BÀI BUỔI 2) - TIẾNG ANH 8 GLOBAL SUCCESS (2 CỘT) N...
GIÁO ÁN DẠY THÊM (KẾ HOẠCH BÀI BUỔI 2) - TIẾNG ANH 8 GLOBAL SUCCESS (2 CỘT) N...GIÁO ÁN DẠY THÊM (KẾ HOẠCH BÀI BUỔI 2) - TIẾNG ANH 8 GLOBAL SUCCESS (2 CỘT) N...
GIÁO ÁN DẠY THÊM (KẾ HOẠCH BÀI BUỔI 2) - TIẾNG ANH 8 GLOBAL SUCCESS (2 CỘT) N...
 

R Programming Unit 3 part-1

  • 1. GRAPHICAL ANALYSIS 2/20/2021 VIKRAM NEERUGATTI, PROF. & HOD, DEPT. OF CSE, AUDISANKARA INSTITUTE OF TECHNOLOGY, GUDURU. 1
  • 2. CREDITS 2/20/2021 VIKRAM NEERUGATTI, PROF. & HOD, DEPT. OF CSE, AUDISANKARA INSTITUTE OF TECHNOLOGY, GUDURU. 2 MRS sir Google
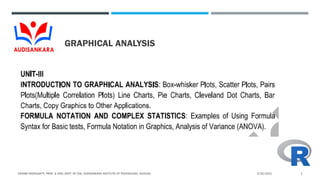
  • 3. CONTENT 2/20/2021 VIKRAM NEERUGATTI, PROF. & HOD, DEPT. OF CSE, AUDISANKARA INSTITUTE OF TECHNOLOGY, GUDURU. 3  Introduction  Graphical Analysis  Box-whisker plots  Scatter plots  Pairs Plots  Line Charts  Pie charts  Cleveland Dot Charts  Bar Charts  Copy Graphics to other Applications
  • 4. INTRODUCTION-GRAPHICAL ANALYSIS 2/20/2021 VIKRAM NEERUGATTI, PROF. & HOD, DEPT. OF CSE, AUDISANKARA INSTITUTE OF TECHNOLOGY, GUDURU. 4 Graphical Analysis is a tool for science students to collect, graph, and analyze data. The primary advantages of graphical representation of data are: Facilitates and improves learning: graphics make data easy to understand and eliminate language and literacy barriers. Understanding content: visuals are more effective than text in human understanding.
  • 5. BOX-WHISKER PLOTS 2/20/2021 VIKRAM NEERUGATTI, PROF. & HOD, DEPT. OF CSE, AUDISANKARA INSTITUTE OF TECHNOLOGY, GUDURU. 5
  • 6. BOX-WHISKER PLOTS 2/20/2021 VIKRAM NEERUGATTI, PROF. & HOD, DEPT. OF CSE, AUDISANKARA INSTITUTE OF TECHNOLOGY, GUDURU. 6
  • 7. SCATTER PLOTS 2/20/2021 VIKRAM NEERUGATTI, PROF. & HOD, DEPT. OF CSE, AUDISANKARA INSTITUTE OF TECHNOLOGY, GUDURU. 7 Scatterplots show many points plotted in the Cartesian plane. Each point represents the values of two variables. One variable is chosen in the horizontal axis and another in the vertical axis. The simple scatterplot is created using the plot() function.
  • 8. SCATTER PLOTS 2/20/2021 VIKRAM NEERUGATTI, PROF. & HOD, DEPT. OF CSE, AUDISANKARA INSTITUTE OF TECHNOLOGY, GUDURU. 8
  • 9. SCATTER PLOTS 2/20/2021 VIKRAM NEERUGATTI, PROF. & HOD, DEPT. OF CSE, AUDISANKARA INSTITUTE OF TECHNOLOGY, GUDURU. 9
  • 10. PAIRS PLOTS 2/20/2021 VIKRAM NEERUGATTI, PROF. & HOD, DEPT. OF CSE, AUDISANKARA INSTITUTE OF TECHNOLOGY, GUDURU. 10 The pairs plot is a grid of scatterplots. showing the bivariate relationships between all pairs of variables in a multivariate dataset.
  • 11. PAIRS PLOTS 2/20/2021 VIKRAM NEERUGATTI, PROF. & HOD, DEPT. OF CSE, AUDISANKARA INSTITUTE OF TECHNOLOGY, GUDURU. 11
  • 12. LINE CHARTS 2/20/2021 VIKRAM NEERUGATTI, PROF. & HOD, DEPT. OF CSE, AUDISANKARA INSTITUTE OF TECHNOLOGY, GUDURU. 12 A line chart is a graph that connects a series of points by drawing line segments between them. These points are ordered in one of their coordinate (usually the x-coordinate) value. Line charts are usually used in identifying the trends in data. The plot() function in R is used to create the line graph
  • 13. LINE CHARTS 2/20/2021 VIKRAM NEERUGATTI, PROF. & HOD, DEPT. OF CSE, AUDISANKARA INSTITUTE OF TECHNOLOGY, GUDURU. 13
  • 14. PIE CHARTS 2/20/2021 VIKRAM NEERUGATTI, PROF. & HOD, DEPT. OF CSE, AUDISANKARA INSTITUTE OF TECHNOLOGY, GUDURU. 14 R Programming language has numerous libraries to create charts and graphs. A pie-chart is a representation of values as slices of a circle with different colors. The slices are labeled and the numbers corresponding to each slice is also represented in the chart. In R the pie chart is created using the pie() function which takes positive numbers as a vector input. The additional parameters are used to control labels, color, title etc
  • 15. PIE CHARTS 2/20/2021 VIKRAM NEERUGATTI, PROF. & HOD, DEPT. OF CSE, AUDISANKARA INSTITUTE OF TECHNOLOGY, GUDURU. 15
  • 16. PIE CHARTS 2/20/2021 VIKRAM NEERUGATTI, PROF. & HOD, DEPT. OF CSE, AUDISANKARA INSTITUTE OF TECHNOLOGY, GUDURU. 16
  • 17. CLEVELAND DOT CHARTS 2/20/2021 VIKRAM NEERUGATTI, PROF. & HOD, DEPT. OF CSE, AUDISANKARA INSTITUTE OF TECHNOLOGY, GUDURU. 17 dotchart() function in R Language is used to create a dot chart of the specified data. A dot chart is defined as a plot which is used to draw a Cleveland dot plot.
  • 18. CLEVELAND DOT CHARTS 2/20/2021 VIKRAM NEERUGATTI, PROF. & HOD, DEPT. OF CSE, AUDISANKARA INSTITUTE OF TECHNOLOGY, GUDURU. 18
  • 19. CLEVELAND DOT CHARTS 2/20/2021 VIKRAM NEERUGATTI, PROF. & HOD, DEPT. OF CSE, AUDISANKARA INSTITUTE OF TECHNOLOGY, GUDURU. 19
  • 20. BAR CHARTS 2/20/2021 VIKRAM NEERUGATTI, PROF. & HOD, DEPT. OF CSE, AUDISANKARA INSTITUTE OF TECHNOLOGY, GUDURU. 20 A bar chart represents data in rectangular bars with length of the bar proportional to the value of the variable. R uses the function barplot() to create bar charts. R can draw both vertical and Horizontal bars in the bar chart. In bar chart each of the bars can be given different colors
  • 21. BAR CHARTS 2/20/2021 VIKRAM NEERUGATTI, PROF. & HOD, DEPT. OF CSE, AUDISANKARA INSTITUTE OF TECHNOLOGY, GUDURU. 21
  • 22. BAR CHARTS 2/20/2021 VIKRAM NEERUGATTI, PROF. & HOD, DEPT. OF CSE, AUDISANKARA INSTITUTE OF TECHNOLOGY, GUDURU. 22
  • 23. COPY GRAPHICS TO OTHER APPLICATIONS 2/20/2021 VIKRAM NEERUGATTI, PROF. & HOD, DEPT. OF CSE, AUDISANKARA INSTITUTE OF TECHNOLOGY, GUDURU. 23 Plots panel –> Export –> Save as Image or Save as PDF
  • 24. COPY GRAPHICS TO OTHER APPLICATIONS 2/20/2021 VIKRAM NEERUGATTI, PROF. & HOD, DEPT. OF CSE, AUDISANKARA INSTITUTE OF TECHNOLOGY, GUDURU. 24 It's also possible to save the graph using R codes as follow: Specify files to save your image using a function such as jpeg(), png(), svg() or pdf(). Additional argument indicating the width and the height of the image can be also used. Create the plot.
  • 25. COPY GRAPHICS TO OTHER APPLICATIONS 2/20/2021 VIKRAM NEERUGATTI, PROF. & HOD, DEPT. OF CSE, AUDISANKARA INSTITUTE OF TECHNOLOGY, GUDURU. 25
  • 26. SUMMARY 2/20/2021 VIKRAM NEERUGATTI, PROF. & HOD, DEPT. OF CSE, AUDISANKARA INSTITUTE OF TECHNOLOGY, GUDURU. 26  Introduction  Graphical Analysis  Box-whisker plots  Scatter plots  Pairs Plots  Line Charts  Pie charts  Cleveland Dot Charts  Bar Charts  Copy Graphics to other Applications
  • 27. ANY CLARIFICATIONS? 2/20/2021 VIKRAM NEERUGATTI, PROF. & HOD, DEPT. OF CSE, AUDISANKARA INSTITUTE OF TECHNOLOGY, GUDURU. 27
  • 28. THANK YOU 2/20/2021 VIKRAM NEERUGATTI, PROF. & HOD, DEPT. OF CSE, AUDISANKARA INSTITUTE OF TECHNOLOGY, GUDURU. 28