Download as PDF, PPTX


![R as a Calculator
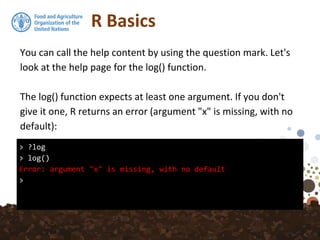
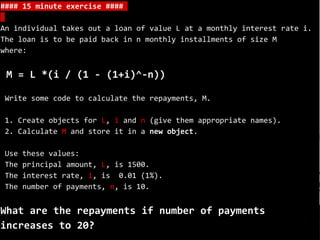
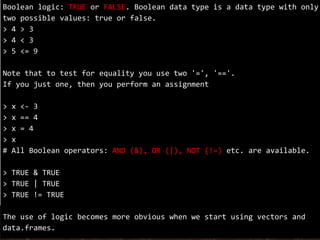
> 6 + 98
[1] 104
> 90 * 44
[1] 3960
> 36 / 2
[1] 18
> 33 - 30
[1] 3
The most basic use of R is to use it as a simple calculator.
For example, enter:](https://image.slidesharecdn.com/ir-d21-rbasics-180321133114/85/R-basics-4-320.jpg)
![R as a Calculator
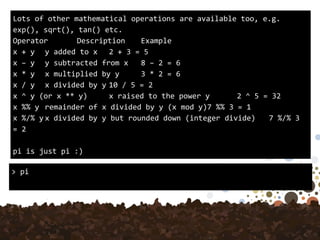
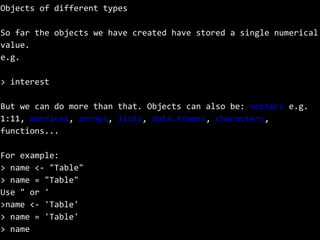
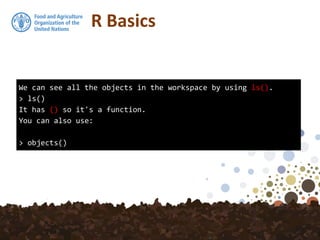
> 1:40
[1] 1 2 3 4 5 6 7 8 9 10 11 12 13 14 15 16 17
[18] 18 19 20 21 22 23 24 25 26 27 28 29 30 31 32 33 34
[35] 35 36 37 38 39 40
You should see the result of the calculation as well as [1].
The [1] means first result. In this example it is the only
result. Other commands return multiple values. For
example, we can create a simple vector of values from 1
to 40 using:](https://image.slidesharecdn.com/ir-d21-rbasics-180321133114/85/R-basics-5-320.jpg)
![R as a Calculator
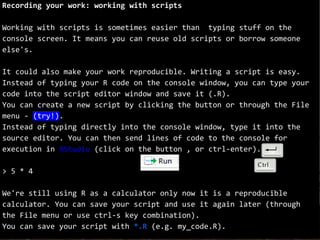
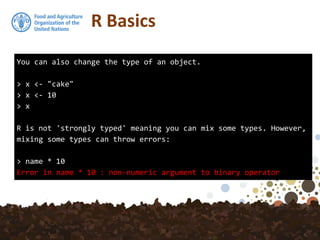
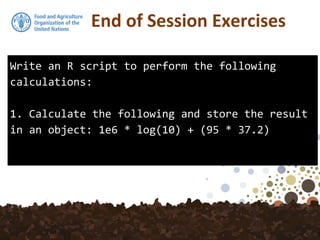
> 3 * 5
[1] 15
> 3 - 8
[1] -5
> 12 / 4
[1] 3
> 23 + 34
[1] 57
Most of R commands deal with vectors and it is one of its
strengths - We shall see more of them soon.
Of course, R has all the basic mathematical operators. *
is used for multiplication, + for addition, / is for division, -
is for subtraction.](https://image.slidesharecdn.com/ir-d21-rbasics-180321133114/85/R-basics-6-320.jpg)
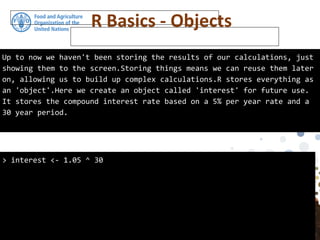
![R Basics
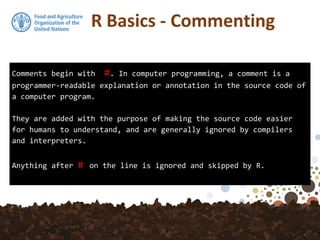
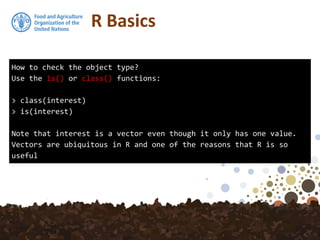
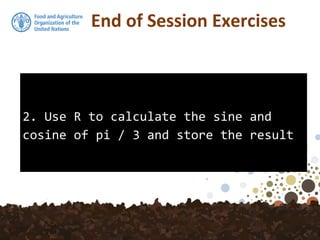
> 12 * 56 + 34
[1] 706
> 12 * (56 + 34)
[1] 1080
The order of precedence is standard and can be
controlled using parenthesis.
For example,](https://image.slidesharecdn.com/ir-d21-rbasics-180321133114/85/R-basics-8-320.jpg)
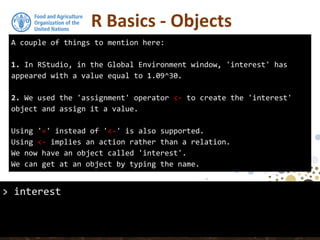
![R Basics
> 3^2
[1] 9
> 12 %% 3
[1] 0
> 10 %% 3
[1] 1
> 10 %/% 3
[1] 3
You may use the symbol "^" to denote exponentiation 'little
hat'.We can also calculate the remainder, or modular, using
%%: Notice that the operators %% and %/% for integer
remainder and divide have higher precedence than multiply
and divide:](https://image.slidesharecdn.com/ir-d21-rbasics-180321133114/85/R-basics-9-320.jpg)
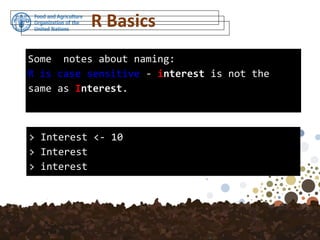
![R Basics
> 1e2
[1] 100
> 1e3
[1] 1000
> 1e5
[1] 1e+05
Scientific notation is dealt with using e.](https://image.slidesharecdn.com/ir-d21-rbasics-180321133114/85/R-basics-10-320.jpg)
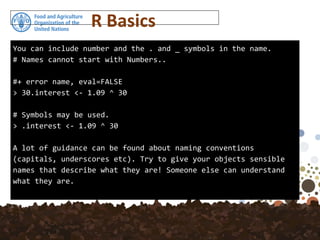
![Trigonometric Functions
These functions give the obvious trigonometric functions.
They respectively compute the cosine, sine, tangent,
arc-cosine, arc-sine, arc-tangent, and the two-argument
arctangent.
So, you may want to try to calculate the cosine of an
angle of 120 degrees like this:
> cos(120)
[1] 0.814181](https://image.slidesharecdn.com/ir-d21-rbasics-180321133114/85/R-basics-17-320.jpg)
![Trigonometric Functions
> cos(120)
[1] 0.814181
This code doesn’t give you the correct result,
however, because R always works with
angles in radians, not in degrees. Pay
attention to this fact; if you forget, the
resulting bugs may bite you hard!](https://image.slidesharecdn.com/ir-d21-rbasics-180321133114/85/R-basics-18-320.jpg)
![Trigonometric Functions
> cos(120*pi/180)
[1] -0.5
The correct way to calculate the cosine of an
angle of 120 degrees, then, is this:
(1 rad = 180°/π)](https://image.slidesharecdn.com/ir-d21-rbasics-180321133114/85/R-basics-19-320.jpg)
![R Basics
There are also some special values to be aware of:
Missing value indicator!
In R, missing values are represented by the symbol NA (Not
Available).
Impossible values (e.g., dividing by zero) are represented by
the symbol NaN (not a number). Unlike SAS, R uses the same
symbol for character and numeric data.
> 0/0
[1] NaN
> 4/0
[1] Inf](https://image.slidesharecdn.com/ir-d21-rbasics-180321133114/85/R-basics-20-320.jpg)
![R Basics - NA
NA Can be very common when reading in your data.
It is important to note that NA does not mean 0!
Also, NAs propagate through calculations, for example:
> 3 + NA
[1] NA](https://image.slidesharecdn.com/ir-d21-rbasics-180321133114/85/R-basics-21-320.jpg)
![R Basics
Incomplete commands!
If a command is incomplete, for example you don't' close a
parenthesis, R lets you know by displaying +:
+ missing bracket, eval=FALSE
> (2 + 3) * (3 + 1
+ )
[1] 20](https://image.slidesharecdn.com/ir-d21-rbasics-180321133114/85/R-basics-22-320.jpg)


The document outlines a training session on using R for digital soil organic carbon mapping, focusing on basic calculations and R syntax. It introduces fundamental R functionalities, such as creating objects, performing arithmetic operations, understanding data types, and using functions. Additionally, exercises are provided to reinforce learning by applying these concepts to practical scenarios.


![Basics of R programming for analytics [Autosaved] (1).pdf](https://cdn.slidesharecdn.com/ss_thumbnails/basicsofrprogrammingforanalyticsautosaved1-240916080545-0682f8c8-thumbnail.jpg?width=640&height=640&fit=bounds)