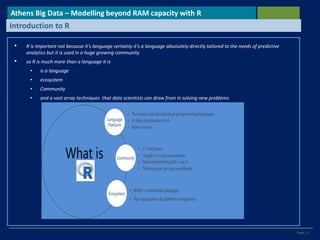
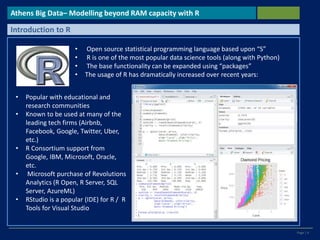
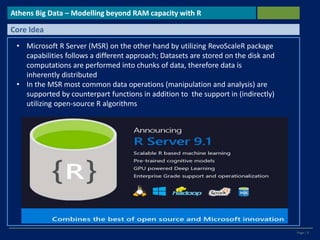
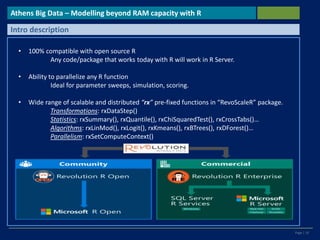
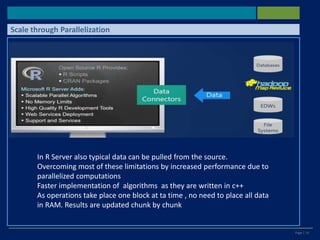
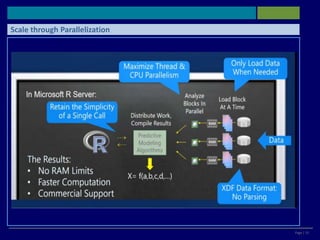
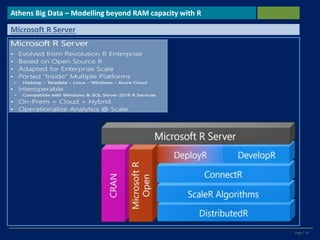
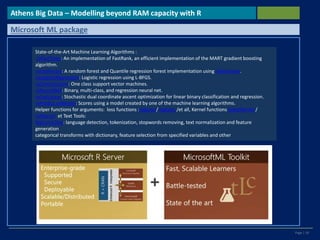
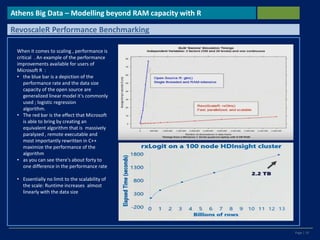
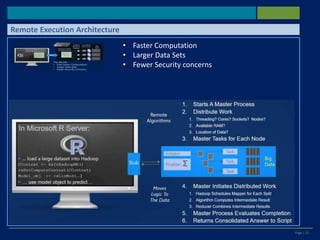
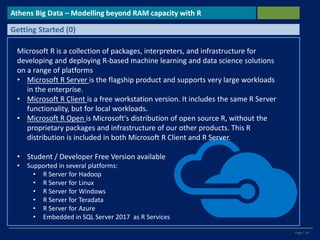
Analytics Beyond RAM Capacity
using R
Dr. Alex Palamides
Athens Big Data Meetup
September 19th 2017
Page | 2
• R is important not because it's language certainly it's a language absolutely directly tailored to the needs of predictive
analytics but it is used in a huge growing community
• so R is much more than a language it is
• is a language
• ecosystem
• Community
• and a vast array techniques that data scientists can draw from in solving new problems
Athens Big Data – Modelling beyond RAM capacity with R
Introduction to R
Page | 3
Athens Big Data– Modelling beyond RAM capacity with R
Introduction to R
R ranks #5 in IEEE Spectrum 2016 while two years ago R was ranking 9th
Page | 4
Athens Big Data– Modelling beyond RAM capacity with R
Introduction to R
• Open source statistical programming language based upon “S”
• R is one of the most popular data science tools (along with Python)
• The base functionality can be expanded using “packages”
• The usage of R has dramatically increased over recent years:
• Popular with educational and
research communities
• Known to be used at many of the
leading tech firms (Airbnb,
Facebook, Google, Twitter, Uber,
etc.)
• R Consortium support from
Google, IBM, Microsoft, Oracle,
etc.
• Microsoft purchase of Revolutions
Analytics (R Open, R Server, SQL
Server, AzureML)
• RStudio is a popular (IDE) for R / R
Tools for Visual Studio
Page | 5
Athens Big Data – Modelling beyond RAM capacity with R
Introduction to R – Data handling / visualization
• Common file formats are easily read into R
– library(data.table), fread(…) for CSV or text files (as an alternative to
read.csv(…))
– library(readxl) for Excel
– library(haven) for SAS datasets
• Access and submit SQL queries using ODBC and library(dplyr)
• Data is usually stored in a data.frame
object
Two main packages are used for
processing data in R
– library(dplyr) uses action verbs to act
upon data frames
– library(data.table) is faster and more
powerful however the syntax is more
challenging to learn
• library(ggplot2) is a very popular
graphics package for R
Page | 6
Athens Big Data – Modelling beyond RAM capacity with R
Introduction to R – Model Building
• glm(…) to bulit generalized models . Commonly
use for logistic Regression
• Use step(…) to execute stepwise regression
• lm for linear regression
• Rpart (…) for CART trees
• RandomForest (…) for RF Trees
• Knn(…) for K- Nearest Neighbourhood
• Nnet(…) for neural networks
• rcorr.cens(…) for Gini Coefficient
• caret::R2 for R squared and model
• tuning And so on…
• In general there are multiple ways to create
models due to the open source community
Page | 7
Athens Big Data – Modelling beyond RAM capacity with R
R– Limitations and Solutions
• In-Memory Operation
• Lack of Parallelism
• Expensive Data Movement &
Duplication
Couple of scalable R solutions:
• Choose R packages with big data support on single machines
• The “bigmemory” project
• “ff” and related packages
• Scale from single machines to distributed computing
• SparkR
• sparklyr
• RevoScaleR (Microsoft R Server)
and more!
Page | 8
Athens Big Data – Modelling beyond RAM capacity with R
R– Limitations and Solutions
MSR is a family of R based products that live both independently and inside a SQL server
database and other platforms. They give users a multiplicity of methods by which take Data in
the organization , they apply predictive analytics to develop learning and insight and deploy that
directly as applications usable by the business on which they can take direct action
Page | 9
Athens Big Data – Modelling beyond RAM capacity with R
Core Idea
• Microsoft R Server (MSR) on the other hand by utilizing RevoScaleR package
capabilities follows a different approach; Datasets are stored on the disk and
computations are performed into chunks of data, therefore data is
inherently distributed
• In the MSR most common data operations (manipulation and analysis) are
supported by counterpart functions in addition to the support in (indirectly)
utilizing open-source R algorithms
Page | 10
Athens Big Data – Modelling beyond RAM capacity with R
Intro description
• 100% compatible with open source R
Any code/package that works today with R will work in R Server.
• Ability to parallelize any R function
Ideal for parameter sweeps, simulation, scoring.
• Wide range of scalable and distributed “rx” pre-fixed functions in “RevoScaleR” package.
Transformations: rxDataStep()
Statistics: rxSummary(), rxQuantile(), rxChiSquaredTest(), rxCrossTabs()…
Algorithms: rxLinMod(), rxLogit(), rxKmeans(), rxBTrees(), rxDForest()…
Parallelism: rxSetComputeContext()
Page | 11
Athens Big Data – Modelling beyond RAM capacity with R
Microsoft R Open ( the Interpreter)
Increased Performance and
scalability through
parallelization and streaming
Page | 12
Athens Big Data – Modelling beyond RAM capacity with R
Microsoft R Server Components
Page | 13
R Open – Traditional Connection to a DB
Page | 14
Scale through Parallelization
In R Server also typical data can be pulled from the source.
Overcoming most of these limitations by increased performance due to
parallelized computations
Faster implementation of algorithms as they are written in c++
As operations take place one block at ta time , no need to place all data
in RAM. Results are updated chunk by chunk
Page | 15
Scale through Parallelization
Page | 16
Athens Big Data – Modelling beyond RAM capacity with R
Microsoft R Server
Page | 17
Athens Big Data – Modelling beyond RAM capacity with R
Functions rebuilt to ensure high performance.
Page | 18
State-of-the-Art Machine Learning Algorithms :
rxFastTrees: An implementation of FastRank, an efficient implementation of the MART gradient boosting
algorithm.
rxFastForest: A random forest and Quantile regression forest implementation using rxFastTrees.
rxLogisticRegression: Logistic regression using L-BFGS.
rxOneClassSvm: One class support vector machines.
rxNeuralNet: Binary, multi-class, and regression neural net.
rxFastLinear: Stochastic dual coordinate ascent optimization for linear binary classification and regression.
rxPredict.mlModel: Scores using a model created by one of the machine learning algorithms.
Helper functions for arguments: loss functions :expLoss/ logLoss /et all, Kernel functions linearKernel /
rbfKernel et Text Tools:
featurizeText: language detection, tokenization, stopwords removing, text normalization and feature
generation
categorical transforms with dictionary, feature selection from specified variables and other
Athens Big Data – Modelling beyond RAM capacity with R
Microsoft ML package
Page | 19
Athens Big Data – Modelling beyond RAM capacity with R
RevoscaleR Performance Benchmarking
When it comes to scaling , performance is
critical . An example of the performance
improvements available for users of
Microsoft R :
• the blue bar is a depiction of the
performance rate and the data size
capacity of the open source are
generalized linear model it's commonly
used ; logistic regression
algorithm.
• The red bar is the effect that Microsoft
is able to bring by creating an
equivalent algorithm that is massively
paralyzed , remote executable and
most importantly rewritten in C++
maximize the performance of the
algorithm
• as you can see there's about forty to
one difference in the performance rate
• Essentially no limit to the scalability of
the scale: Runtime increases almost
linearly with the data size
Page | 20
Coding Example ( local Execution)
Page | 21
Remote Execution
Page | 22
Remote Execution Architecture
• Faster Computation
• Larger Data Sets
• Fewer Security concerns
Page | 23
Coding Example ( Remote Execution)
Page | 24
Athens Big Data – Modelling beyond RAM capacity with R
Getting Started (0)
Microsoft R is a collection of packages, interpreters, and infrastructure for
developing and deploying R-based machine learning and data science solutions
on a range of platforms
• Microsoft R Server is the flagship product and supports very large workloads
in the enterprise.
• Microsoft R Client is a free workstation version. It includes the same R Server
functionality, but for local workloads.
• Microsoft R Open is Microsoft's distribution of open source R, without the
proprietary packages and infrastructure of our other products. This R
distribution is included in both Microsoft R Client and R Server.
• Student / Developer Free Version available
• Supported in several platforms:
• R Server for Hadoop
• R Server for Linux
• R Server for Windows
• R Server for Teradata
• R Server for Azure
• Embedded in SQL Server 2017 as R Services
Page | 25
• Data import and exploration :
• mysource <- file.path(rxGetOption("sampleDataDir"), "AirlineDemoSmall.csv") ## point to the source file
• airXdfData <- rxImport(inData=mysource) # import the file as data frame- be careful of data limitation issues#
• airXdfData <- rxImport(inData=mysource, outFile="c:/Users/Temp/airExample.xdf") # import as XDF , i.e., store the
# file in the hard drive
• An .xdf file is a binary file format native to Microsoft R, used for persisting data on disk. An .xdf file is column-based,
one column per variable, which is optimum for the variable orientation of data used in statistics and predictive .
includes precomputed metadata that is immediately available with no additional processing analytics.
• Examine object metadata:
• rxGetInfo(airXdfData, getVarInfo = TRUE) #
• For example : rxGetInfo(airXdfData) results in :
Variable information: Var 1: ArrDelay 702 factor levels: 6 -8 -2 1 -14 ... 451 430 597 513 432
Var 2: CRSDepTime, Type: numeric, Storage: float32, Low/High: (0.0167, 23.9833)
Var 3: DayOfWeek 7 factor levels: Monday Tuesday Wednesday Thursday Friday Saturday Sunday
• Summarize data :
• rxSummary(~ArrDelay+CRSDepTime+DayOfWeek, data=airXdfData)
• Number of valid observations:
• Statistics (mean , StdDev etc) for numerical variables
• Counts per level for categorial variables
• rxSummary(formula = ~ArrDelay:DayOfWeek, data=airXdfData) # Statistics by category
Getting Started (1)
Page | 26
• Data transformations - One function to rule them all :
• All transformations are performed via the rxDataStep command
• airXdfData <- rxDataStep(inData = airXdfData, outFile = "c:/Users/Temp/airExample.xdf",
transforms=list(VeryLate = (ArrDelay > 120 | is.na(ArrDelay))), overwrite = TRUE)
• A full RevoScaleR data step consists of the following steps:+
• Read in the data a block (200,000 rows) at a time.
• For each block, pass the ArrDelay data to the R interpreter for processing the transformation to
create VeryLate.
• Write the data out to the dataset a block at a time. The argument overwrite=TRUE allows us to
overwrite the data file.
• From XDF to data frame :
• myData <- rxDataStep(inData = airXdfData, rowSelection = ArrDelay > 240 & ArrDelay <= 300, varsToKeep
= c("ArrDelay", "DayOfWeek"))
• Subseting :
• rxReadXdf(airXdfData, numRows=10, startRow=100000)
• Visualizations :
• rxHistogram(~ArrDelay, data = myData)
Getting Started (2)
Page | 27
• Modelling :
• rxLinMod(formula = ArrDelay ~ DayOfWeek, data = airXdfData) # simple linear regression
• arrDelayLm3 <- rxLinMod(ArrDelay ~ DayOfWeek:F(CRSDepTime), data = airXdfData, cube = TRUE)
# interaction and on the fly factor conversion
• myTab <- rxCrossTabs(ArrDelay~DayOfWeek, data = airLateDS) ## Tabulation by gou
• logitObj <- rxLogit(Late~DepHour + Night, data = airExtraDS) logistic regression
• predictDS <- rxPredict(modelObject = logitObj, data = airExtraDS, outData = airExtraDS) #
Predictions from model objects
• Modelling Using a Compute Cluster :
• myCluster <- RxSparkConnect(nameNode = "my-name-service-server", port = 8020)
• rxSetComputeContext(myCluster)
• With your compute context set to the cluster, all of the RevoScaleR data analysis functions automatically
distribute computations across the nodes of the cluster
• delayCarrierLocDist <- rxLinMod(ArrDelay ~ UniqueCarrier+Origin+Dest, data = dataFile, cube = TRUE,
blocksPerRead = 30) # # Regresssion runs in the clusters
• rxSetComputeContext("local")) # reset compute context back to the local machine
• And many more applicable in various operation types: RxXdf Data, rxFactors rxSplit, rxMerge, rxRocCurve
, rxDTree ,, rxKmeans ,rxDForest , rxNaiveBayes , RxHadoopMR , RxSpark , RxInTeradata , RxInSqlServer ,
RxLocalParallel , rxExec
Getting Started (3)
Page | 28
Thank you!
Analytics Beyond RAM Capacity using R Athens Big Data
Meetup September 19th 2017
Dr. Alex Palamides
www.linkedin.com/in/alex-palamides
palamid@gmail.com
Contact Details

Analytics Beyond RAM Capacity using R

  • 1.
    Analytics Beyond RAMCapacity using R Dr. Alex Palamides Athens Big Data Meetup September 19th 2017
  • 2.
    Page | 2 •R is important not because it's language certainly it's a language absolutely directly tailored to the needs of predictive analytics but it is used in a huge growing community • so R is much more than a language it is • is a language • ecosystem • Community • and a vast array techniques that data scientists can draw from in solving new problems Athens Big Data – Modelling beyond RAM capacity with R Introduction to R
  • 3.
    Page | 3 AthensBig Data– Modelling beyond RAM capacity with R Introduction to R R ranks #5 in IEEE Spectrum 2016 while two years ago R was ranking 9th
  • 4.
    Page | 4 AthensBig Data– Modelling beyond RAM capacity with R Introduction to R • Open source statistical programming language based upon “S” • R is one of the most popular data science tools (along with Python) • The base functionality can be expanded using “packages” • The usage of R has dramatically increased over recent years: • Popular with educational and research communities • Known to be used at many of the leading tech firms (Airbnb, Facebook, Google, Twitter, Uber, etc.) • R Consortium support from Google, IBM, Microsoft, Oracle, etc. • Microsoft purchase of Revolutions Analytics (R Open, R Server, SQL Server, AzureML) • RStudio is a popular (IDE) for R / R Tools for Visual Studio
  • 5.
    Page | 5 AthensBig Data – Modelling beyond RAM capacity with R Introduction to R – Data handling / visualization • Common file formats are easily read into R – library(data.table), fread(…) for CSV or text files (as an alternative to read.csv(…)) – library(readxl) for Excel – library(haven) for SAS datasets • Access and submit SQL queries using ODBC and library(dplyr) • Data is usually stored in a data.frame object Two main packages are used for processing data in R – library(dplyr) uses action verbs to act upon data frames – library(data.table) is faster and more powerful however the syntax is more challenging to learn • library(ggplot2) is a very popular graphics package for R
  • 6.
    Page | 6 AthensBig Data – Modelling beyond RAM capacity with R Introduction to R – Model Building • glm(…) to bulit generalized models . Commonly use for logistic Regression • Use step(…) to execute stepwise regression • lm for linear regression • Rpart (…) for CART trees • RandomForest (…) for RF Trees • Knn(…) for K- Nearest Neighbourhood • Nnet(…) for neural networks • rcorr.cens(…) for Gini Coefficient • caret::R2 for R squared and model • tuning And so on… • In general there are multiple ways to create models due to the open source community
  • 7.
    Page | 7 AthensBig Data – Modelling beyond RAM capacity with R R– Limitations and Solutions • In-Memory Operation • Lack of Parallelism • Expensive Data Movement & Duplication Couple of scalable R solutions: • Choose R packages with big data support on single machines • The “bigmemory” project • “ff” and related packages • Scale from single machines to distributed computing • SparkR • sparklyr • RevoScaleR (Microsoft R Server) and more!
  • 8.
    Page | 8 AthensBig Data – Modelling beyond RAM capacity with R R– Limitations and Solutions MSR is a family of R based products that live both independently and inside a SQL server database and other platforms. They give users a multiplicity of methods by which take Data in the organization , they apply predictive analytics to develop learning and insight and deploy that directly as applications usable by the business on which they can take direct action
  • 9.
    Page | 9 AthensBig Data – Modelling beyond RAM capacity with R Core Idea • Microsoft R Server (MSR) on the other hand by utilizing RevoScaleR package capabilities follows a different approach; Datasets are stored on the disk and computations are performed into chunks of data, therefore data is inherently distributed • In the MSR most common data operations (manipulation and analysis) are supported by counterpart functions in addition to the support in (indirectly) utilizing open-source R algorithms
  • 10.
    Page | 10 AthensBig Data – Modelling beyond RAM capacity with R Intro description • 100% compatible with open source R Any code/package that works today with R will work in R Server. • Ability to parallelize any R function Ideal for parameter sweeps, simulation, scoring. • Wide range of scalable and distributed “rx” pre-fixed functions in “RevoScaleR” package. Transformations: rxDataStep() Statistics: rxSummary(), rxQuantile(), rxChiSquaredTest(), rxCrossTabs()… Algorithms: rxLinMod(), rxLogit(), rxKmeans(), rxBTrees(), rxDForest()… Parallelism: rxSetComputeContext()
  • 11.
    Page | 11 AthensBig Data – Modelling beyond RAM capacity with R Microsoft R Open ( the Interpreter) Increased Performance and scalability through parallelization and streaming
  • 12.
    Page | 12 AthensBig Data – Modelling beyond RAM capacity with R Microsoft R Server Components
  • 13.
    Page | 13 ROpen – Traditional Connection to a DB
  • 14.
    Page | 14 Scalethrough Parallelization In R Server also typical data can be pulled from the source. Overcoming most of these limitations by increased performance due to parallelized computations Faster implementation of algorithms as they are written in c++ As operations take place one block at ta time , no need to place all data in RAM. Results are updated chunk by chunk
  • 15.
    Page | 15 Scalethrough Parallelization
  • 16.
    Page | 16 AthensBig Data – Modelling beyond RAM capacity with R Microsoft R Server
  • 17.
    Page | 17 AthensBig Data – Modelling beyond RAM capacity with R Functions rebuilt to ensure high performance.
  • 18.
    Page | 18 State-of-the-ArtMachine Learning Algorithms : rxFastTrees: An implementation of FastRank, an efficient implementation of the MART gradient boosting algorithm. rxFastForest: A random forest and Quantile regression forest implementation using rxFastTrees. rxLogisticRegression: Logistic regression using L-BFGS. rxOneClassSvm: One class support vector machines. rxNeuralNet: Binary, multi-class, and regression neural net. rxFastLinear: Stochastic dual coordinate ascent optimization for linear binary classification and regression. rxPredict.mlModel: Scores using a model created by one of the machine learning algorithms. Helper functions for arguments: loss functions :expLoss/ logLoss /et all, Kernel functions linearKernel / rbfKernel et Text Tools: featurizeText: language detection, tokenization, stopwords removing, text normalization and feature generation categorical transforms with dictionary, feature selection from specified variables and other Athens Big Data – Modelling beyond RAM capacity with R Microsoft ML package
  • 19.
    Page | 19 AthensBig Data – Modelling beyond RAM capacity with R RevoscaleR Performance Benchmarking When it comes to scaling , performance is critical . An example of the performance improvements available for users of Microsoft R : • the blue bar is a depiction of the performance rate and the data size capacity of the open source are generalized linear model it's commonly used ; logistic regression algorithm. • The red bar is the effect that Microsoft is able to bring by creating an equivalent algorithm that is massively paralyzed , remote executable and most importantly rewritten in C++ maximize the performance of the algorithm • as you can see there's about forty to one difference in the performance rate • Essentially no limit to the scalability of the scale: Runtime increases almost linearly with the data size
  • 20.
    Page | 20 CodingExample ( local Execution)
  • 21.
  • 22.
    Page | 22 RemoteExecution Architecture • Faster Computation • Larger Data Sets • Fewer Security concerns
  • 23.
    Page | 23 CodingExample ( Remote Execution)
  • 24.
    Page | 24 AthensBig Data – Modelling beyond RAM capacity with R Getting Started (0) Microsoft R is a collection of packages, interpreters, and infrastructure for developing and deploying R-based machine learning and data science solutions on a range of platforms • Microsoft R Server is the flagship product and supports very large workloads in the enterprise. • Microsoft R Client is a free workstation version. It includes the same R Server functionality, but for local workloads. • Microsoft R Open is Microsoft's distribution of open source R, without the proprietary packages and infrastructure of our other products. This R distribution is included in both Microsoft R Client and R Server. • Student / Developer Free Version available • Supported in several platforms: • R Server for Hadoop • R Server for Linux • R Server for Windows • R Server for Teradata • R Server for Azure • Embedded in SQL Server 2017 as R Services
  • 25.
    Page | 25 •Data import and exploration : • mysource <- file.path(rxGetOption("sampleDataDir"), "AirlineDemoSmall.csv") ## point to the source file • airXdfData <- rxImport(inData=mysource) # import the file as data frame- be careful of data limitation issues# • airXdfData <- rxImport(inData=mysource, outFile="c:/Users/Temp/airExample.xdf") # import as XDF , i.e., store the # file in the hard drive • An .xdf file is a binary file format native to Microsoft R, used for persisting data on disk. An .xdf file is column-based, one column per variable, which is optimum for the variable orientation of data used in statistics and predictive . includes precomputed metadata that is immediately available with no additional processing analytics. • Examine object metadata: • rxGetInfo(airXdfData, getVarInfo = TRUE) # • For example : rxGetInfo(airXdfData) results in : Variable information: Var 1: ArrDelay 702 factor levels: 6 -8 -2 1 -14 ... 451 430 597 513 432 Var 2: CRSDepTime, Type: numeric, Storage: float32, Low/High: (0.0167, 23.9833) Var 3: DayOfWeek 7 factor levels: Monday Tuesday Wednesday Thursday Friday Saturday Sunday • Summarize data : • rxSummary(~ArrDelay+CRSDepTime+DayOfWeek, data=airXdfData) • Number of valid observations: • Statistics (mean , StdDev etc) for numerical variables • Counts per level for categorial variables • rxSummary(formula = ~ArrDelay:DayOfWeek, data=airXdfData) # Statistics by category Getting Started (1)
  • 26.
    Page | 26 •Data transformations - One function to rule them all : • All transformations are performed via the rxDataStep command • airXdfData <- rxDataStep(inData = airXdfData, outFile = "c:/Users/Temp/airExample.xdf", transforms=list(VeryLate = (ArrDelay > 120 | is.na(ArrDelay))), overwrite = TRUE) • A full RevoScaleR data step consists of the following steps:+ • Read in the data a block (200,000 rows) at a time. • For each block, pass the ArrDelay data to the R interpreter for processing the transformation to create VeryLate. • Write the data out to the dataset a block at a time. The argument overwrite=TRUE allows us to overwrite the data file. • From XDF to data frame : • myData <- rxDataStep(inData = airXdfData, rowSelection = ArrDelay > 240 & ArrDelay <= 300, varsToKeep = c("ArrDelay", "DayOfWeek")) • Subseting : • rxReadXdf(airXdfData, numRows=10, startRow=100000) • Visualizations : • rxHistogram(~ArrDelay, data = myData) Getting Started (2)
  • 27.
    Page | 27 •Modelling : • rxLinMod(formula = ArrDelay ~ DayOfWeek, data = airXdfData) # simple linear regression • arrDelayLm3 <- rxLinMod(ArrDelay ~ DayOfWeek:F(CRSDepTime), data = airXdfData, cube = TRUE) # interaction and on the fly factor conversion • myTab <- rxCrossTabs(ArrDelay~DayOfWeek, data = airLateDS) ## Tabulation by gou • logitObj <- rxLogit(Late~DepHour + Night, data = airExtraDS) logistic regression • predictDS <- rxPredict(modelObject = logitObj, data = airExtraDS, outData = airExtraDS) # Predictions from model objects • Modelling Using a Compute Cluster : • myCluster <- RxSparkConnect(nameNode = "my-name-service-server", port = 8020) • rxSetComputeContext(myCluster) • With your compute context set to the cluster, all of the RevoScaleR data analysis functions automatically distribute computations across the nodes of the cluster • delayCarrierLocDist <- rxLinMod(ArrDelay ~ UniqueCarrier+Origin+Dest, data = dataFile, cube = TRUE, blocksPerRead = 30) # # Regresssion runs in the clusters • rxSetComputeContext("local")) # reset compute context back to the local machine • And many more applicable in various operation types: RxXdf Data, rxFactors rxSplit, rxMerge, rxRocCurve , rxDTree ,, rxKmeans ,rxDForest , rxNaiveBayes , RxHadoopMR , RxSpark , RxInTeradata , RxInSqlServer , RxLocalParallel , rxExec Getting Started (3)
  • 28.
    Page | 28 Thankyou! Analytics Beyond RAM Capacity using R Athens Big Data Meetup September 19th 2017 Dr. Alex Palamides www.linkedin.com/in/alex-palamides palamid@gmail.com Contact Details

Editor's Notes

  • #13 DevelopeR IDE Deploy R is essentially a web services gateway that allows users to expose a web service through witch Bi tools , custom applications can invoce R scripts , run r modeles and retrivee results without knowing that they even call R. So R does not have to be installed in platforms that is not needed. ConnectR gives access to a variety of data sources like SAS or SPSS files and the ability to save files in a format called XDF which provides high degree of compression as well as fast data retrieval when needed. Distrubuted R also plays a supportive role for scaleR is normalizaion layer thath provides an abstract interface on top of whih the scale R algorithm can operate Te core is the algorithm provided by scaleR layer . Redesigned , written in c++ ,to provide parallelized compuation , loa data one bloak at atime , so to combat the memory constarints that we have refeered before. To provide the ability to execute algorithms in remote systems
  • #14 Pull data into R, ##load it into memory and run analysis. Lets see an example of a simple data pulling and analysis script. Extacted from the DB . High movement time Ram constraints in the enviroment of analysis Duplicating data betwwen analzed and BD versions causes typical problems
  • #15 In R Server also typical data can be pulled form the source. Overcoming most of these limitations by increased erformance to to paralllelized computations Faster implementation of algorithms as they are written in c++ As they operation takes place one block at ta time , no need to palce all data in RAM. Results are updated chunk by chunk
  • #16 Due to revoscaleR , the script remains simple, just a simple call But inside the Distributeed R compnent is utilized to identify how many cores, and threats are availiable , and allocate portions of work to each of these available resources. Analyze data in chunks# use of XDF FORMAT high performance : names stems form extrernal data format. It it typically 5 times smaller than a csv containing the same dataset. No parsing is required so the retrieval time is reduced significantly
  • #17 Open Source R – includes a number of enhacements and adaptations to provide the abaility to scale up in entrprise class level . Run R at speed in platforms like hadoop . Bulit scripts in one platformm- run and operotionalize In another . Thus write locally – run in the cloud. R server is pleload- prebuilt in the cloud Operaionalize means set something based n R . E.g. a scoring algorihm and expose those interfaces via web services to e consumed by all types of BI tools and applications
  • #22 Instead of pulling data , and do the work in house , there is the ability to push he work to the data repository. By the utilizing the remote excution capabilities
  • #23 Instead of running te linear rgresion locally, aramaeters are packaged in tub and passed this request object to the remote system. The remote system starts the master process , , and only the results are returned to the script. So : No data movement Platform independent work