Download to read offline

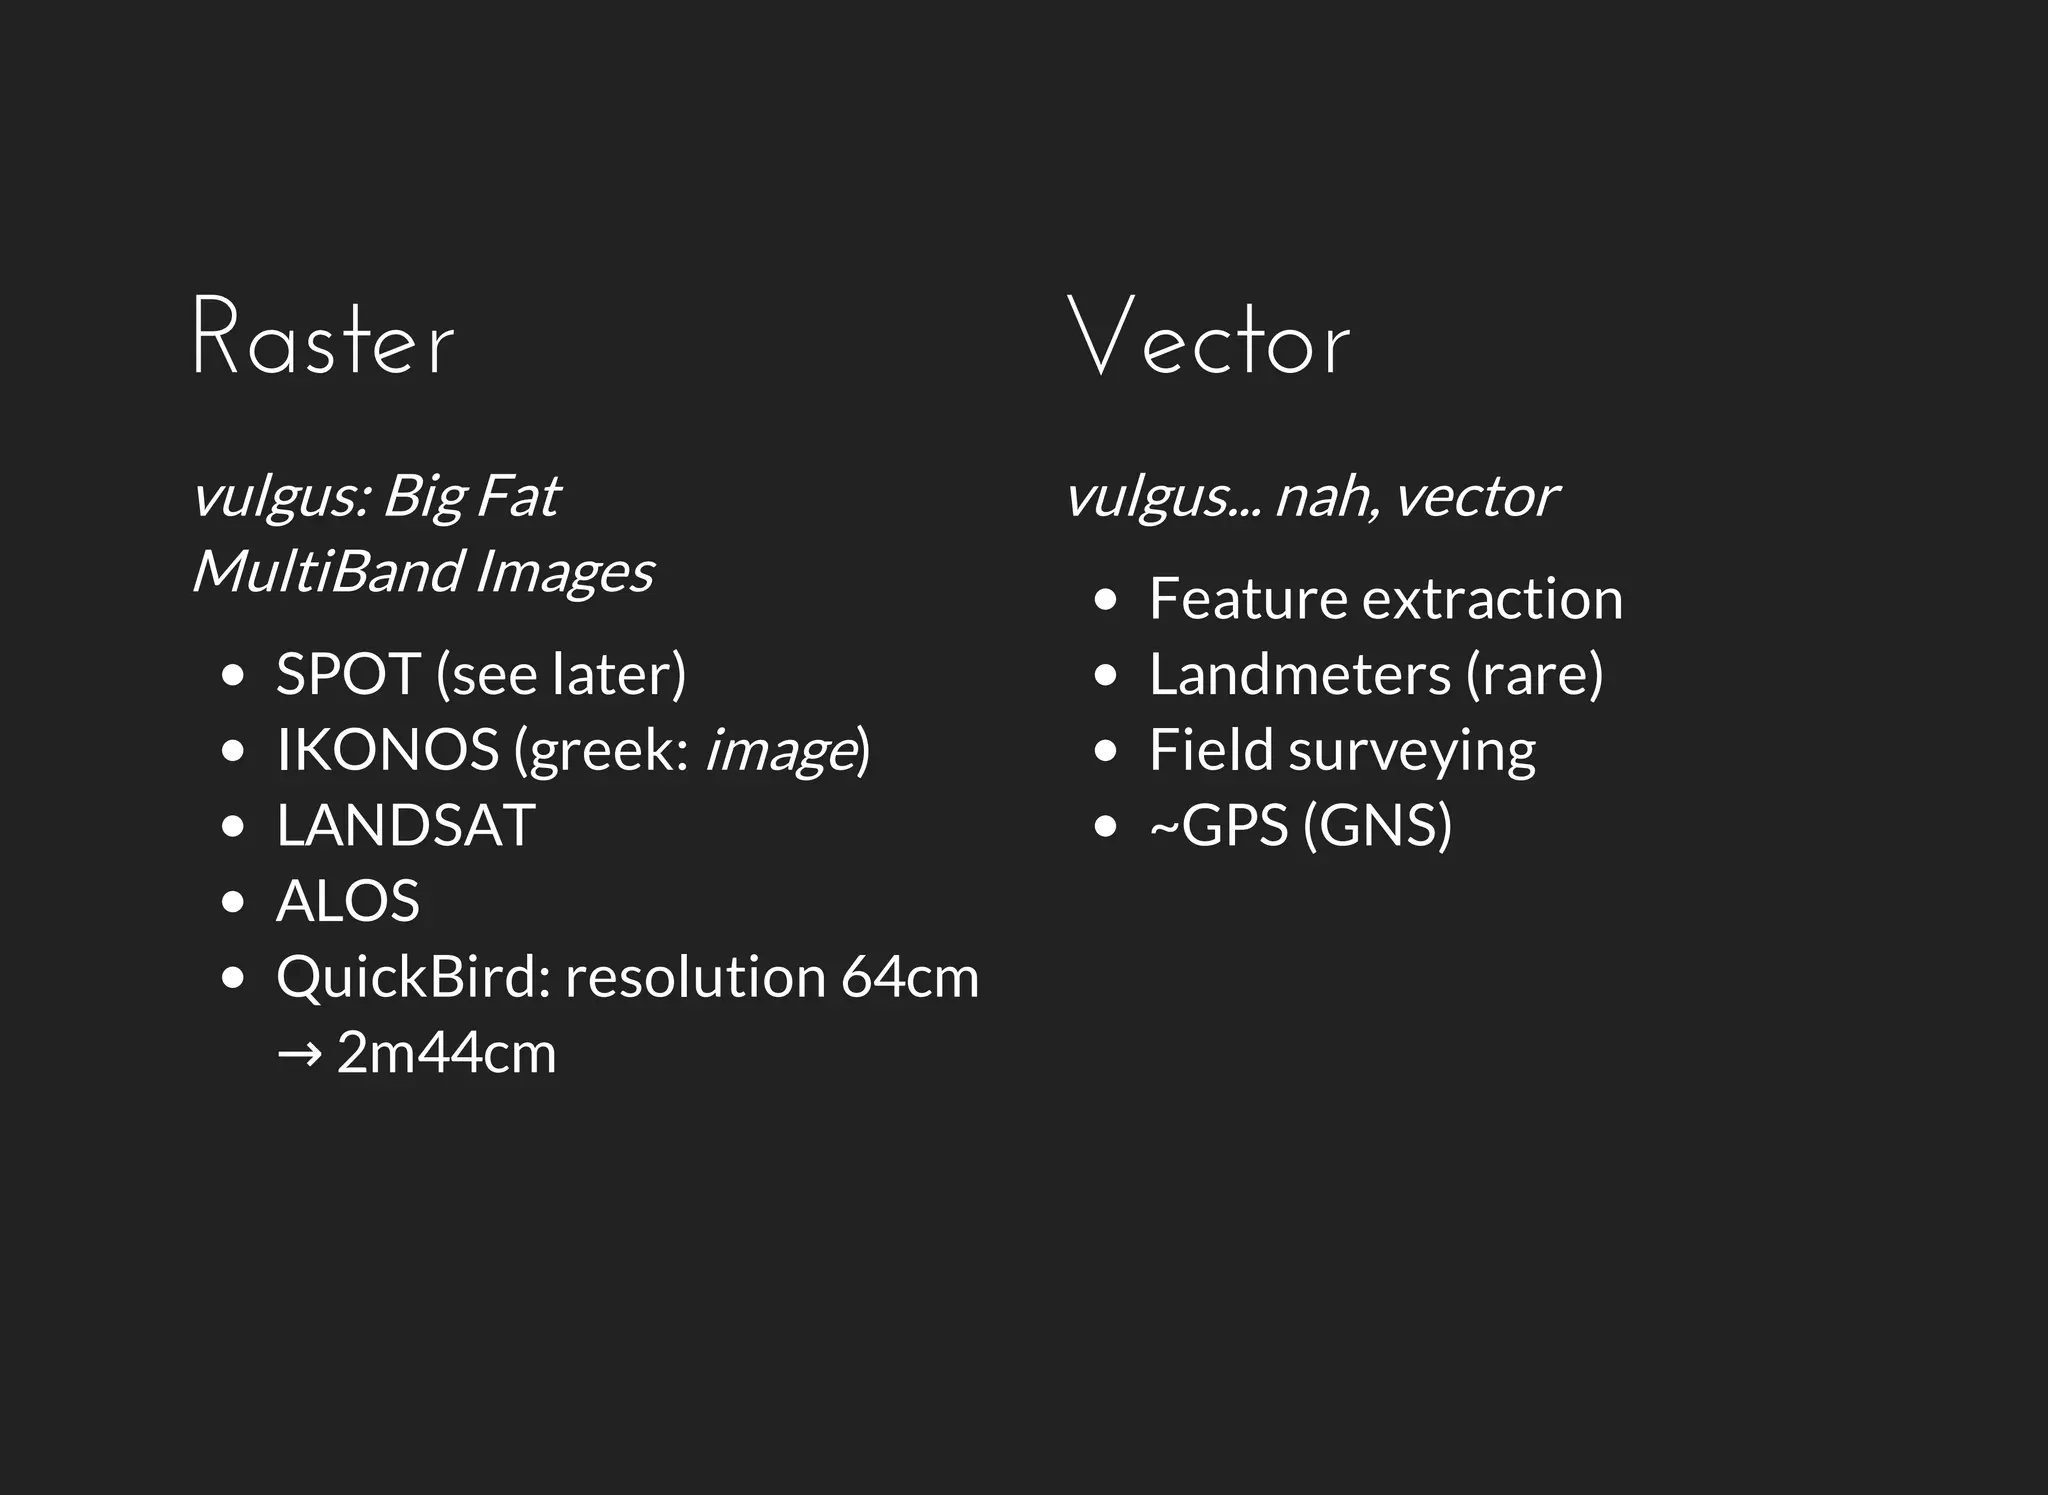


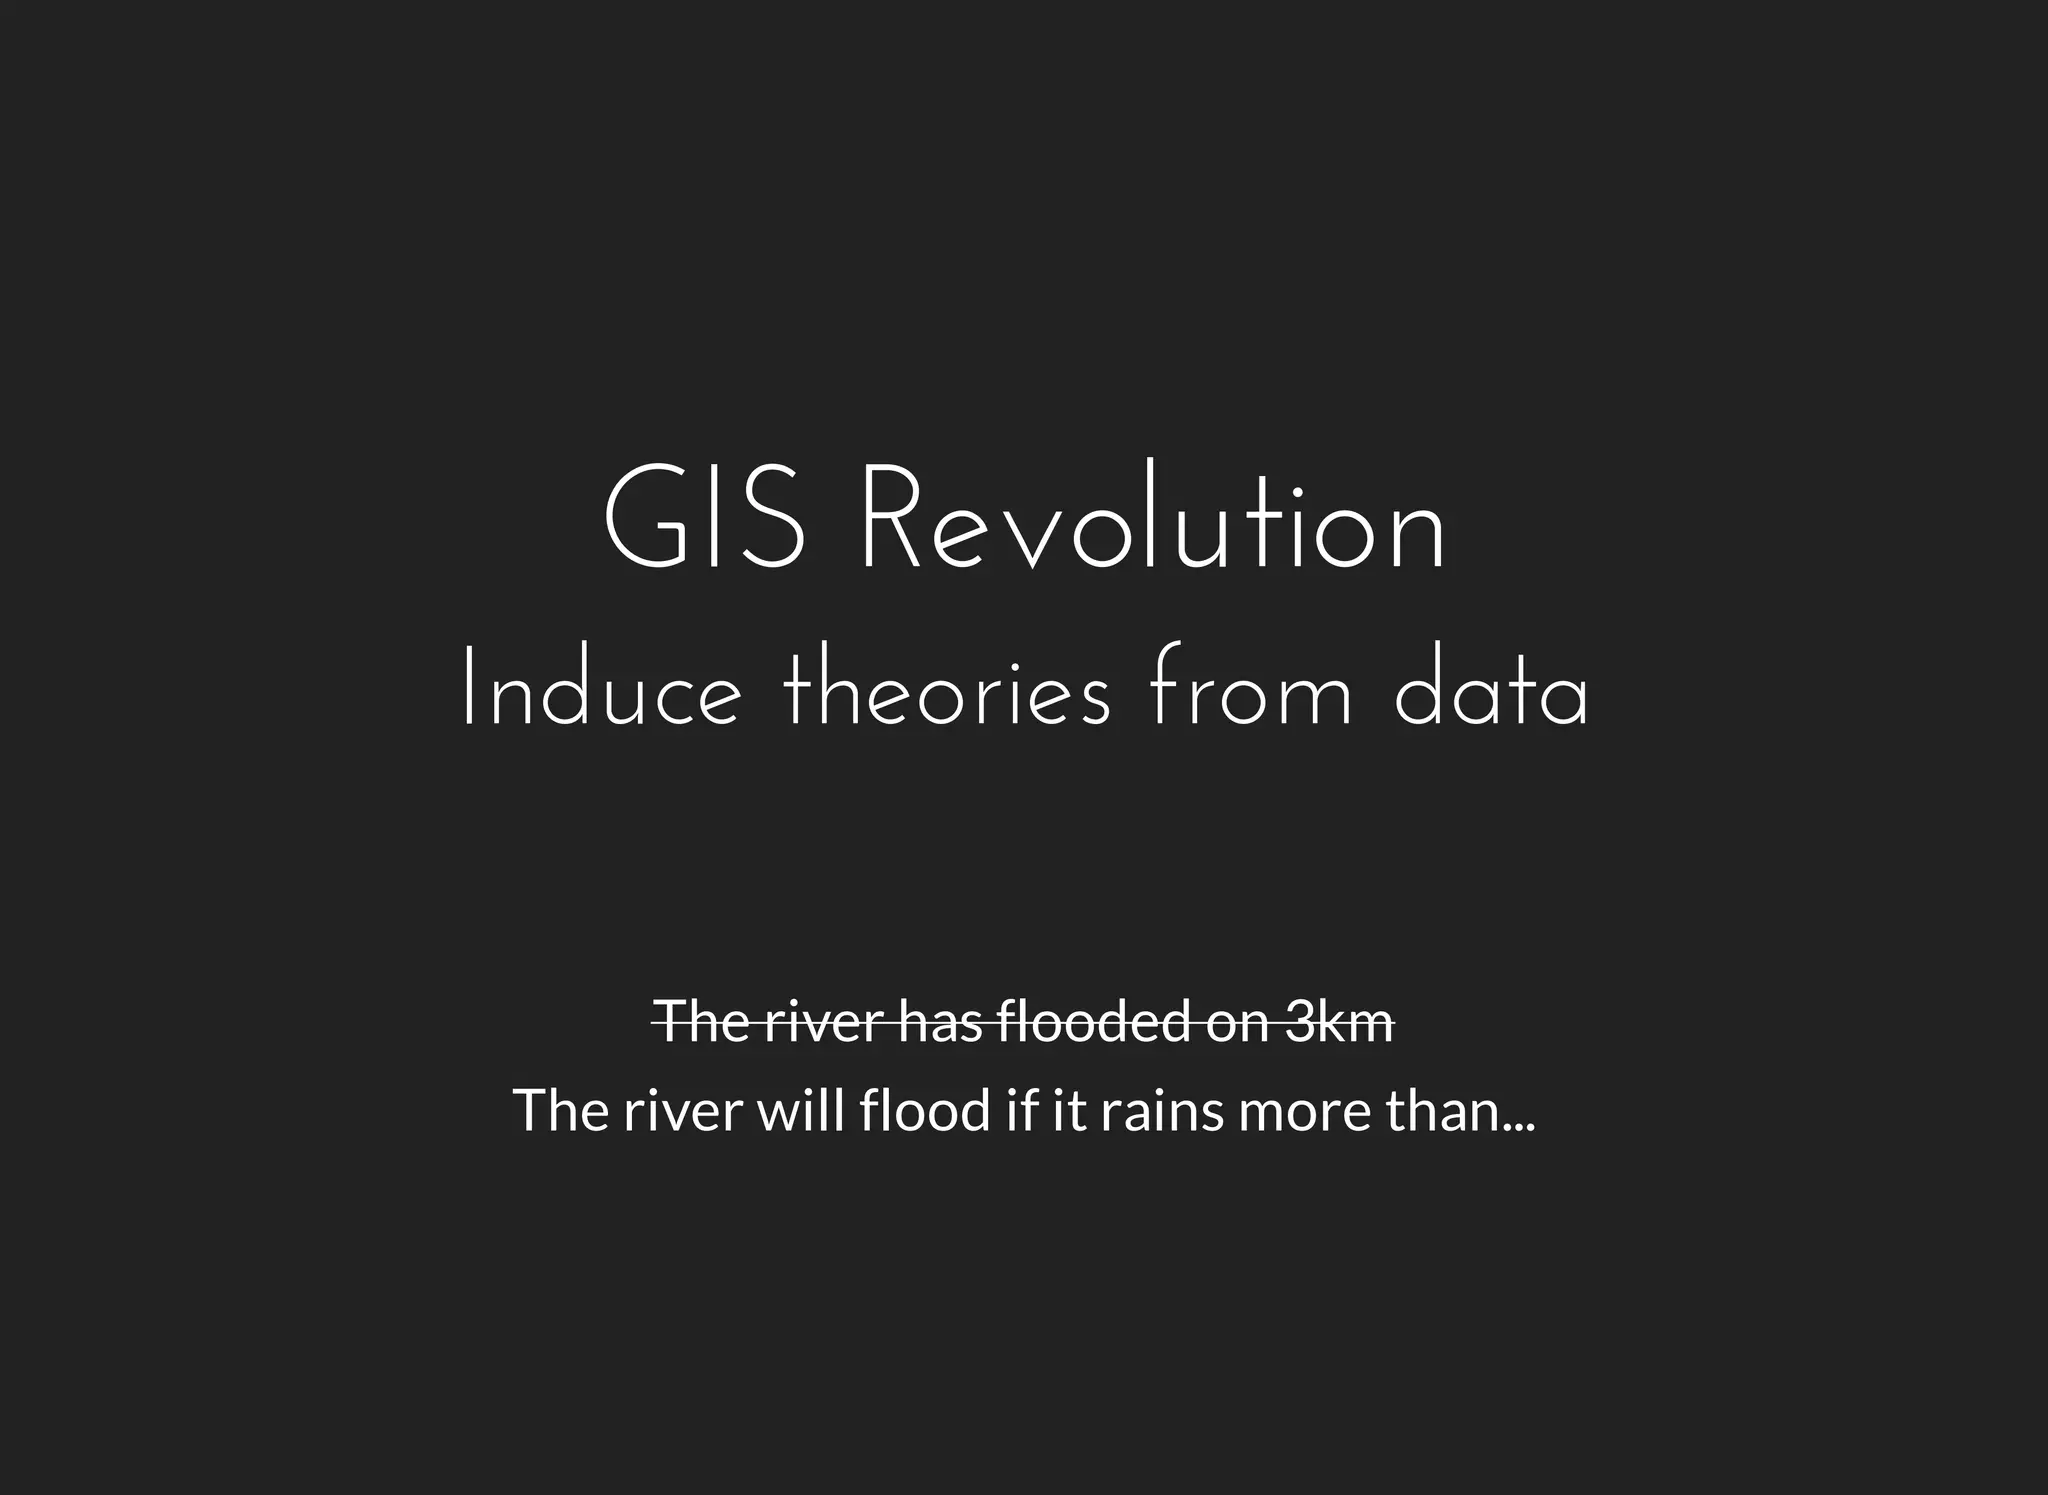
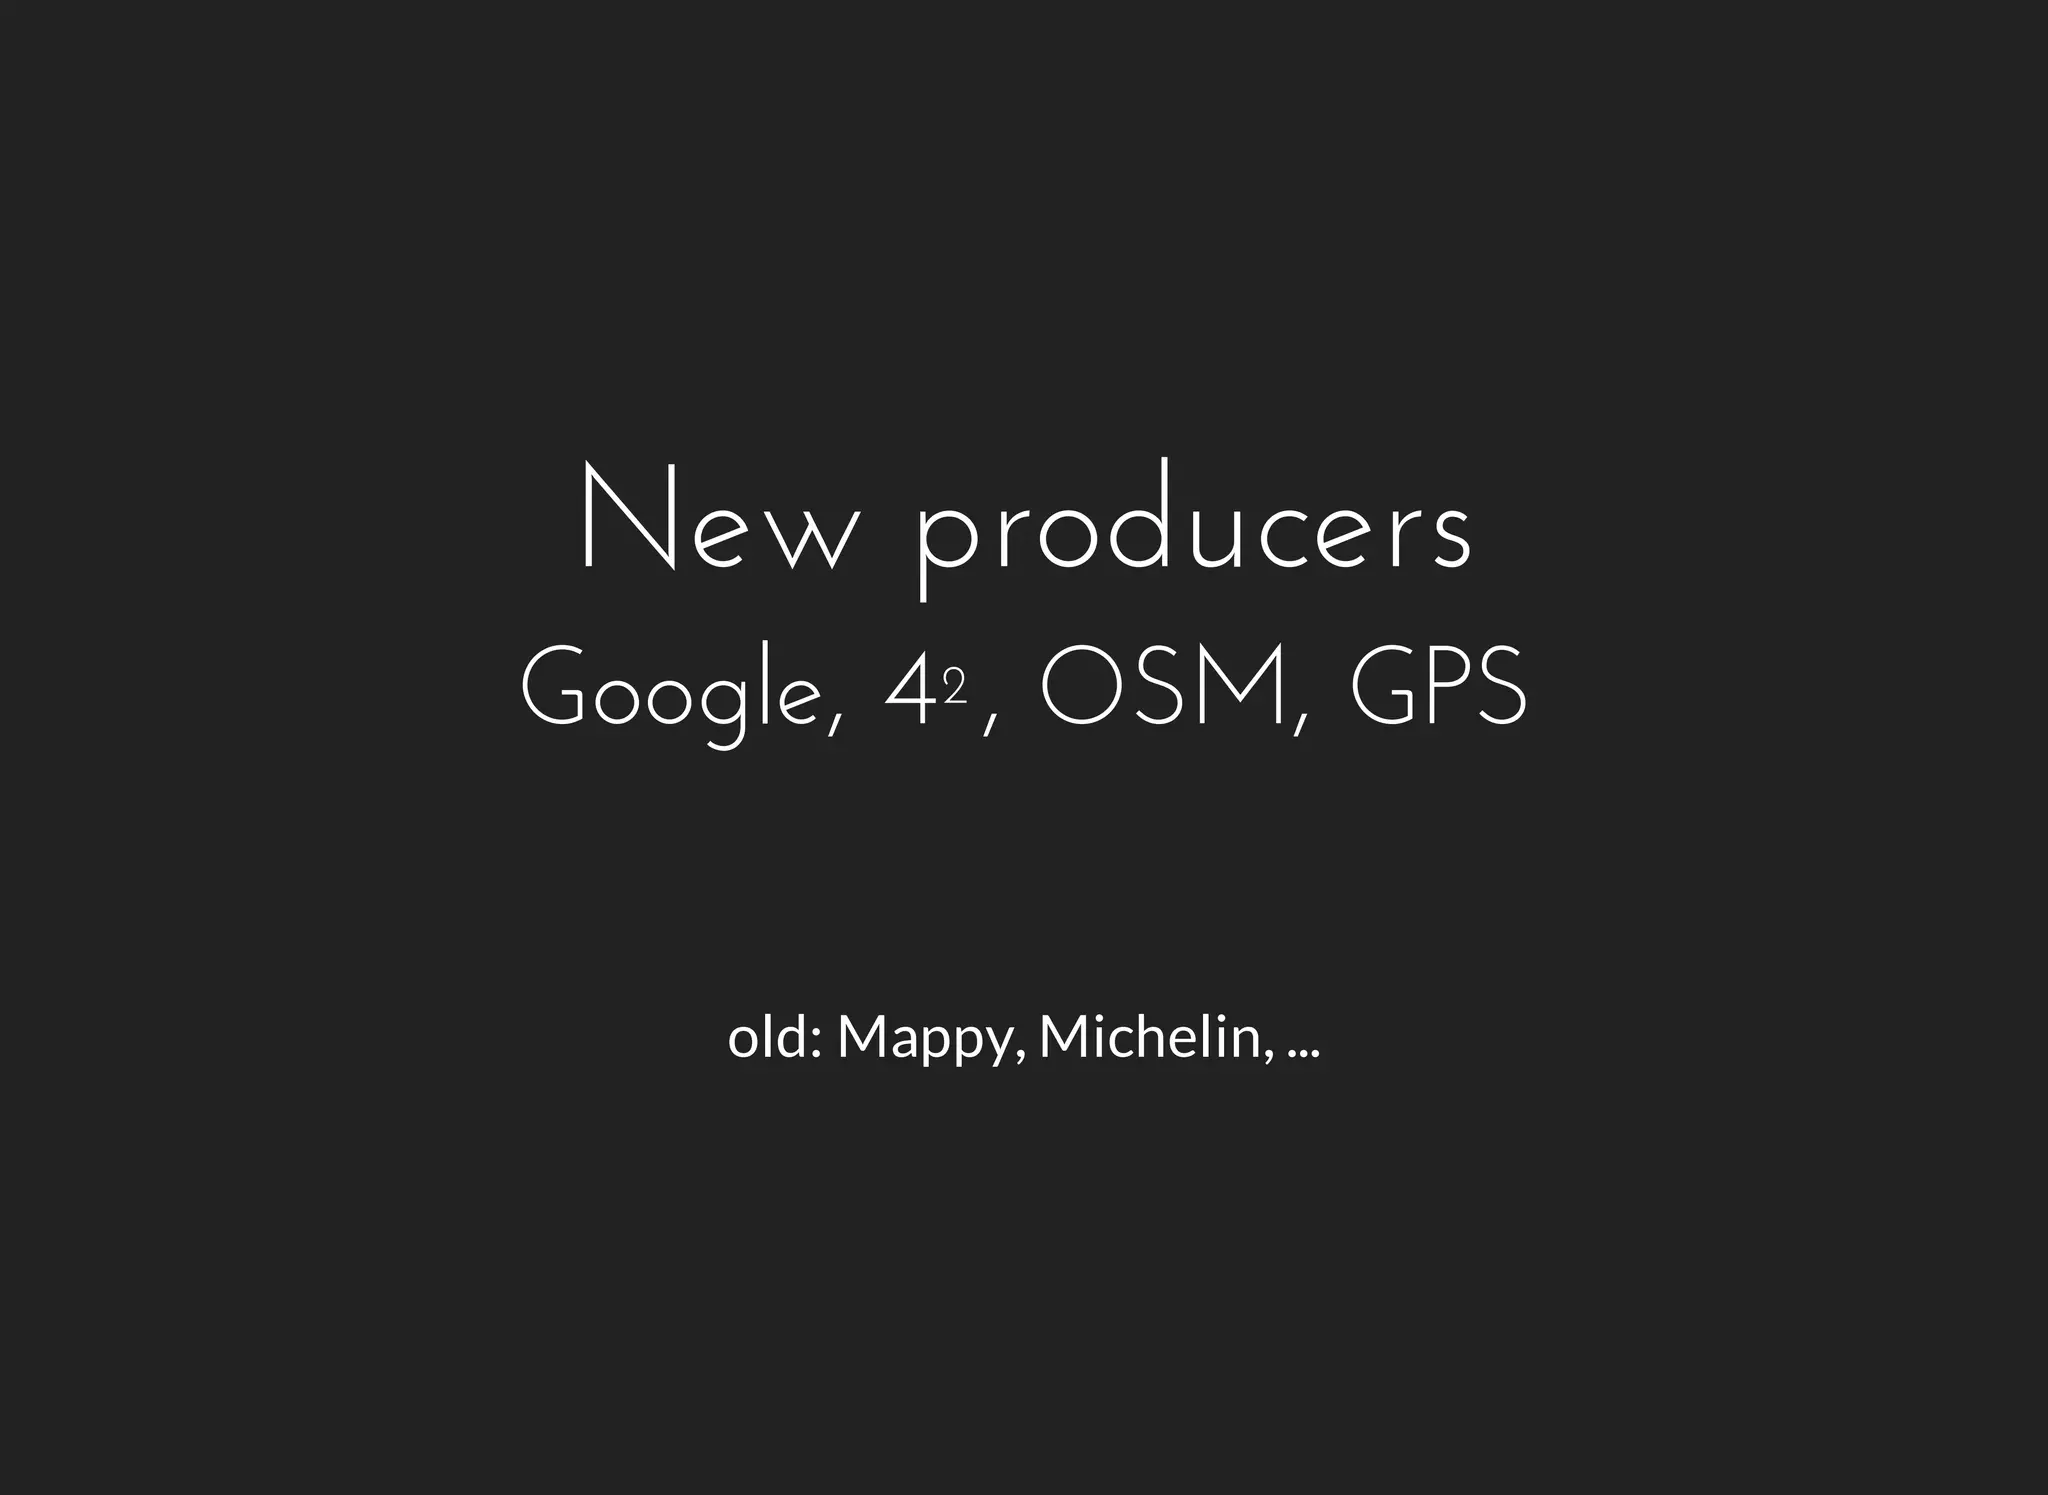

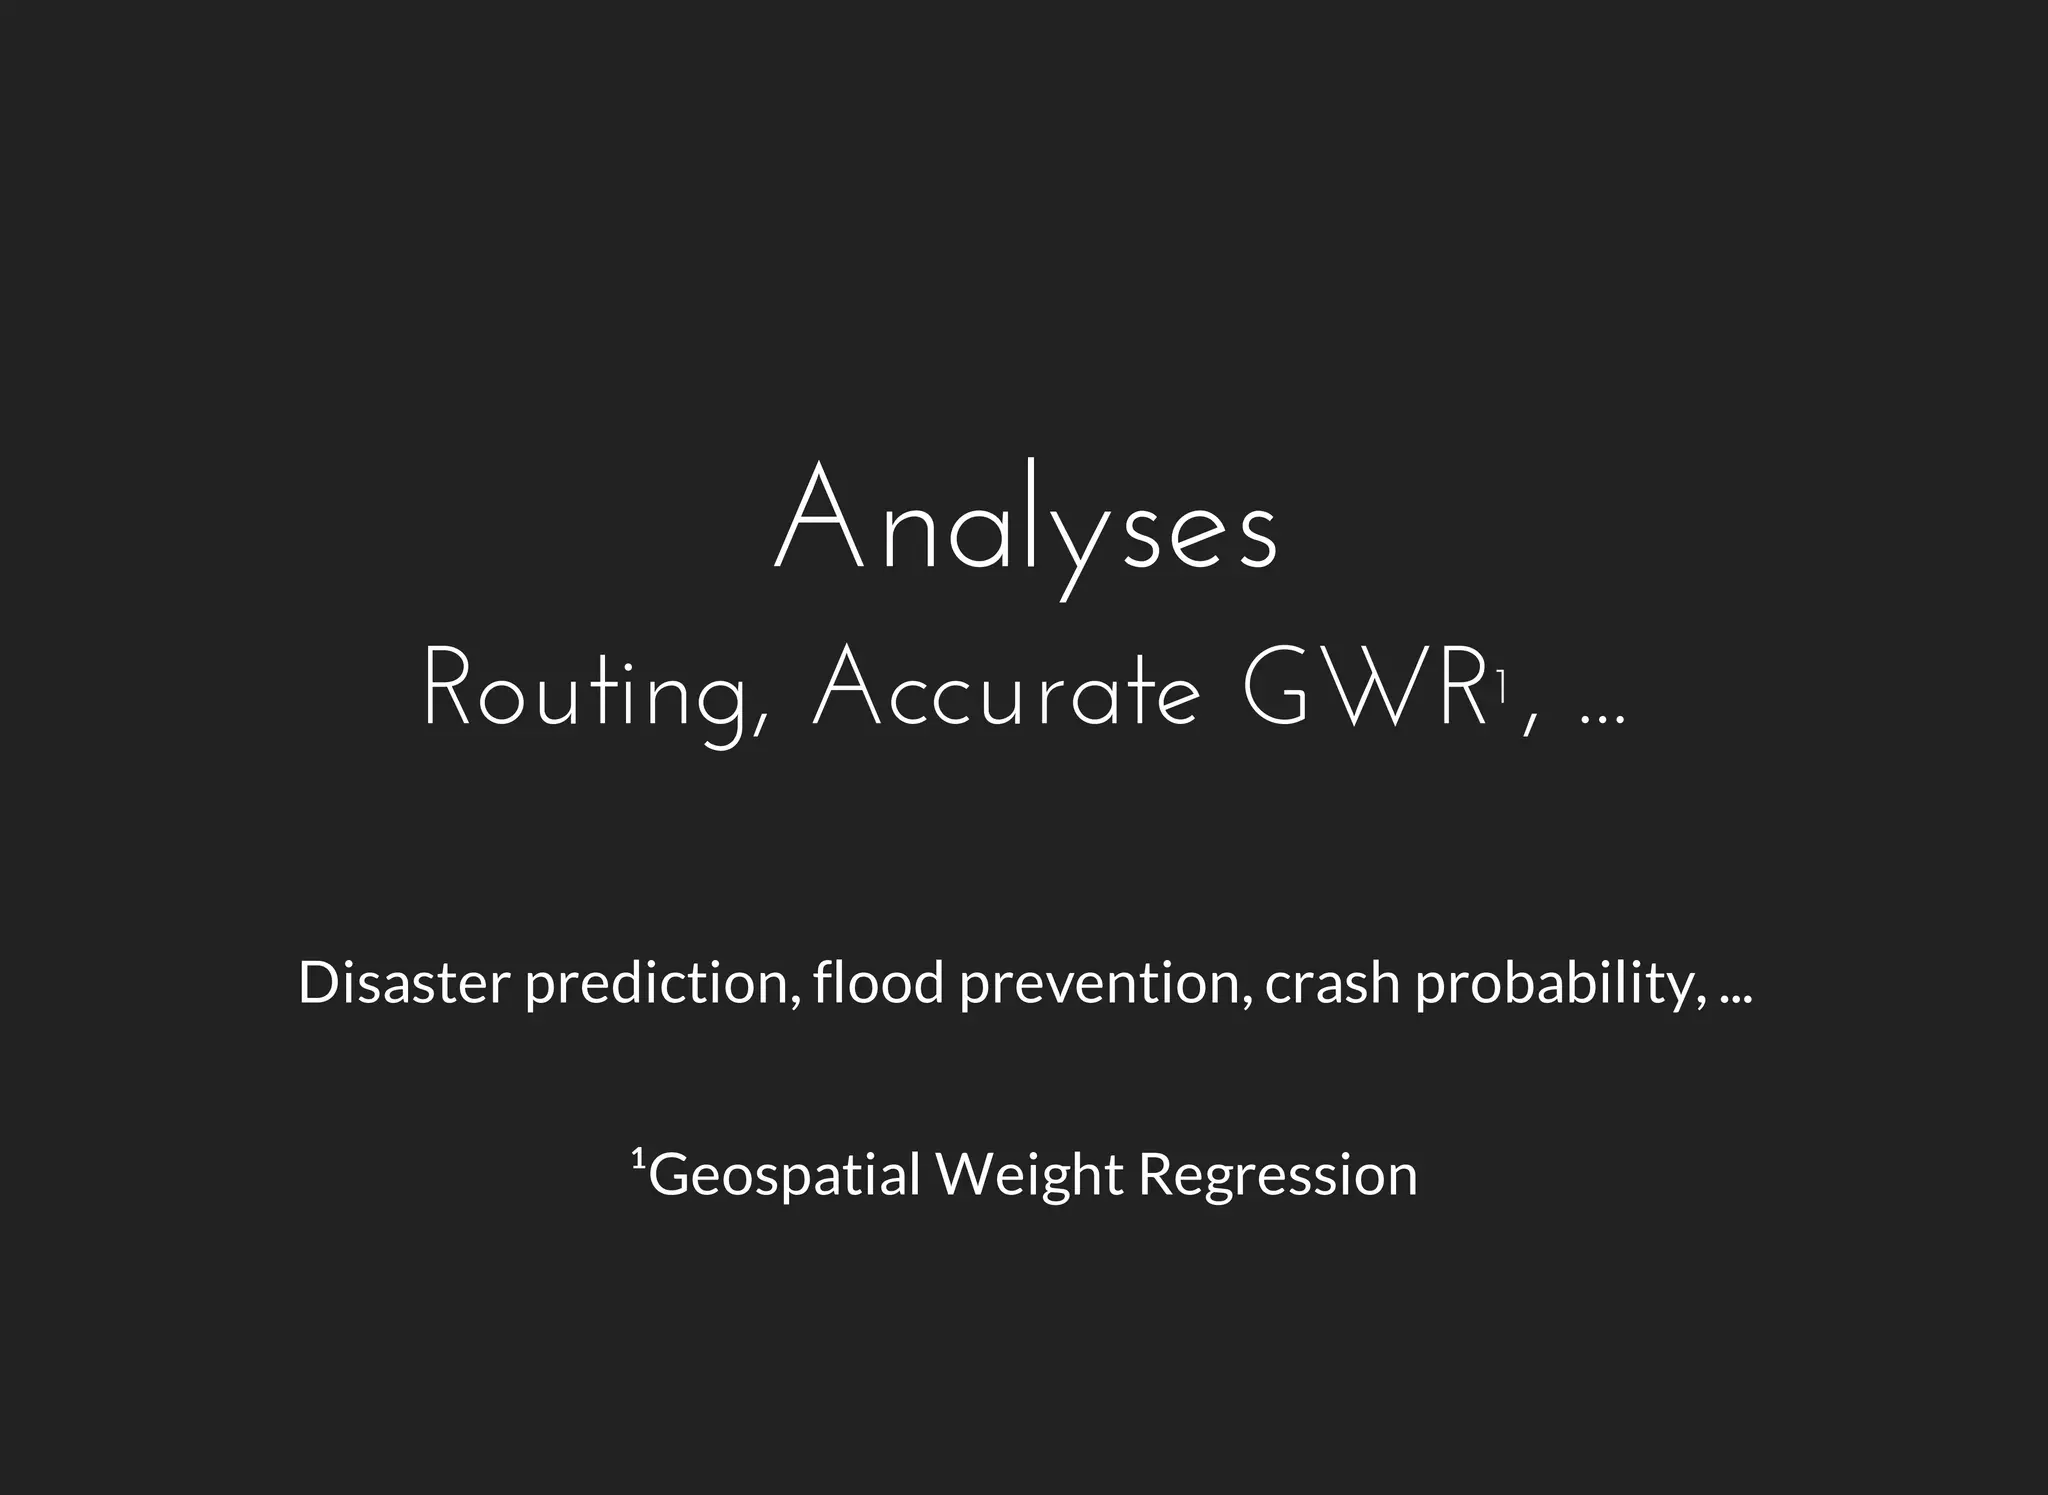
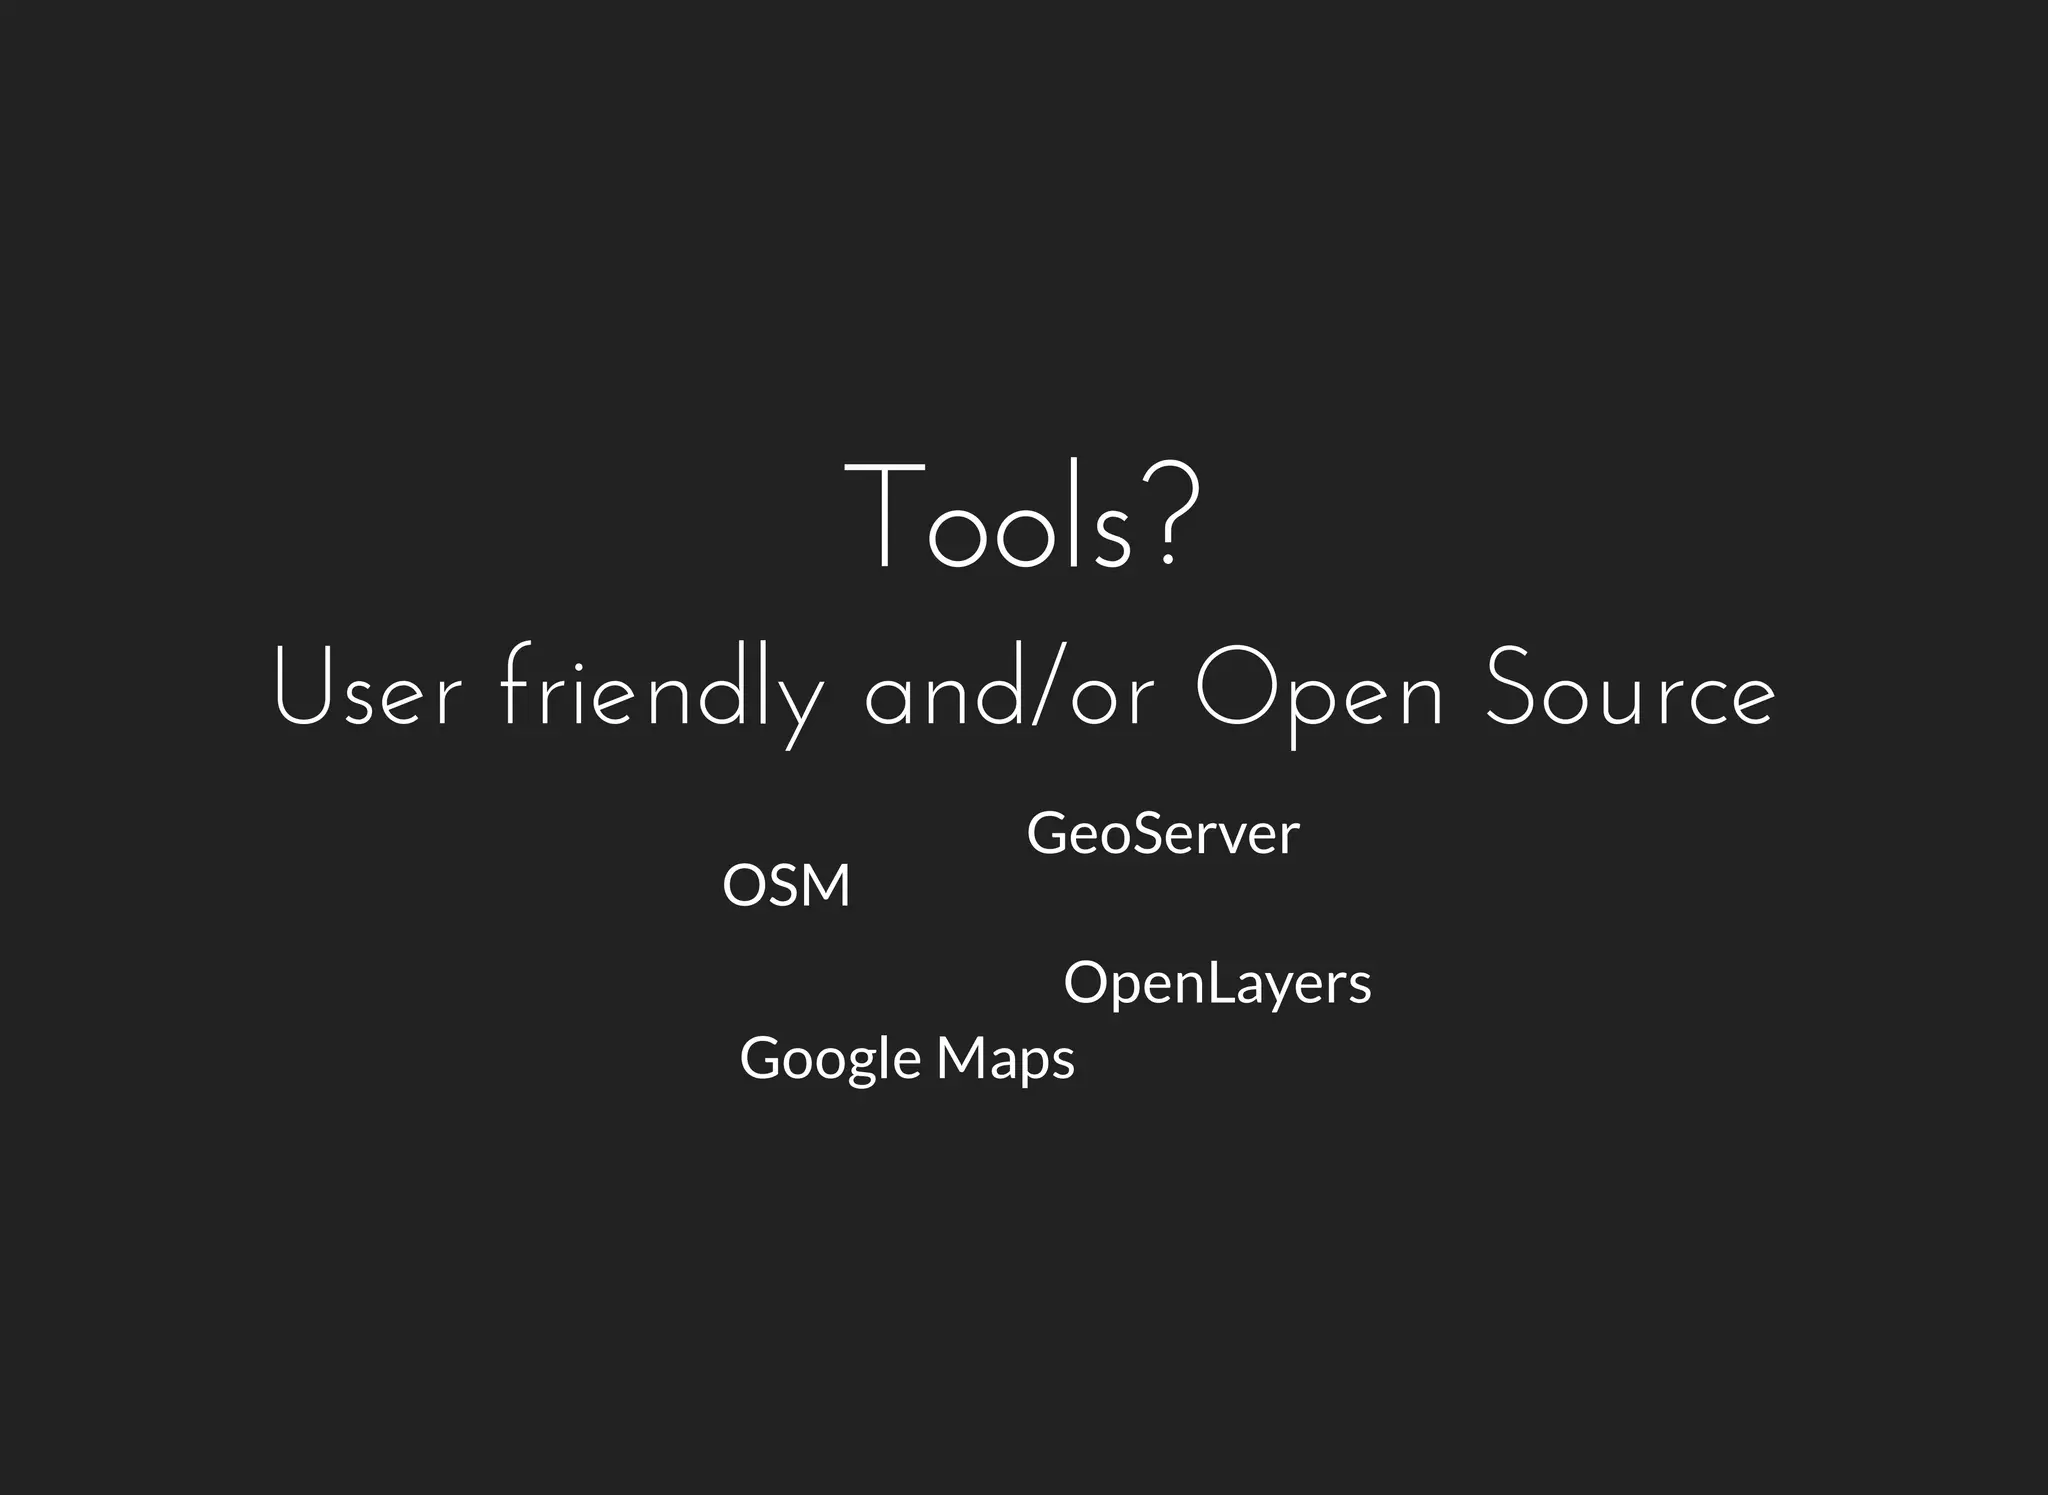
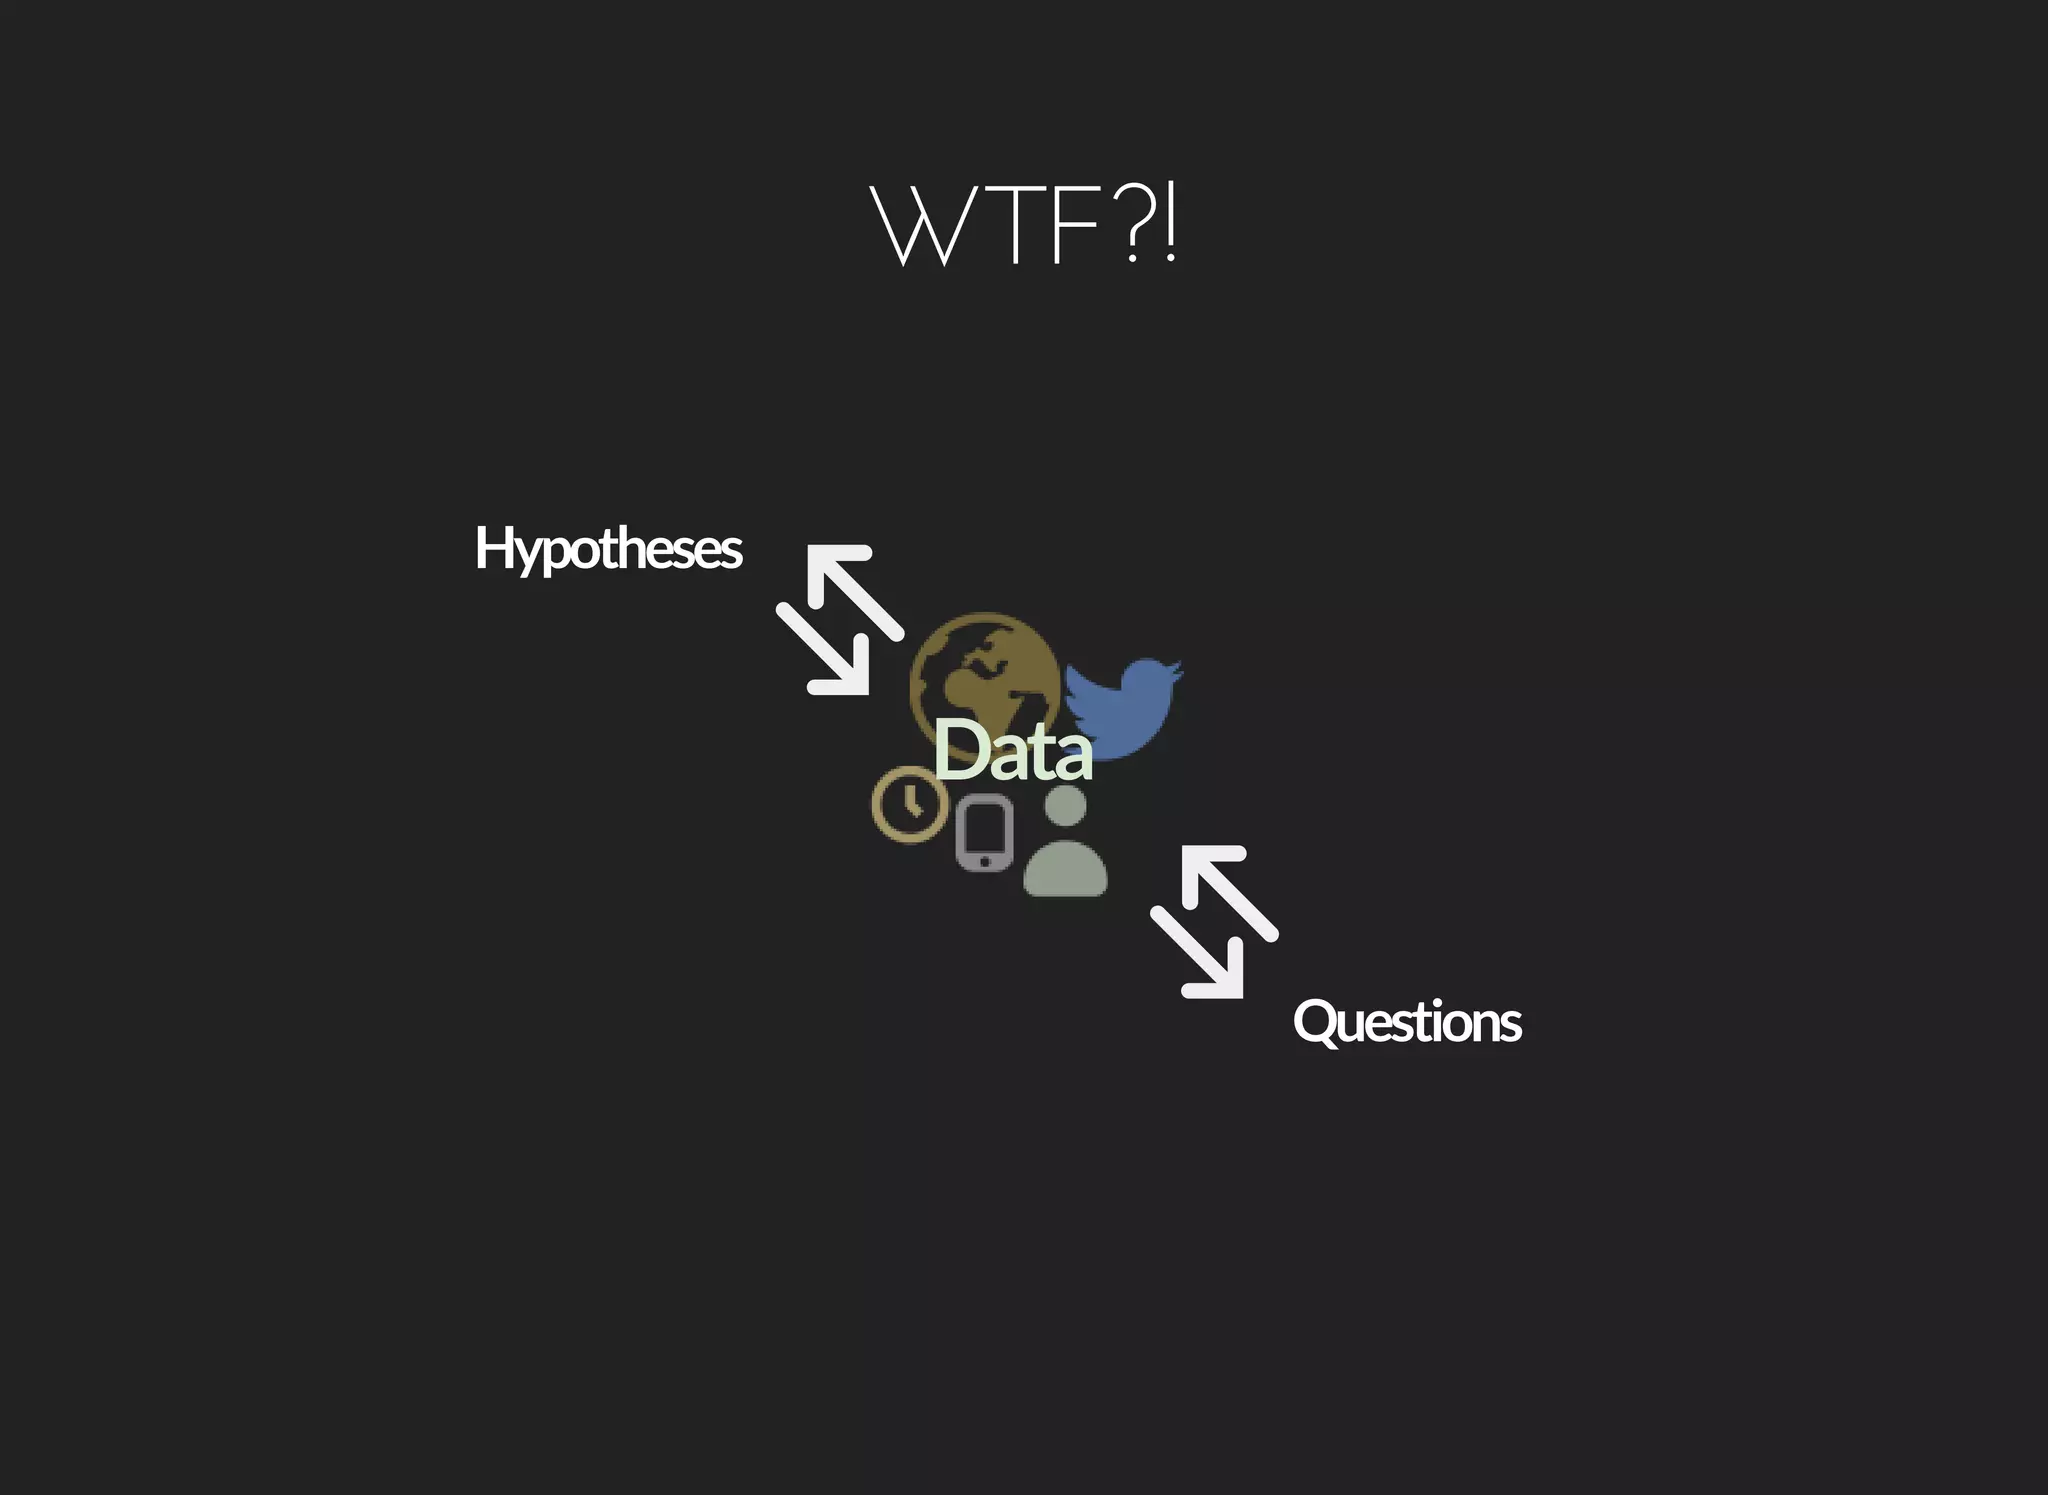

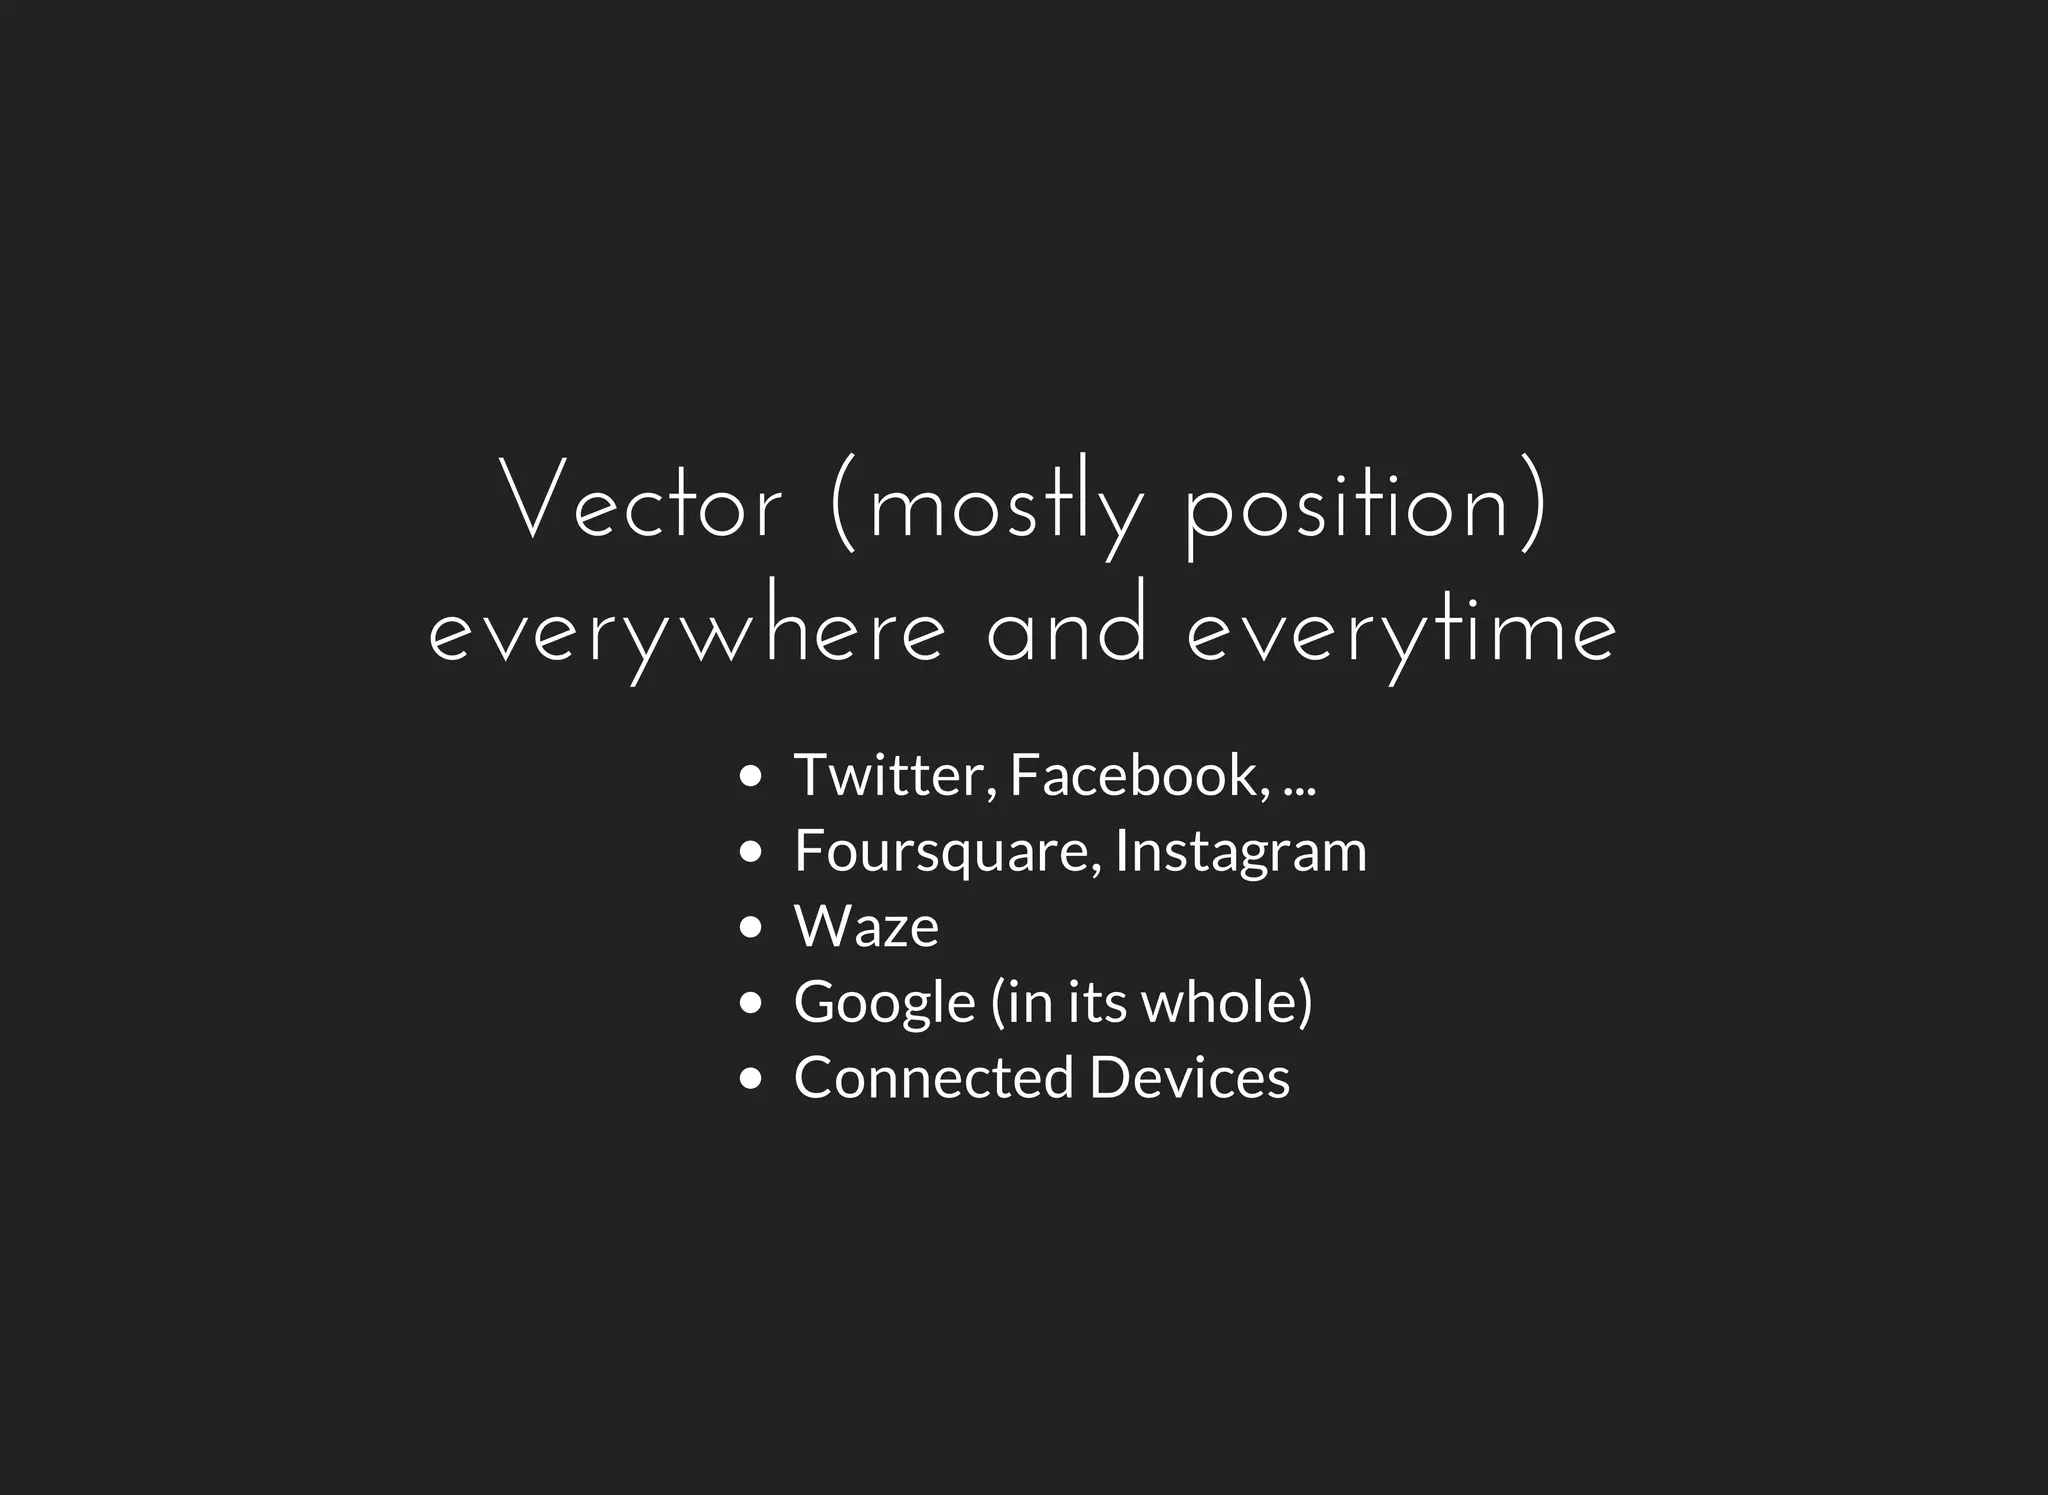
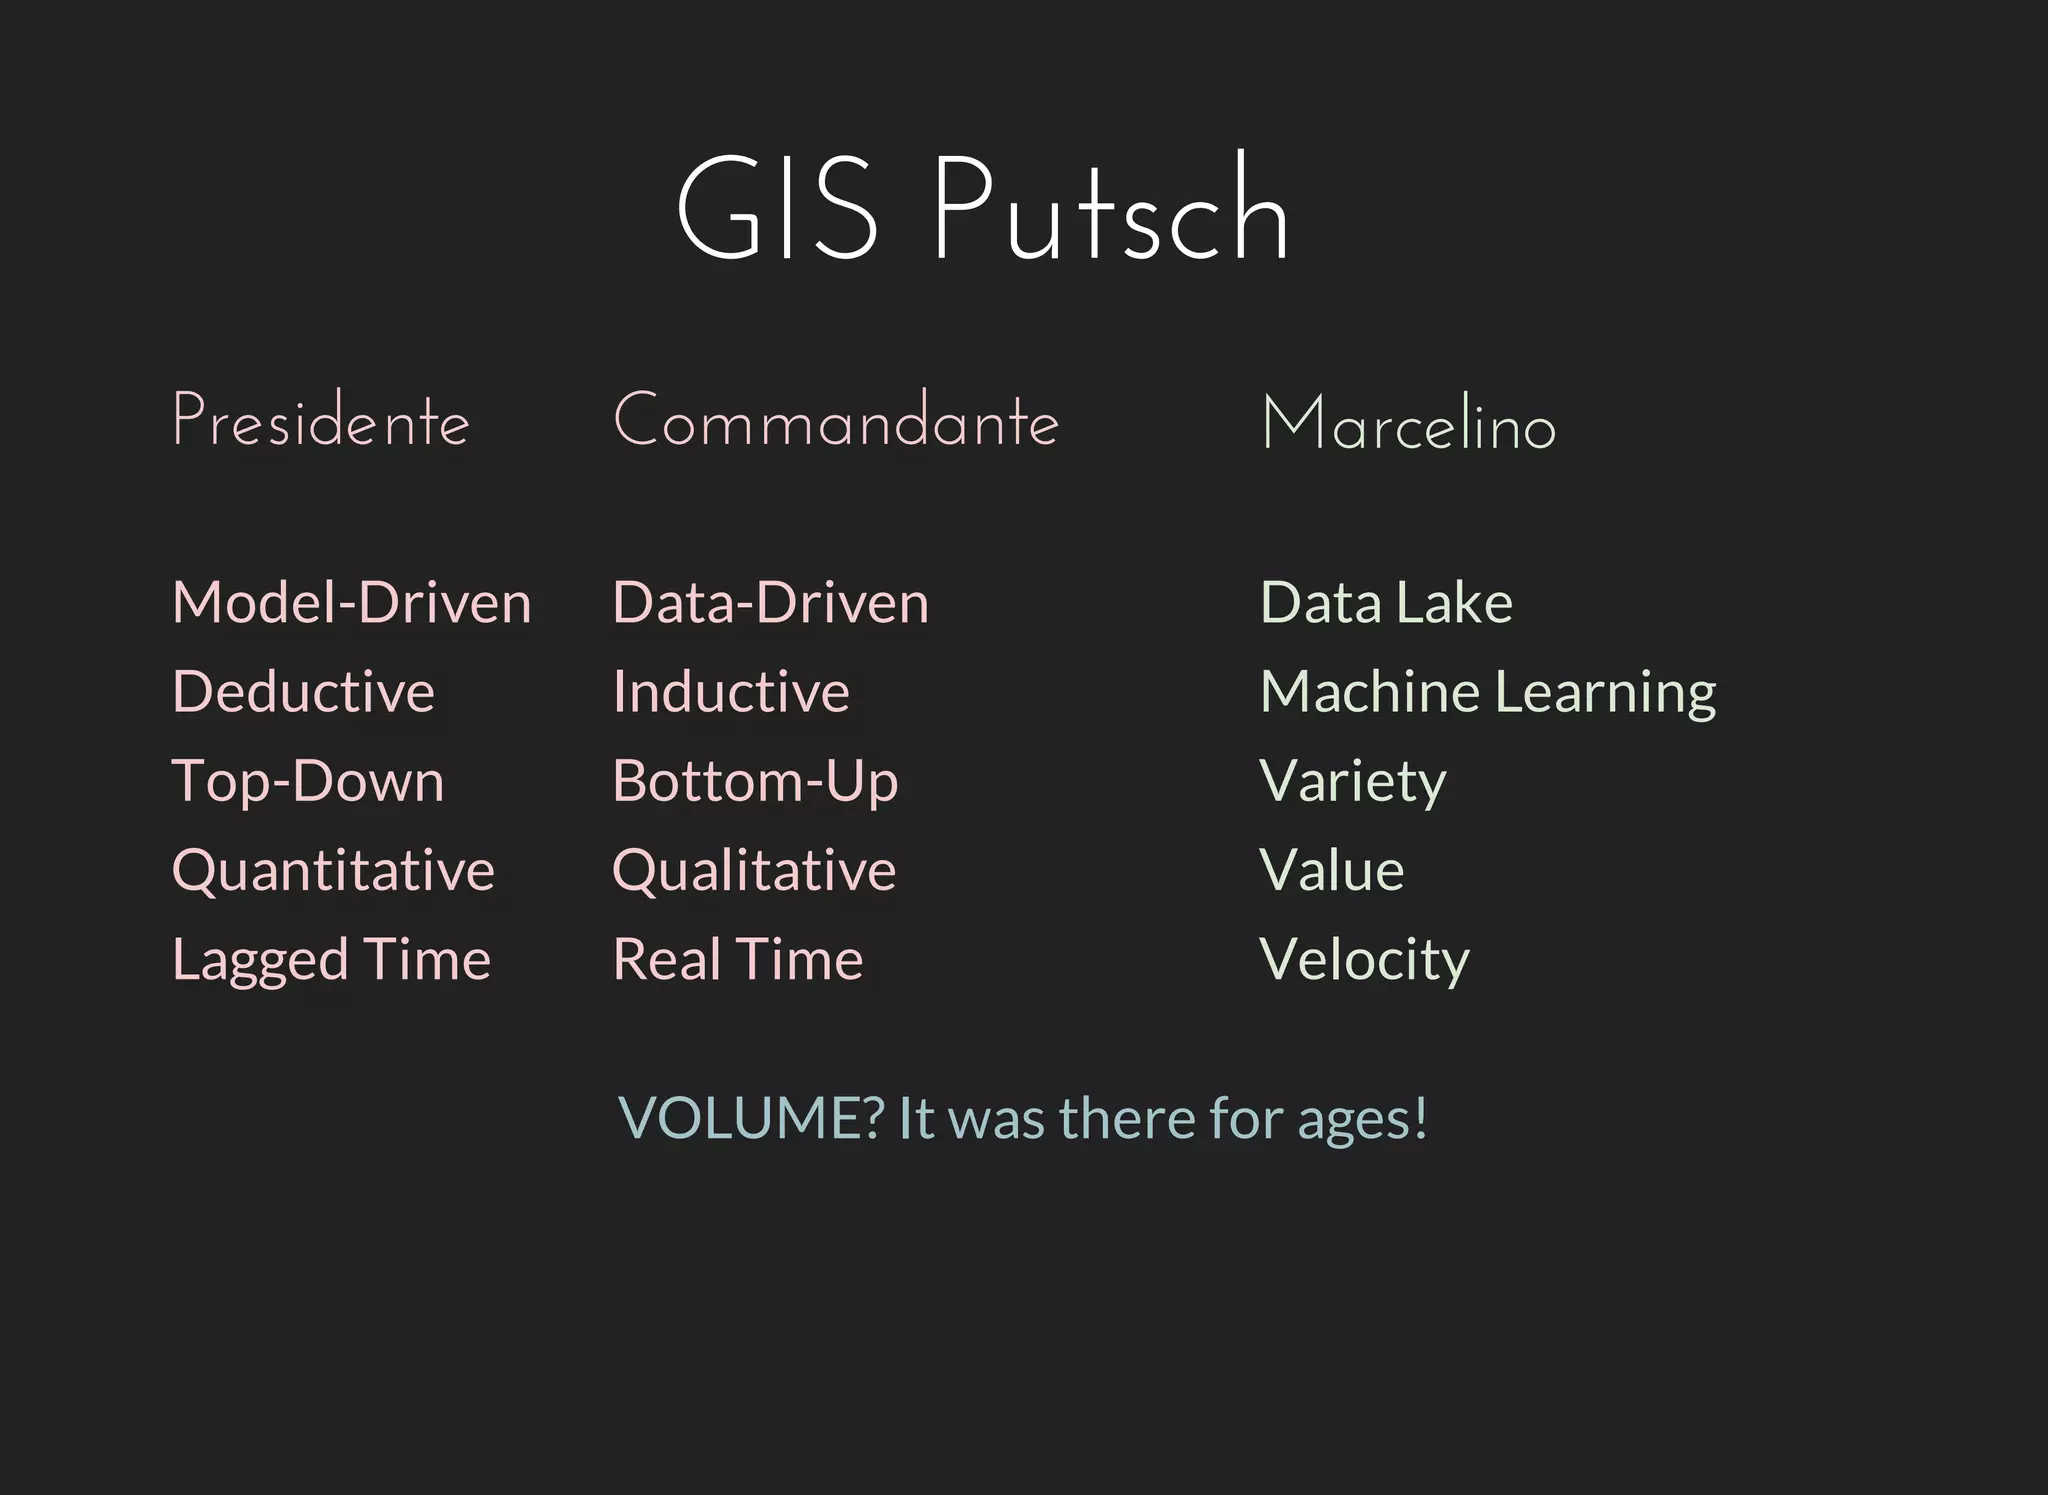

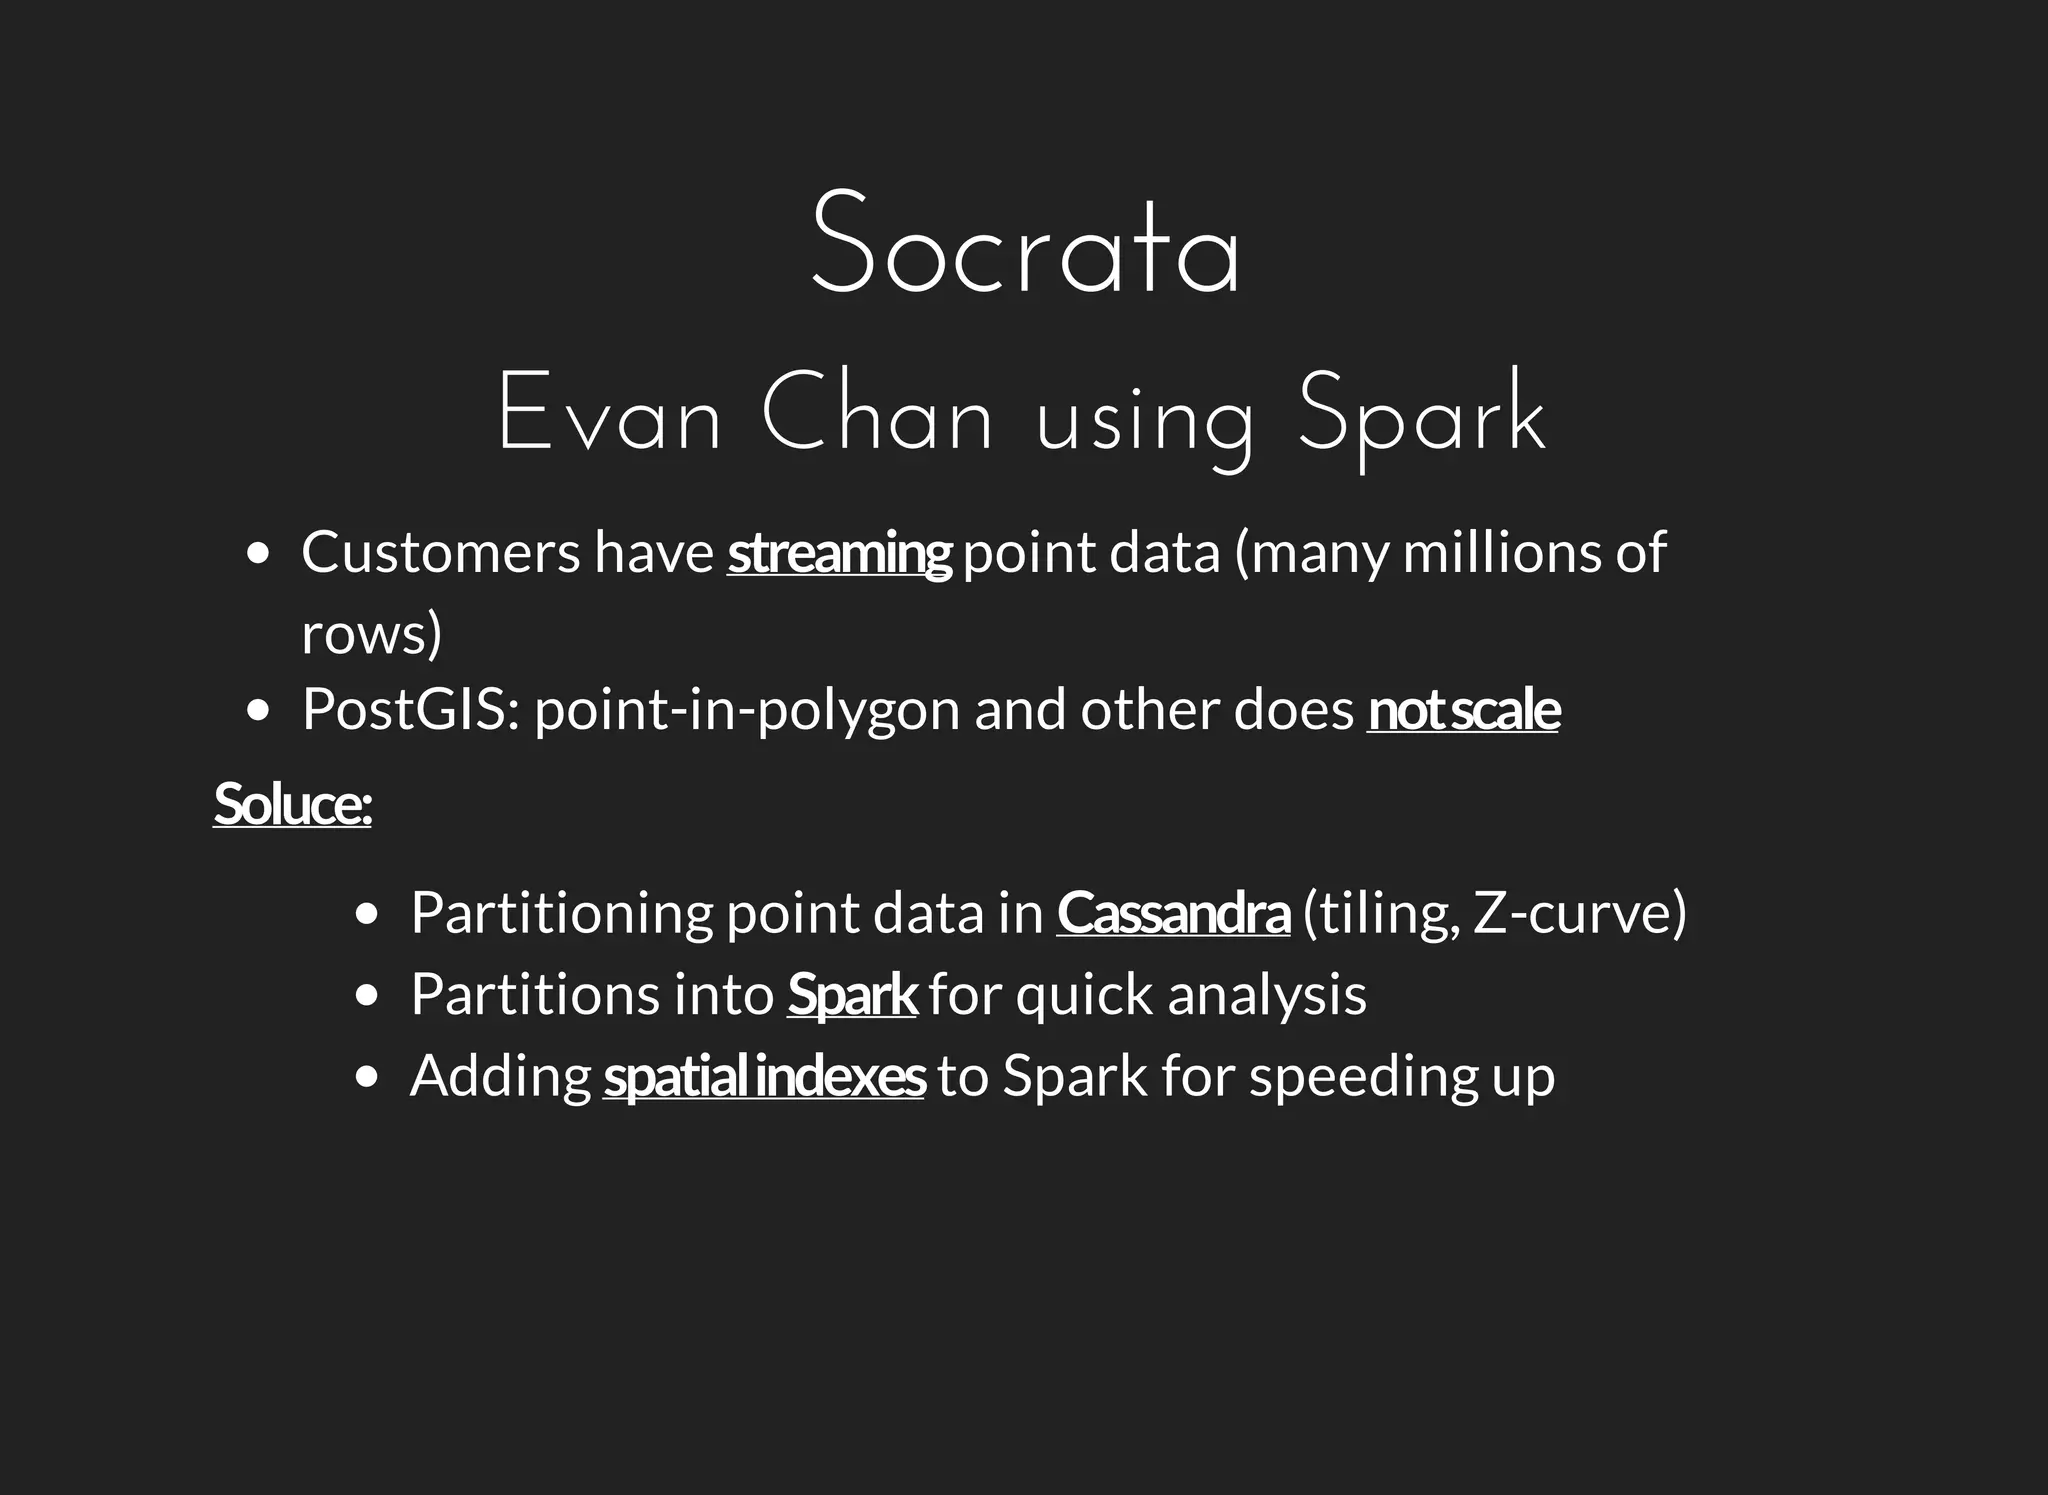
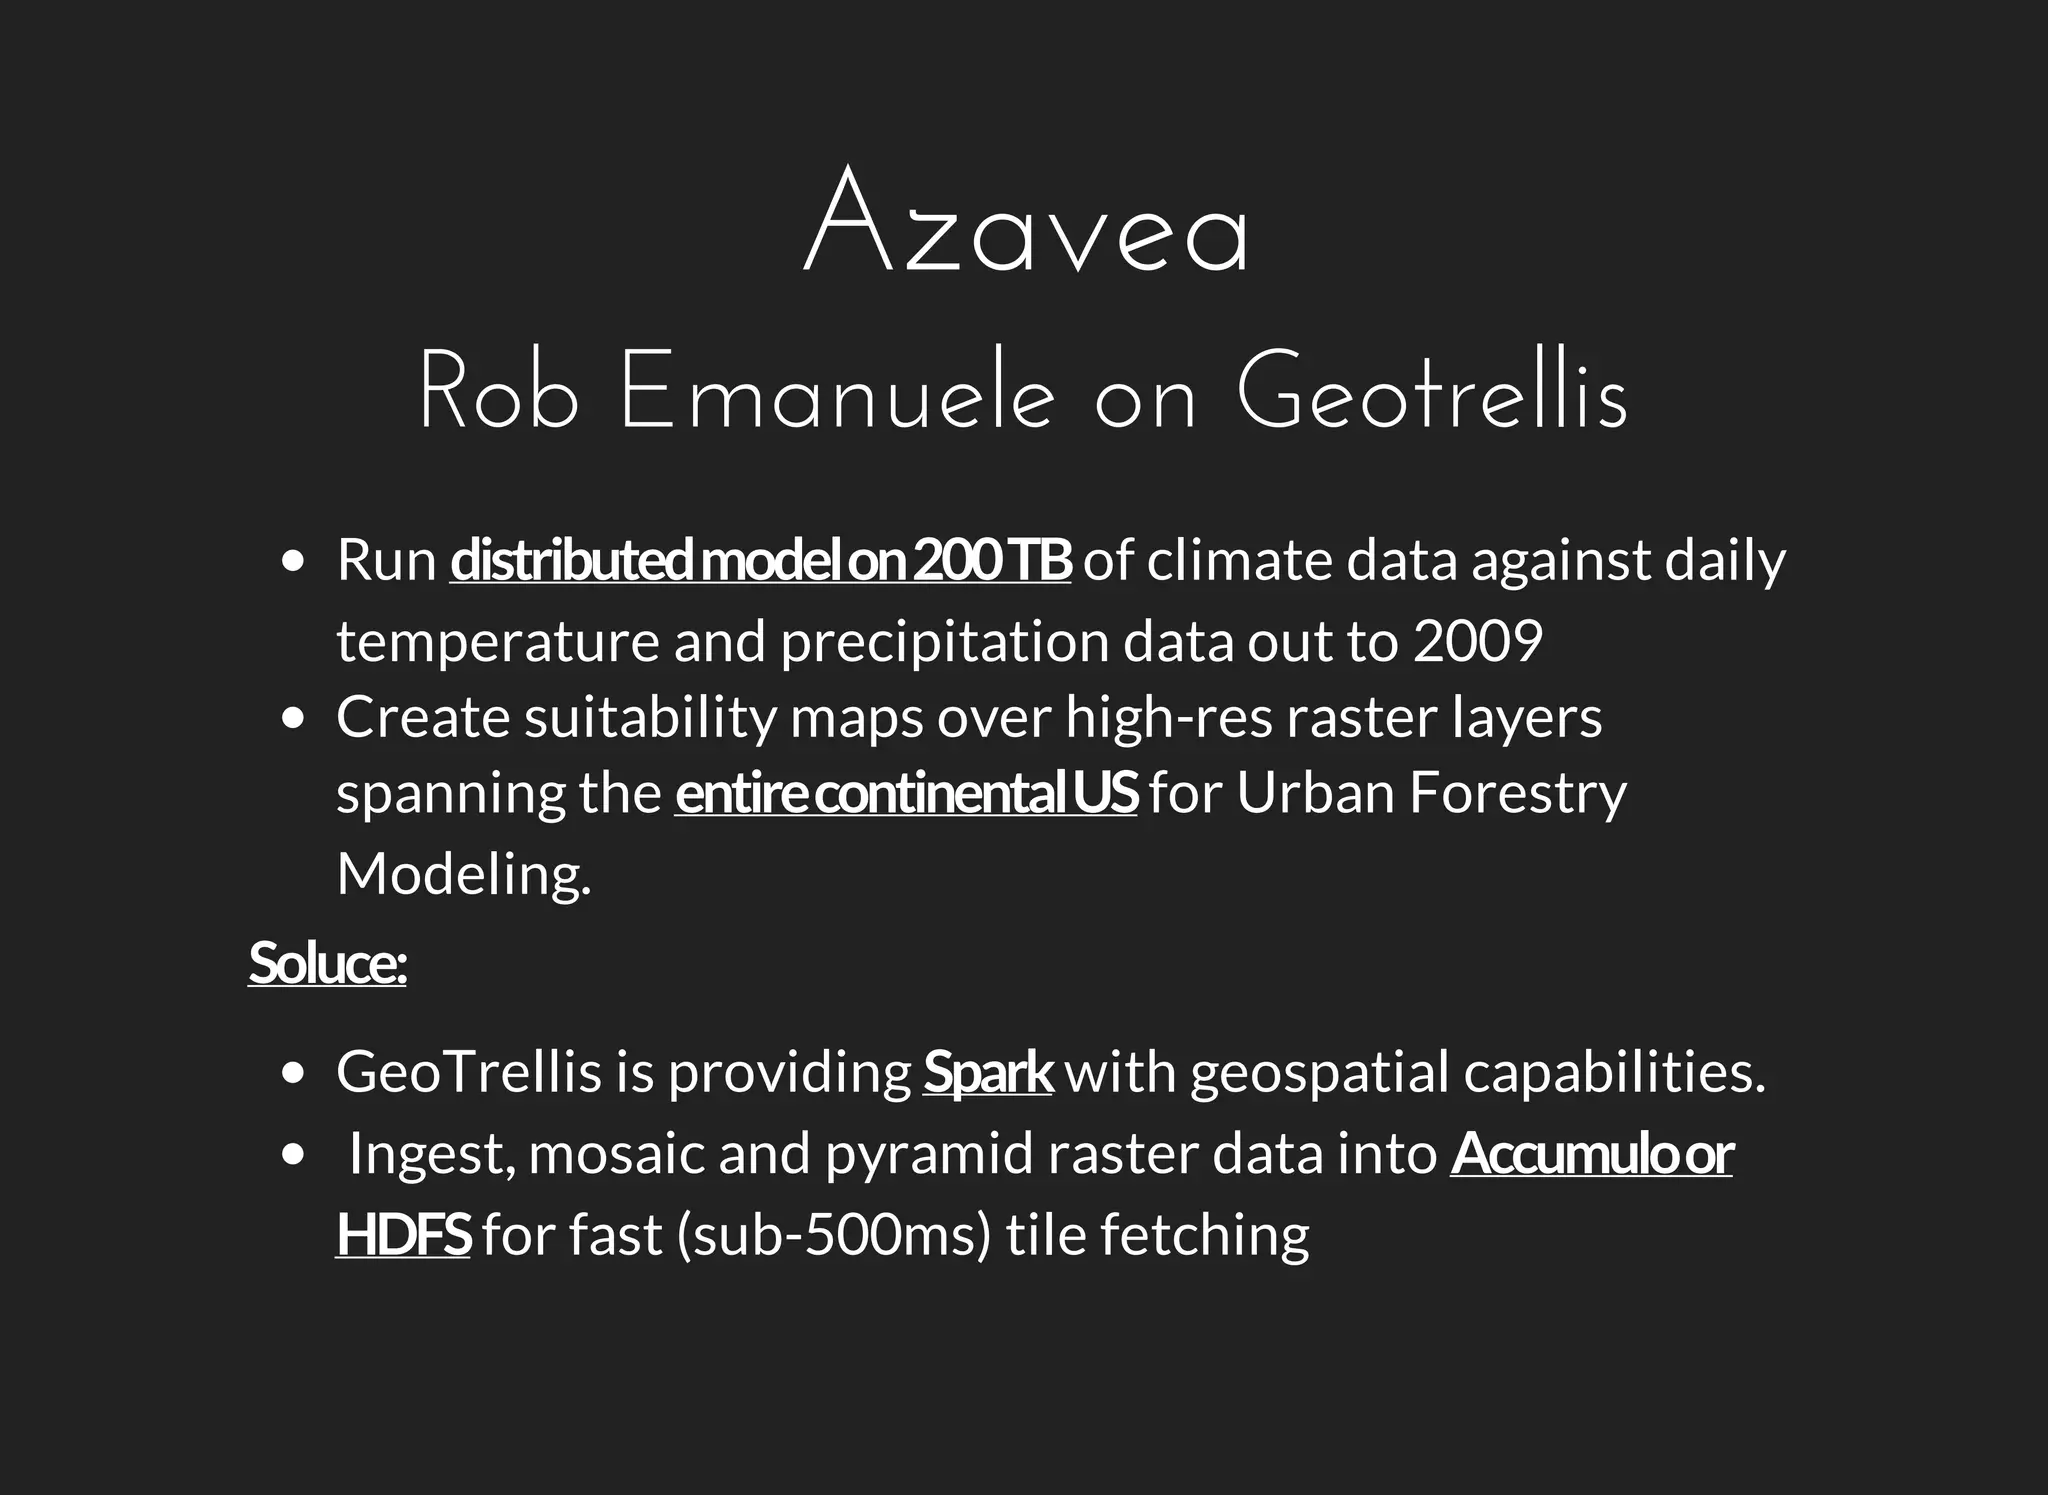
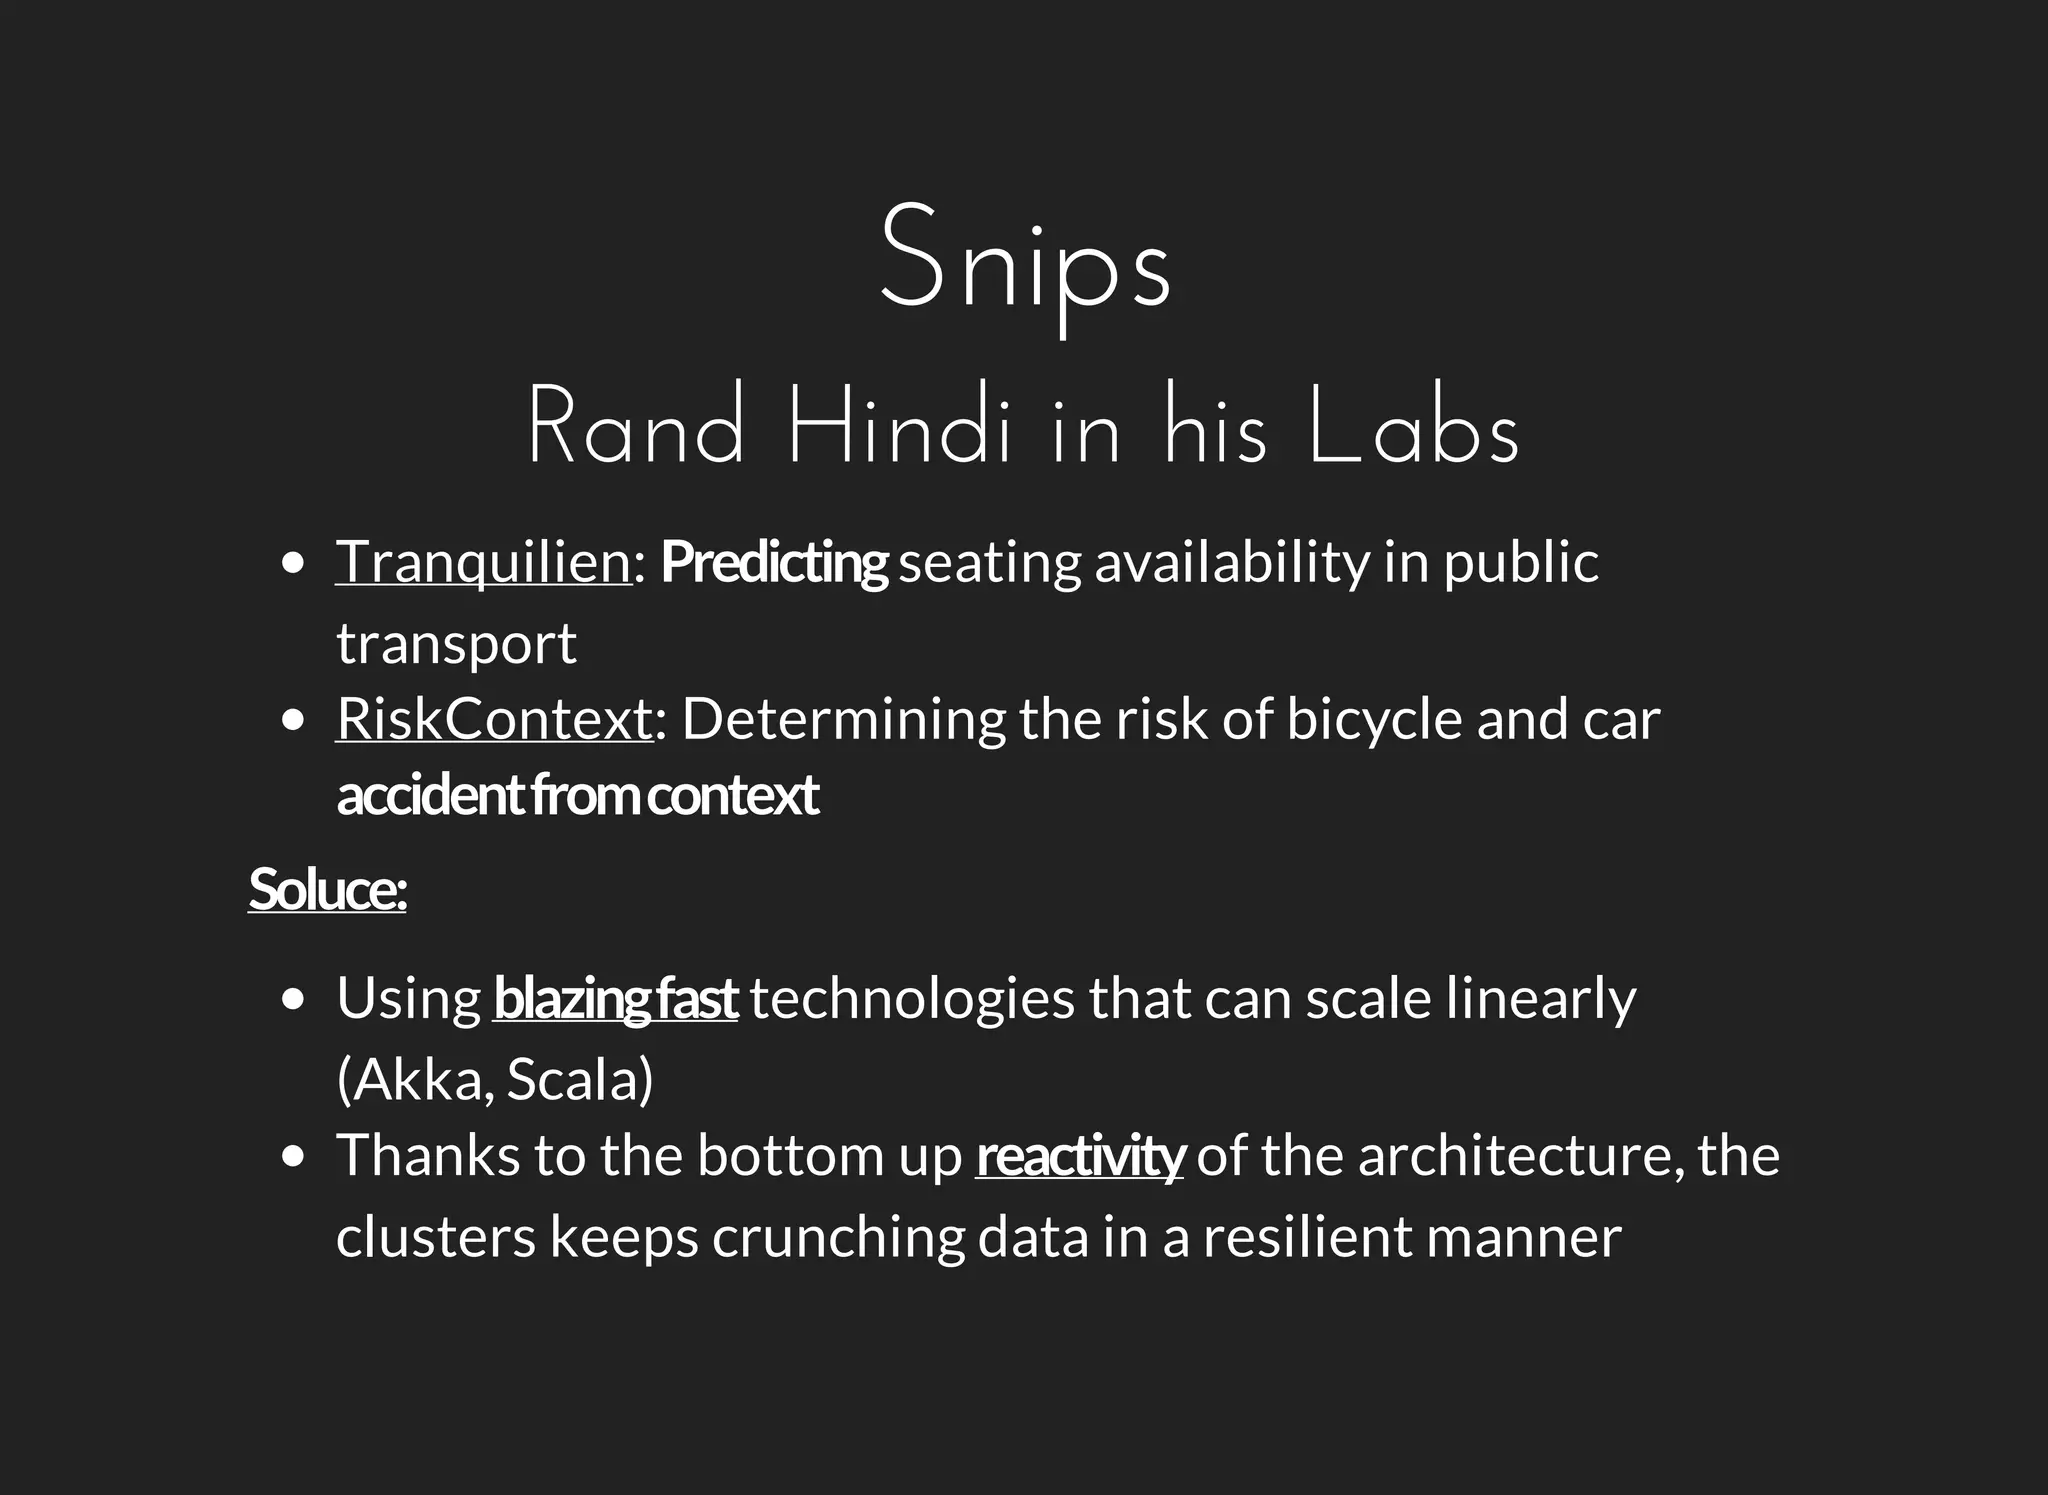


The document discusses the evolution of qualitative and quantitative GIS, highlighting its origins, technological advances, and the shift in data producers and users from government entities to private companies and developers. It notes the increasing complexity and capability of GIS tools, with mentions of specific satellite imagery and data management technologies. The author emphasizes the change in analytical approaches brought about by data-driven methodologies and machine learning, along with current projects that leverage these advancements.