Downloaded 189 times


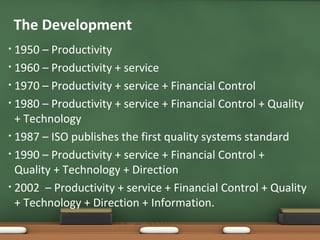


The document outlines the history and development of quality control and improvement concepts, highlighting key milestones from the 13th century to the early 2000s, including the introduction of total quality management (TQM). It emphasizes the significance of understanding and improving quality in relation to consumer decision-making and business success, detailing various quality characteristics and statistical methods for quality control. Additionally, it discusses the strategic importance of quality planning, quality assurance, and the need for a comprehensive approach involving all aspects of an organization.