SlideShare a Scribd company logo
Purchasing Managers’ Index                                                                                                 May 2, 2012


PMI remains unchanged at 50.2 in April – the industrial
economy lacks momentum
     The PMI remained at 50.2 in April, not budging from its March level. The index thus
     continues to hover near the 50 mark, which indicates that the industrial economy is
     neither growing nor contracting.
     The production index made the most significant positive contribution to the PMI,
     though the index for new orders also rose, primarily due to an increase in new
     orders from the export market. The index for supplier delivery times remained
     unchanged, but the level of this index indicates a degree of contraction.
     The component index for employment dropped as companies’ appetite for hiring
     appears to have waned. Companies continued to scale down production plans for
     the next six months, though the corresponding component index remains in the
     growth zone.
     The index for commodity and intermediate goods prices dropped by just over three
     points to 52.3. This decrease indicates lower cost pressures in manufacturing,
     though the index is still higher than it was last fall.

75

                                          Purchasing Managers' Index
70                                                                                                                                  PMI
                                                                                                                             (Purchasing Managers’
65
                                                                                                                                     Index)
                                                                                                                              Seasonally Adjusted
60
                                                                                                                             2012 Apr.      50.2
55                                                                                                                                Mar.      50.2
                                                                                                                                  Feb.      50.3
50                                                                                                                                Jan.      51.4
                                                                                                                             2011 Dec.      48.9
45                                                                                                                                Nov.      47.6
                                                                                                                                  Oct.      49.8
40
                                                         Unadjusted
                                                                                                                                  Sep.      48.1
                                                         Seasonally adjusted                                                      Aug.      48.7
35                                                                                                                                Jul.      50.1
                                                                                                                                  Jun.      52.9
30                                                                                                                                May       56.1
                                                                                                                                  Apr.      59.8
25

     94 95   96     97   98   99   2000    2001   2002   2003     2004   2005   2006   2007   2008   2009   2010   11 12


                         Next publication of Purchasing Managers’ Index: Friday, June 1, 2012


                  Magnus Alvesson, Swedbank, Economic Research Department, +46 (0)8-5859 3340
                             Administration, +46 (0)8-5859 7740, ek.sekr@swedbank.se
                         Sebastian Bergfelt, Silf, +46 (0)73-944 6450, professionals@silf.se

                                                                1 (4)
Silf/Swedbanks’ Purchasing Managers’ Index. seasonally adjusted
           PMI     Components of PMI                        Other indices                               Forecast

           Total   New      Produc-   Employ-   Delivery                  Export   Domestic Back-log                    Planned
           Index   orders   tion      ment      times       Inventories   orders   orders   of orders   Prices   Import Production

2009 Jan   33.8    29.0     33.3      32.1      30.3       41.8           34.2     27.9    25.9         29.1     35.5       32.9
     Feb   33.9    28.8     34.0      31.0      28.4       36.6           29.7     30.5    29.7         30.4     33.5       35.8
     Mar   36.7    35.1     38.8      31.1      28.0       39.6           39.7     35.5    30.8         27.7     38.5       38.2
     Apr   38.8    41.5     39.4      28.3      29.6       35.9           45.3     37.7    39.7         30.6     38.8       42.4
     May   43.7    46.4     47.4      31.1      34.2       33.5           47.5     44.1    42.8         32.7     41.0       47.3
     Jun   50.5    54.7     55.8      36.0      42.4       34.0           54.4     49.2    47.4         43.3     47.3       55.2
     Jul   54.3    60.5     61.0      40.3      44.4       38.4           56.4     58.1    54.1         46.9     51.0       59.1
     Aug   52.4    57.8     56.1      40.6      46.4       40.4           61.1     50.1    54.3         52.6     50.7       61.7
     Sep   55.9    59.2     60.5      45.0      53.7       40.6           61.1     55.0    54.0         54.5     55.7       63.3
     Oct   56.7    60.8     61.7      43.8      56.2       41.6           60.7     55.8    58.9         56.7     55.8       62.2
     Nov   56.0    57.9     59.0      48.7      55.0       41.3           59.7     53.6    53.6         59.8     57.0       62.2
     Dec   58.2    63.7     59.7      49.5      56.3       42.7           58.1     66.3    56.6         57.3     59.0       67.4

2010 Jan   61.7    66.8     70.2      49.6      61.5       48.3           62.3     64.8    62.6         61.2     61.3       69.5
     Feb   61.5    67.5     65.3      55.0      61.4       53.6           62.7     63.6    64.2         61.3     59.7       68.1
     Mar   61.1    63.8     63.7      54.9      67.0       50.2           62.3     58.9    60.6         65.7     62.3       69.6
     Apr   64.0    68.1     66.3      56.6      68.3       46.0           64.6     63.2    62.5         75.6     60.3       77.5
     May   66.0    68.8     71.0      60.1      71.5       50.7           62.6     64.1    64.3         71.0     59.9       73.0
     Jun   62.4    61.1     66.8      60.3      69.2       50.4           57.4     60.1    60.9         71.1     59.5       73.1
     Jul   64.2    67.3     72.2      56.3      66.4       51.4           61.4     63.2    63.4         70.9     60.9       72.0
     Aug   60.6    61.8     61.9      60.5      64.5       52.0           57.4     58.7    59.7         68.5     56.1       72.4
     Sep   63.3    65.8     67.4      60.3      66.3       52.9           61.4     62.9    62.2         71.1     58.6       70.8
     Oct   61.8    63.0     63.5      59.0      66.8       47.9           61.6     58.2    61.7         66.4     59.3       72.4
     Nov   61.3    60.4     64.2      60.2      67.2       50.2           58.9     56.3    58.2         70.8     61.4       72.5
     Dec   60.2    63.6     62.8      57.1      64.5       55.5           60.5     63.6    59.5         71.9     59.7       74.0

2011 Jan   61.5    64.2     64.9      57.7      64.6       51.9           61.9     62.1    60.2         77.1     58.6       70.9
     Feb   60.9    59.5     65.0      61.1      67.2       54.4           58.8     56.3    58.0         77.1     60.2       71.0
     Mar   58.6    56.1     61.4      58.3      66.0       52.0           54.7     54.0    54.3         73.8     58.9       71.6
     Apr   59.8    61.5     61.9      57.7      65.1       54.6           58.3     56.9    57.3         74.5     58.5       70.5
     May   56.1    55.4     59.8      54.4      61.0       55.6           52.8     56.4    55.3         63.5     56.2       69.1
     Jun   52.9    52.3     54.0      51.3      58.1       51.4           52.5     48.8    51.0         60.5     52.2       64.5
     Jul   50.1    45.4     49.4      53.7      55.4       50.1           46.9     43.4    49.1         51.5     50.4       63.1
     Aug   48.7    47.0     48.6      50.9      49.1       51.5           48.0     42.3    47.9         47.4     48.5       55.8
     Sep   48.1    46.5     48.9      50.0      47.5       52.0           48.3     46.2    47.0         47.0     45.8       53.8
     Oct   49.8    50.5     48.2      50.7      47.8       47.1           48.9     49.1    48.9         39.9     46.8       53.6
     Nov   47.6    47.1     46.2      48.3      45.6       46.0           47.5     46.1    45.1         42.6     44.5       51.6
     Dec   48.9    47.0     49.2      49.5      49.9       48.3           48.7     45.1    46.4         42.6     46.5       59.3

2012 Jan   51.4    52.0     52.9      48.0      51.0       47.0           49.9     49.0    50.6         50.3     50.3       56.2
     Feb   50.3    49.5     51.9      48.3      52.6       51.2           48.7     48.5    48.0         52.5     50.6       57.7
     Mar   50.2    50.5     48.6      49.5      49.3       43.7           50.1     48.6    48.6         55.3     47.9       56.5
     Apr   50.2    51.2     51.2      46.7      49.3       46.3           52.3     48.3    52.7         52.3     48.6       55.0


                                                           2 (4)
Silf/Swedbanks’ Purchasing Managers’ Index
           PMI     Components of PMI                                      Other indices                          Forecast

           Total   New-     Produc-   Employ-   Delivery                  Export   Domestic Back-log                    Planned
           Index   orders   tion      ment      times       Inventories   orders   orders   of orders   Prices   Import Production

2009 Jan   31.7    27.6     30.5      29.4      26.3       40.1           34.0     25.2    24.7         26.9     34.0       33.9
     Feb   34.8    32.0     35.3      29.9      26.3       35.2           33.1     32.1    32.5         29.7     33.7       38.2
     Mar   38.3    38.7     42.1      30.5      27.5       40.5           42.8     37.5    34.2         28.2     40.6       40.7
     Apr   41.1    44.8     43.2      29.7      30.6       36.8           47.8     40.4    42.6         34.1     40.6       45.1
     May   45.8    49.0     50.3      33.1      36.5       35.3           49.6     46.6    45.9         36.5     43.2       48.3
     Jun   53.9    59.4     60.8      39.1      45.5       37.3           58.3     53.5    50.3         45.1     50.0       54.6
     Jul   50.7    55.7     51.3      40.8      46.9       40.7           53.5     53.6    53.1         47.4     47.3       59.2
     Aug   56.2    62.9     62.9      41.9      49.3       41.5           64.6     55.3    60.2         54.5     53.9       64.7
     Sep   57.7    59.9     63.6      46.7      56.6       40.4           61.2     57.1    54.0         57.0     57.8       62.9
     Oct   56.1    58.6     61.1      43.6      57.2       40.4           58.1     54.7    55.0         56.8     54.7       59.6
     Nov   53.9    53.8     56.1      48.1      53.5       39.3           56.1     50.8    48.5         56.9     55.4       59.5
     Dec   54.2    57.9     53.5      47.2      52.8       39.3           61.6     52.8    50.8         52.8     56.0       65.7

2010 Jan   59.7    65.4     67.7      47.2      57.9       49.2           61.7     62.3    61.5         59.4     60.1       70.6
     Feb   62.2    70.4     66.3      54.3      59.4       52.9           65.5     65.0    66.9         60.6     59.8       70.2
     Mar   62.4    66.7     66.4      54.5      66.6       51.4           64.8     60.3    63.4         66.1     64.2       71.6
     Apr   66.0    70.9     69.6      58.0      69.2       46.8           66.6     65.4    64.9         79.3     61.7       79.9
     May   67.8    70.8     73.6      62.1      73.6       52.5           64.0     66.1    66.9         74.4     61.6       73.4
     Jun   65.3    64.9     71.2      63.2      71.8       53.6           60.4     63.7    63.2         72.5     61.6       72.0
     Jul   60.3    62.1     62.4      56.3      68.2       53.6           58.0     58.4    62.1         70.8     56.8       71.6
     Aug   63.9    66.3     68.0      61.5      66.7       53.0           60.4     63.4    65.1         69.7     58.7       75.0
     Sep   64.8    66.2     70.2      61.7      68.7       52.6           61.4     64.9    61.9         73.2     60.3       70.0
     Oct   60.9    60.5     62.5      58.4      67.3       46.3           58.9     56.6    57.6         65.8     57.9       69.5
     Nov   58.9    55.9     61.0      59.4      65.3       47.9           55.2     53.1    52.8         67.6     59.7       69.6
     Dec   56.0    57.6     56.2      54.3      60.5       52.1           55.9     58.3    53.4         67.2     56.6       72.2

2011 Jan   59.4    62.7     62.3      54.9      60.6       50.7           61.5     59.6    59.0         75.3     57.3       71.7
     Feb   61.5    62.2     65.9      60.3      65.0       53.7           61.6     57.4    60.5         76.4     60.3       72.8
     Mar   59.6    58.6     63.9      57.6      65.4       53.1           56.9     55.1    56.8         74.0     60.8       73.4
     Apr   61.7    64.3     65.0      58.9      65.8       55.4           60.3     59.0    59.6         78.1     59.9       72.8
     May   57.7    57.3     62.3      56.1      62.9       57.5           54.0     58.4    57.8         66.2     57.8       69.4
     Jun   55.6    56.1     58.1      54.1      59.9       54.8           55.8     52.4    53.7         61.8     54.0       63.1
     Jul   45.8    39.7     39.2      53.5      56.9       52.0           43.1     38.1    47.5         50.5     46.0       62.4
     Aug   51.7    51.3     54.4      51.7      50.7       52.4           50.7     46.6    53.0         47.7     50.7       57.8
     Sep   49.4    46.8     51.6      51.3      49.4       51.6           48.1     48.1    46.5         48.4     47.1       52.5
     Oct   48.9    48.1     47.1      50.0      48.1       45.1           46.2     47.7    44.9         38.5     45.2       50.3
     Nov   45.2    42.6     42.9      47.4      43.5       43.4           43.8     42.9    39.6         39.0     42.6       48.4
     Dec   44.8    41.2     42.8      46.7      46.0       44.8           44.2     39.9    40.4         37.7     43.4       57.7

2012 Jan   49.6    51.0     50.7      45.2      47.3       45.5           49.7     46.9    49.7         49.0     49.3       57.2
     Feb   51.1    52.4     53.1      47.6      50.7       50.7           51.7     50.0    50.7         52.5     51.0       59.8
     Mar   51.5    53.3     51.3      49.0      49.0       44.6           52.6     50.0    51.3         56.3     50.0       58.6
     Apr   52.4    54.4     54.7      48.0      50.3       47.2           54.7     50.7    55.5         56.5     50.3       57.5


                                                           3 (4)
4 (4)

More Related Content

What's hot

Purchasing Managers´Index Report, August 2011
Purchasing Managers´Index Report, August 2011Purchasing Managers´Index Report, August 2011
Purchasing Managers´Index Report, August 2011
Swedbank
 
Purchasing Managers´Index Report, September 2011
Purchasing Managers´Index Report, September 2011Purchasing Managers´Index Report, September 2011
Purchasing Managers´Index Report, September 2011
Swedbank
 

What's hot (12)

Purchasing Managers´Index Report, December 2011
Purchasing Managers´Index Report, December 2011Purchasing Managers´Index Report, December 2011
Purchasing Managers´Index Report, December 2011
 
Purchasing Managers´Index Report, August 2011
Purchasing Managers´Index Report, August 2011Purchasing Managers´Index Report, August 2011
Purchasing Managers´Index Report, August 2011
 
Purchasing Managers´Index Report, October 2011
Purchasing Managers´Index Report, October 2011Purchasing Managers´Index Report, October 2011
Purchasing Managers´Index Report, October 2011
 
Purchasing Managers´Index Report, September 2011
Purchasing Managers´Index Report, September 2011Purchasing Managers´Index Report, September 2011
Purchasing Managers´Index Report, September 2011
 
Purchasing Managers´Index Report, July 2011
Purchasing Managers´Index Report, July 2011Purchasing Managers´Index Report, July 2011
Purchasing Managers´Index Report, July 2011
 
Purchasing Managers´Index Report, June 2011
Purchasing Managers´Index Report, June 2011Purchasing Managers´Index Report, June 2011
Purchasing Managers´Index Report, June 2011
 
Purchasing Managers´Index Report, May 2011
Purchasing Managers´Index Report, May 2011Purchasing Managers´Index Report, May 2011
Purchasing Managers´Index Report, May 2011
 
Purchasing Managers' Index Services - September 5, 2012
Purchasing Managers' Index Services -  September 5, 2012Purchasing Managers' Index Services -  September 5, 2012
Purchasing Managers' Index Services - September 5, 2012
 
Purchasing Managers' Index Services - April 2012
Purchasing Managers' Index Services - April 2012Purchasing Managers' Index Services - April 2012
Purchasing Managers' Index Services - April 2012
 
Is241
Is241Is241
Is241
 
Purchasing Managers´ Index Services, October 2011
Purchasing Managers´ Index Services, October 2011Purchasing Managers´ Index Services, October 2011
Purchasing Managers´ Index Services, October 2011
 
Purchasing Managers´ Index Services, August 2011
Purchasing Managers´ Index Services, August 2011Purchasing Managers´ Index Services, August 2011
Purchasing Managers´ Index Services, August 2011
 

Similar to Purchasing Managers' Index April 2012

Purchasing Managers' Index
Purchasing Managers' IndexPurchasing Managers' Index
Purchasing Managers' Index
Swedbank
 
Energy & Commodities
Energy & CommoditiesEnergy & Commodities
Energy & Commodities
Swedbank
 

Similar to Purchasing Managers' Index April 2012 (20)

Purchasing Managers' Index Services - February 2012
Purchasing Managers' Index Services - February 2012Purchasing Managers' Index Services - February 2012
Purchasing Managers' Index Services - February 2012
 
Purchasing Managers´Index Report, March 2011
Purchasing Managers´Index Report, March 2011Purchasing Managers´Index Report, March 2011
Purchasing Managers´Index Report, March 2011
 
Purchasing Managers´Index Report, February 2011
Purchasing Managers´Index Report, February 2011Purchasing Managers´Index Report, February 2011
Purchasing Managers´Index Report, February 2011
 
Purchasing Managers' Index
Purchasing Managers' IndexPurchasing Managers' Index
Purchasing Managers' Index
 
Purchasing Managers´ Index Services, September 2011
Purchasing Managers´ Index Services, September 2011Purchasing Managers´ Index Services, September 2011
Purchasing Managers´ Index Services, September 2011
 
Energy & Commodities
Energy & CommoditiesEnergy & Commodities
Energy & Commodities
 
Purchasing Managers' Index December 2010
Purchasing Managers' Index December 2010Purchasing Managers' Index December 2010
Purchasing Managers' Index December 2010
 
Purchasing Managers' Index
Purchasing Managers' IndexPurchasing Managers' Index
Purchasing Managers' Index
 
Purchasing Managers' Index, 2010 March
Purchasing Managers' Index, 2010 MarchPurchasing Managers' Index, 2010 March
Purchasing Managers' Index, 2010 March
 
Purchasing Managers' Index Report August 2009
Purchasing Managers' Index Report August 2009Purchasing Managers' Index Report August 2009
Purchasing Managers' Index Report August 2009
 
Purchasing Managers' Index Report October 2009
Purchasing Managers' Index Report October 2009Purchasing Managers' Index Report October 2009
Purchasing Managers' Index Report October 2009
 
Purchasing Managers´ Index Services, July 2011
Purchasing Managers´ Index Services, July 2011Purchasing Managers´ Index Services, July 2011
Purchasing Managers´ Index Services, July 2011
 
Purchasing Managers' Index Report December 2009
Purchasing Managers' Index Report December 2009Purchasing Managers' Index Report December 2009
Purchasing Managers' Index Report December 2009
 
Purchasing Managers´ Index Services, April 2011
Purchasing Managers´ Index Services, April 2011Purchasing Managers´ Index Services, April 2011
Purchasing Managers´ Index Services, April 2011
 
Purchasing Managers' Index Report July 2009
Purchasing Managers' Index Report July 2009Purchasing Managers' Index Report July 2009
Purchasing Managers' Index Report July 2009
 
Purchasing Managers' Index Report May 2010
Purchasing Managers' Index Report May 2010Purchasing Managers' Index Report May 2010
Purchasing Managers' Index Report May 2010
 
Purchasing Managers' Index Report May 2009
Purchasing Managers' Index Report May 2009Purchasing Managers' Index Report May 2009
Purchasing Managers' Index Report May 2009
 
Purchasing Managers Index Report 2010 January
Purchasing Managers Index Report 2010 JanuaryPurchasing Managers Index Report 2010 January
Purchasing Managers Index Report 2010 January
 
Purchasing Managers' Index Report 2010 February
Purchasing Managers' Index Report 2010 FebruaryPurchasing Managers' Index Report 2010 February
Purchasing Managers' Index Report 2010 February
 
Purchasing Managers' Index - Services
Purchasing Managers' Index - ServicesPurchasing Managers' Index - Services
Purchasing Managers' Index - Services
 

More from Swedbank

More from Swedbank (20)

Swedbank corporate presentation April 25 2017
Swedbank corporate presentation April 25 2017Swedbank corporate presentation April 25 2017
Swedbank corporate presentation April 25 2017
 
Swedbank foretagspresentation 25 april 2017
Swedbank foretagspresentation 25 april 2017Swedbank foretagspresentation 25 april 2017
Swedbank foretagspresentation 25 april 2017
 
Delårsrapport kv1 2017
Delårsrapport kv1 2017Delårsrapport kv1 2017
Delårsrapport kv1 2017
 
Interim report q1 2017
Interim report q1 2017Interim report q1 2017
Interim report q1 2017
 
Year end report 2016
Year end report 2016Year end report 2016
Year end report 2016
 
Bokslutskommuniké 2016
Bokslutskommuniké 2016Bokslutskommuniké 2016
Bokslutskommuniké 2016
 
Swedbank företagspresentation, 2 februari 2017
Swedbank företagspresentation, 2 februari 2017Swedbank företagspresentation, 2 februari 2017
Swedbank företagspresentation, 2 februari 2017
 
Swedbank corporate presentation, February 2 2017
Swedbank corporate presentation, February 2 2017Swedbank corporate presentation, February 2 2017
Swedbank corporate presentation, February 2 2017
 
Swedbank Corporate Presentation, October 25 2016
Swedbank Corporate Presentation, October 25 2016Swedbank Corporate Presentation, October 25 2016
Swedbank Corporate Presentation, October 25 2016
 
Swedbank företagspresentation, 25 oktober 2016
Swedbank företagspresentation, 25 oktober 2016Swedbank företagspresentation, 25 oktober 2016
Swedbank företagspresentation, 25 oktober 2016
 
Swedbank Corporate Presentation, June 30 2016
Swedbank Corporate Presentation, June 30 2016Swedbank Corporate Presentation, June 30 2016
Swedbank Corporate Presentation, June 30 2016
 
Swedbank företagspresentation, 30 juni 2016
Swedbank företagspresentation, 30 juni 2016Swedbank företagspresentation, 30 juni 2016
Swedbank företagspresentation, 30 juni 2016
 
Swedbank corporate presentation Q1, 2016
Swedbank corporate presentation Q1, 2016Swedbank corporate presentation Q1, 2016
Swedbank corporate presentation Q1, 2016
 
Swedbank företagspresentation kvartal 1, 2016.
Swedbank företagspresentation kvartal 1, 2016.Swedbank företagspresentation kvartal 1, 2016.
Swedbank företagspresentation kvartal 1, 2016.
 
Swedbank corporate presentation Q4, 2015
Swedbank corporate presentation Q4, 2015Swedbank corporate presentation Q4, 2015
Swedbank corporate presentation Q4, 2015
 
Swedbank företagspresentation kvartal 4,2015
Swedbank företagspresentation kvartal 4,2015Swedbank företagspresentation kvartal 4,2015
Swedbank företagspresentation kvartal 4,2015
 
Year end report 2015
Year end report 2015Year end report 2015
Year end report 2015
 
Bokslutskommuniké 2015
Bokslutskommuniké 2015Bokslutskommuniké 2015
Bokslutskommuniké 2015
 
Swedbank Företagspresentation, September 2015
Swedbank Företagspresentation, September 2015Swedbank Företagspresentation, September 2015
Swedbank Företagspresentation, September 2015
 
Swedbank Corporate Presentation, September 2015
Swedbank Corporate Presentation, September 2015Swedbank Corporate Presentation, September 2015
Swedbank Corporate Presentation, September 2015
 

Recently uploaded

Memorandum Of Association Constitution of Company.ppt
Memorandum Of Association Constitution of Company.pptMemorandum Of Association Constitution of Company.ppt
Memorandum Of Association Constitution of Company.ppt
seri bangash
 
chapter 10 - excise tax of transfer and business taxation
chapter 10 - excise tax of transfer and business taxationchapter 10 - excise tax of transfer and business taxation
chapter 10 - excise tax of transfer and business taxation
AUDIJEAngelo
 

Recently uploaded (20)

Memorandum Of Association Constitution of Company.ppt
Memorandum Of Association Constitution of Company.pptMemorandum Of Association Constitution of Company.ppt
Memorandum Of Association Constitution of Company.ppt
 
Global Interconnection Group Joint Venture[960] (1).pdf
Global Interconnection Group Joint Venture[960] (1).pdfGlobal Interconnection Group Joint Venture[960] (1).pdf
Global Interconnection Group Joint Venture[960] (1).pdf
 
Meaningful Technology for Humans: How Strategy Helps to Deliver Real Value fo...
Meaningful Technology for Humans: How Strategy Helps to Deliver Real Value fo...Meaningful Technology for Humans: How Strategy Helps to Deliver Real Value fo...
Meaningful Technology for Humans: How Strategy Helps to Deliver Real Value fo...
 
Improving profitability for small business
Improving profitability for small businessImproving profitability for small business
Improving profitability for small business
 
Equinox Gold Corporate Deck May 24th 2024
Equinox Gold Corporate Deck May 24th 2024Equinox Gold Corporate Deck May 24th 2024
Equinox Gold Corporate Deck May 24th 2024
 
RMD24 | Retail media: hoe zet je dit in als je geen AH of Unilever bent? Heid...
RMD24 | Retail media: hoe zet je dit in als je geen AH of Unilever bent? Heid...RMD24 | Retail media: hoe zet je dit in als je geen AH of Unilever bent? Heid...
RMD24 | Retail media: hoe zet je dit in als je geen AH of Unilever bent? Heid...
 
Maximizing Efficiency Migrating AccountEdge Data to QuickBooks.pdf
Maximizing Efficiency Migrating AccountEdge Data to QuickBooks.pdfMaximizing Efficiency Migrating AccountEdge Data to QuickBooks.pdf
Maximizing Efficiency Migrating AccountEdge Data to QuickBooks.pdf
 
Hyundai capital 2024 1quarter Earnings release
Hyundai capital 2024 1quarter Earnings releaseHyundai capital 2024 1quarter Earnings release
Hyundai capital 2024 1quarter Earnings release
 
What are the main advantages of using HR recruiter services.pdf
What are the main advantages of using HR recruiter services.pdfWhat are the main advantages of using HR recruiter services.pdf
What are the main advantages of using HR recruiter services.pdf
 
Understanding UAE Labour Law: Key Points for Employers and Employees
Understanding UAE Labour Law: Key Points for Employers and EmployeesUnderstanding UAE Labour Law: Key Points for Employers and Employees
Understanding UAE Labour Law: Key Points for Employers and Employees
 
sales plan presentation by mckinsey alum
sales plan presentation by mckinsey alumsales plan presentation by mckinsey alum
sales plan presentation by mckinsey alum
 
IPTV Subscription UK: Your Guide to Choosing the Best Service
IPTV Subscription UK: Your Guide to Choosing the Best ServiceIPTV Subscription UK: Your Guide to Choosing the Best Service
IPTV Subscription UK: Your Guide to Choosing the Best Service
 
chapter 10 - excise tax of transfer and business taxation
chapter 10 - excise tax of transfer and business taxationchapter 10 - excise tax of transfer and business taxation
chapter 10 - excise tax of transfer and business taxation
 
BeMetals Presentation_May_22_2024 .pdf
BeMetals Presentation_May_22_2024   .pdfBeMetals Presentation_May_22_2024   .pdf
BeMetals Presentation_May_22_2024 .pdf
 
Putting the SPARK into Virtual Training.pptx
Putting the SPARK into Virtual Training.pptxPutting the SPARK into Virtual Training.pptx
Putting the SPARK into Virtual Training.pptx
 
Accpac to QuickBooks Conversion Navigating the Transition with Online Account...
Accpac to QuickBooks Conversion Navigating the Transition with Online Account...Accpac to QuickBooks Conversion Navigating the Transition with Online Account...
Accpac to QuickBooks Conversion Navigating the Transition with Online Account...
 
falcon-invoice-discounting-a-premier-platform-for-investors-in-india
falcon-invoice-discounting-a-premier-platform-for-investors-in-indiafalcon-invoice-discounting-a-premier-platform-for-investors-in-india
falcon-invoice-discounting-a-premier-platform-for-investors-in-india
 
Pitch Deck Teardown: RAW Dating App's $3M Angel deck
Pitch Deck Teardown: RAW Dating App's $3M Angel deckPitch Deck Teardown: RAW Dating App's $3M Angel deck
Pitch Deck Teardown: RAW Dating App's $3M Angel deck
 
Taurus Zodiac Sign_ Personality Traits and Sign Dates.pptx
Taurus Zodiac Sign_ Personality Traits and Sign Dates.pptxTaurus Zodiac Sign_ Personality Traits and Sign Dates.pptx
Taurus Zodiac Sign_ Personality Traits and Sign Dates.pptx
 
IPTV Subscription in Ireland: Elevating Your Entertainment Experience
IPTV Subscription in Ireland: Elevating Your Entertainment ExperienceIPTV Subscription in Ireland: Elevating Your Entertainment Experience
IPTV Subscription in Ireland: Elevating Your Entertainment Experience
 

Purchasing Managers' Index April 2012

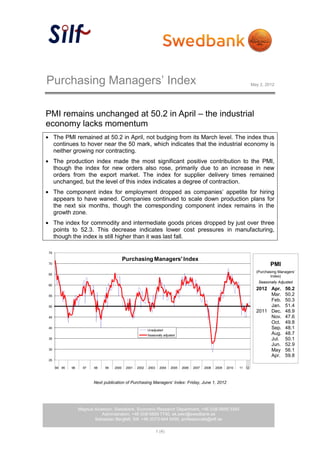
  • 1. Purchasing Managers’ Index May 2, 2012 PMI remains unchanged at 50.2 in April – the industrial economy lacks momentum The PMI remained at 50.2 in April, not budging from its March level. The index thus continues to hover near the 50 mark, which indicates that the industrial economy is neither growing nor contracting. The production index made the most significant positive contribution to the PMI, though the index for new orders also rose, primarily due to an increase in new orders from the export market. The index for supplier delivery times remained unchanged, but the level of this index indicates a degree of contraction. The component index for employment dropped as companies’ appetite for hiring appears to have waned. Companies continued to scale down production plans for the next six months, though the corresponding component index remains in the growth zone. The index for commodity and intermediate goods prices dropped by just over three points to 52.3. This decrease indicates lower cost pressures in manufacturing, though the index is still higher than it was last fall. 75 Purchasing Managers' Index 70 PMI (Purchasing Managers’ 65 Index) Seasonally Adjusted 60 2012 Apr. 50.2 55 Mar. 50.2 Feb. 50.3 50 Jan. 51.4 2011 Dec. 48.9 45 Nov. 47.6 Oct. 49.8 40 Unadjusted Sep. 48.1 Seasonally adjusted Aug. 48.7 35 Jul. 50.1 Jun. 52.9 30 May 56.1 Apr. 59.8 25 94 95 96 97 98 99 2000 2001 2002 2003 2004 2005 2006 2007 2008 2009 2010 11 12 Next publication of Purchasing Managers’ Index: Friday, June 1, 2012 Magnus Alvesson, Swedbank, Economic Research Department, +46 (0)8-5859 3340 Administration, +46 (0)8-5859 7740, ek.sekr@swedbank.se Sebastian Bergfelt, Silf, +46 (0)73-944 6450, professionals@silf.se 1 (4)
  • 2. Silf/Swedbanks’ Purchasing Managers’ Index. seasonally adjusted PMI Components of PMI Other indices Forecast Total New Produc- Employ- Delivery Export Domestic Back-log Planned Index orders tion ment times Inventories orders orders of orders Prices Import Production 2009 Jan 33.8 29.0 33.3 32.1 30.3 41.8 34.2 27.9 25.9 29.1 35.5 32.9 Feb 33.9 28.8 34.0 31.0 28.4 36.6 29.7 30.5 29.7 30.4 33.5 35.8 Mar 36.7 35.1 38.8 31.1 28.0 39.6 39.7 35.5 30.8 27.7 38.5 38.2 Apr 38.8 41.5 39.4 28.3 29.6 35.9 45.3 37.7 39.7 30.6 38.8 42.4 May 43.7 46.4 47.4 31.1 34.2 33.5 47.5 44.1 42.8 32.7 41.0 47.3 Jun 50.5 54.7 55.8 36.0 42.4 34.0 54.4 49.2 47.4 43.3 47.3 55.2 Jul 54.3 60.5 61.0 40.3 44.4 38.4 56.4 58.1 54.1 46.9 51.0 59.1 Aug 52.4 57.8 56.1 40.6 46.4 40.4 61.1 50.1 54.3 52.6 50.7 61.7 Sep 55.9 59.2 60.5 45.0 53.7 40.6 61.1 55.0 54.0 54.5 55.7 63.3 Oct 56.7 60.8 61.7 43.8 56.2 41.6 60.7 55.8 58.9 56.7 55.8 62.2 Nov 56.0 57.9 59.0 48.7 55.0 41.3 59.7 53.6 53.6 59.8 57.0 62.2 Dec 58.2 63.7 59.7 49.5 56.3 42.7 58.1 66.3 56.6 57.3 59.0 67.4 2010 Jan 61.7 66.8 70.2 49.6 61.5 48.3 62.3 64.8 62.6 61.2 61.3 69.5 Feb 61.5 67.5 65.3 55.0 61.4 53.6 62.7 63.6 64.2 61.3 59.7 68.1 Mar 61.1 63.8 63.7 54.9 67.0 50.2 62.3 58.9 60.6 65.7 62.3 69.6 Apr 64.0 68.1 66.3 56.6 68.3 46.0 64.6 63.2 62.5 75.6 60.3 77.5 May 66.0 68.8 71.0 60.1 71.5 50.7 62.6 64.1 64.3 71.0 59.9 73.0 Jun 62.4 61.1 66.8 60.3 69.2 50.4 57.4 60.1 60.9 71.1 59.5 73.1 Jul 64.2 67.3 72.2 56.3 66.4 51.4 61.4 63.2 63.4 70.9 60.9 72.0 Aug 60.6 61.8 61.9 60.5 64.5 52.0 57.4 58.7 59.7 68.5 56.1 72.4 Sep 63.3 65.8 67.4 60.3 66.3 52.9 61.4 62.9 62.2 71.1 58.6 70.8 Oct 61.8 63.0 63.5 59.0 66.8 47.9 61.6 58.2 61.7 66.4 59.3 72.4 Nov 61.3 60.4 64.2 60.2 67.2 50.2 58.9 56.3 58.2 70.8 61.4 72.5 Dec 60.2 63.6 62.8 57.1 64.5 55.5 60.5 63.6 59.5 71.9 59.7 74.0 2011 Jan 61.5 64.2 64.9 57.7 64.6 51.9 61.9 62.1 60.2 77.1 58.6 70.9 Feb 60.9 59.5 65.0 61.1 67.2 54.4 58.8 56.3 58.0 77.1 60.2 71.0 Mar 58.6 56.1 61.4 58.3 66.0 52.0 54.7 54.0 54.3 73.8 58.9 71.6 Apr 59.8 61.5 61.9 57.7 65.1 54.6 58.3 56.9 57.3 74.5 58.5 70.5 May 56.1 55.4 59.8 54.4 61.0 55.6 52.8 56.4 55.3 63.5 56.2 69.1 Jun 52.9 52.3 54.0 51.3 58.1 51.4 52.5 48.8 51.0 60.5 52.2 64.5 Jul 50.1 45.4 49.4 53.7 55.4 50.1 46.9 43.4 49.1 51.5 50.4 63.1 Aug 48.7 47.0 48.6 50.9 49.1 51.5 48.0 42.3 47.9 47.4 48.5 55.8 Sep 48.1 46.5 48.9 50.0 47.5 52.0 48.3 46.2 47.0 47.0 45.8 53.8 Oct 49.8 50.5 48.2 50.7 47.8 47.1 48.9 49.1 48.9 39.9 46.8 53.6 Nov 47.6 47.1 46.2 48.3 45.6 46.0 47.5 46.1 45.1 42.6 44.5 51.6 Dec 48.9 47.0 49.2 49.5 49.9 48.3 48.7 45.1 46.4 42.6 46.5 59.3 2012 Jan 51.4 52.0 52.9 48.0 51.0 47.0 49.9 49.0 50.6 50.3 50.3 56.2 Feb 50.3 49.5 51.9 48.3 52.6 51.2 48.7 48.5 48.0 52.5 50.6 57.7 Mar 50.2 50.5 48.6 49.5 49.3 43.7 50.1 48.6 48.6 55.3 47.9 56.5 Apr 50.2 51.2 51.2 46.7 49.3 46.3 52.3 48.3 52.7 52.3 48.6 55.0 2 (4)
  • 3. Silf/Swedbanks’ Purchasing Managers’ Index PMI Components of PMI Other indices Forecast Total New- Produc- Employ- Delivery Export Domestic Back-log Planned Index orders tion ment times Inventories orders orders of orders Prices Import Production 2009 Jan 31.7 27.6 30.5 29.4 26.3 40.1 34.0 25.2 24.7 26.9 34.0 33.9 Feb 34.8 32.0 35.3 29.9 26.3 35.2 33.1 32.1 32.5 29.7 33.7 38.2 Mar 38.3 38.7 42.1 30.5 27.5 40.5 42.8 37.5 34.2 28.2 40.6 40.7 Apr 41.1 44.8 43.2 29.7 30.6 36.8 47.8 40.4 42.6 34.1 40.6 45.1 May 45.8 49.0 50.3 33.1 36.5 35.3 49.6 46.6 45.9 36.5 43.2 48.3 Jun 53.9 59.4 60.8 39.1 45.5 37.3 58.3 53.5 50.3 45.1 50.0 54.6 Jul 50.7 55.7 51.3 40.8 46.9 40.7 53.5 53.6 53.1 47.4 47.3 59.2 Aug 56.2 62.9 62.9 41.9 49.3 41.5 64.6 55.3 60.2 54.5 53.9 64.7 Sep 57.7 59.9 63.6 46.7 56.6 40.4 61.2 57.1 54.0 57.0 57.8 62.9 Oct 56.1 58.6 61.1 43.6 57.2 40.4 58.1 54.7 55.0 56.8 54.7 59.6 Nov 53.9 53.8 56.1 48.1 53.5 39.3 56.1 50.8 48.5 56.9 55.4 59.5 Dec 54.2 57.9 53.5 47.2 52.8 39.3 61.6 52.8 50.8 52.8 56.0 65.7 2010 Jan 59.7 65.4 67.7 47.2 57.9 49.2 61.7 62.3 61.5 59.4 60.1 70.6 Feb 62.2 70.4 66.3 54.3 59.4 52.9 65.5 65.0 66.9 60.6 59.8 70.2 Mar 62.4 66.7 66.4 54.5 66.6 51.4 64.8 60.3 63.4 66.1 64.2 71.6 Apr 66.0 70.9 69.6 58.0 69.2 46.8 66.6 65.4 64.9 79.3 61.7 79.9 May 67.8 70.8 73.6 62.1 73.6 52.5 64.0 66.1 66.9 74.4 61.6 73.4 Jun 65.3 64.9 71.2 63.2 71.8 53.6 60.4 63.7 63.2 72.5 61.6 72.0 Jul 60.3 62.1 62.4 56.3 68.2 53.6 58.0 58.4 62.1 70.8 56.8 71.6 Aug 63.9 66.3 68.0 61.5 66.7 53.0 60.4 63.4 65.1 69.7 58.7 75.0 Sep 64.8 66.2 70.2 61.7 68.7 52.6 61.4 64.9 61.9 73.2 60.3 70.0 Oct 60.9 60.5 62.5 58.4 67.3 46.3 58.9 56.6 57.6 65.8 57.9 69.5 Nov 58.9 55.9 61.0 59.4 65.3 47.9 55.2 53.1 52.8 67.6 59.7 69.6 Dec 56.0 57.6 56.2 54.3 60.5 52.1 55.9 58.3 53.4 67.2 56.6 72.2 2011 Jan 59.4 62.7 62.3 54.9 60.6 50.7 61.5 59.6 59.0 75.3 57.3 71.7 Feb 61.5 62.2 65.9 60.3 65.0 53.7 61.6 57.4 60.5 76.4 60.3 72.8 Mar 59.6 58.6 63.9 57.6 65.4 53.1 56.9 55.1 56.8 74.0 60.8 73.4 Apr 61.7 64.3 65.0 58.9 65.8 55.4 60.3 59.0 59.6 78.1 59.9 72.8 May 57.7 57.3 62.3 56.1 62.9 57.5 54.0 58.4 57.8 66.2 57.8 69.4 Jun 55.6 56.1 58.1 54.1 59.9 54.8 55.8 52.4 53.7 61.8 54.0 63.1 Jul 45.8 39.7 39.2 53.5 56.9 52.0 43.1 38.1 47.5 50.5 46.0 62.4 Aug 51.7 51.3 54.4 51.7 50.7 52.4 50.7 46.6 53.0 47.7 50.7 57.8 Sep 49.4 46.8 51.6 51.3 49.4 51.6 48.1 48.1 46.5 48.4 47.1 52.5 Oct 48.9 48.1 47.1 50.0 48.1 45.1 46.2 47.7 44.9 38.5 45.2 50.3 Nov 45.2 42.6 42.9 47.4 43.5 43.4 43.8 42.9 39.6 39.0 42.6 48.4 Dec 44.8 41.2 42.8 46.7 46.0 44.8 44.2 39.9 40.4 37.7 43.4 57.7 2012 Jan 49.6 51.0 50.7 45.2 47.3 45.5 49.7 46.9 49.7 49.0 49.3 57.2 Feb 51.1 52.4 53.1 47.6 50.7 50.7 51.7 50.0 50.7 52.5 51.0 59.8 Mar 51.5 53.3 51.3 49.0 49.0 44.6 52.6 50.0 51.3 56.3 50.0 58.6 Apr 52.4 54.4 54.7 48.0 50.3 47.2 54.7 50.7 55.5 56.5 50.3 57.5 3 (4)