Download to read offline
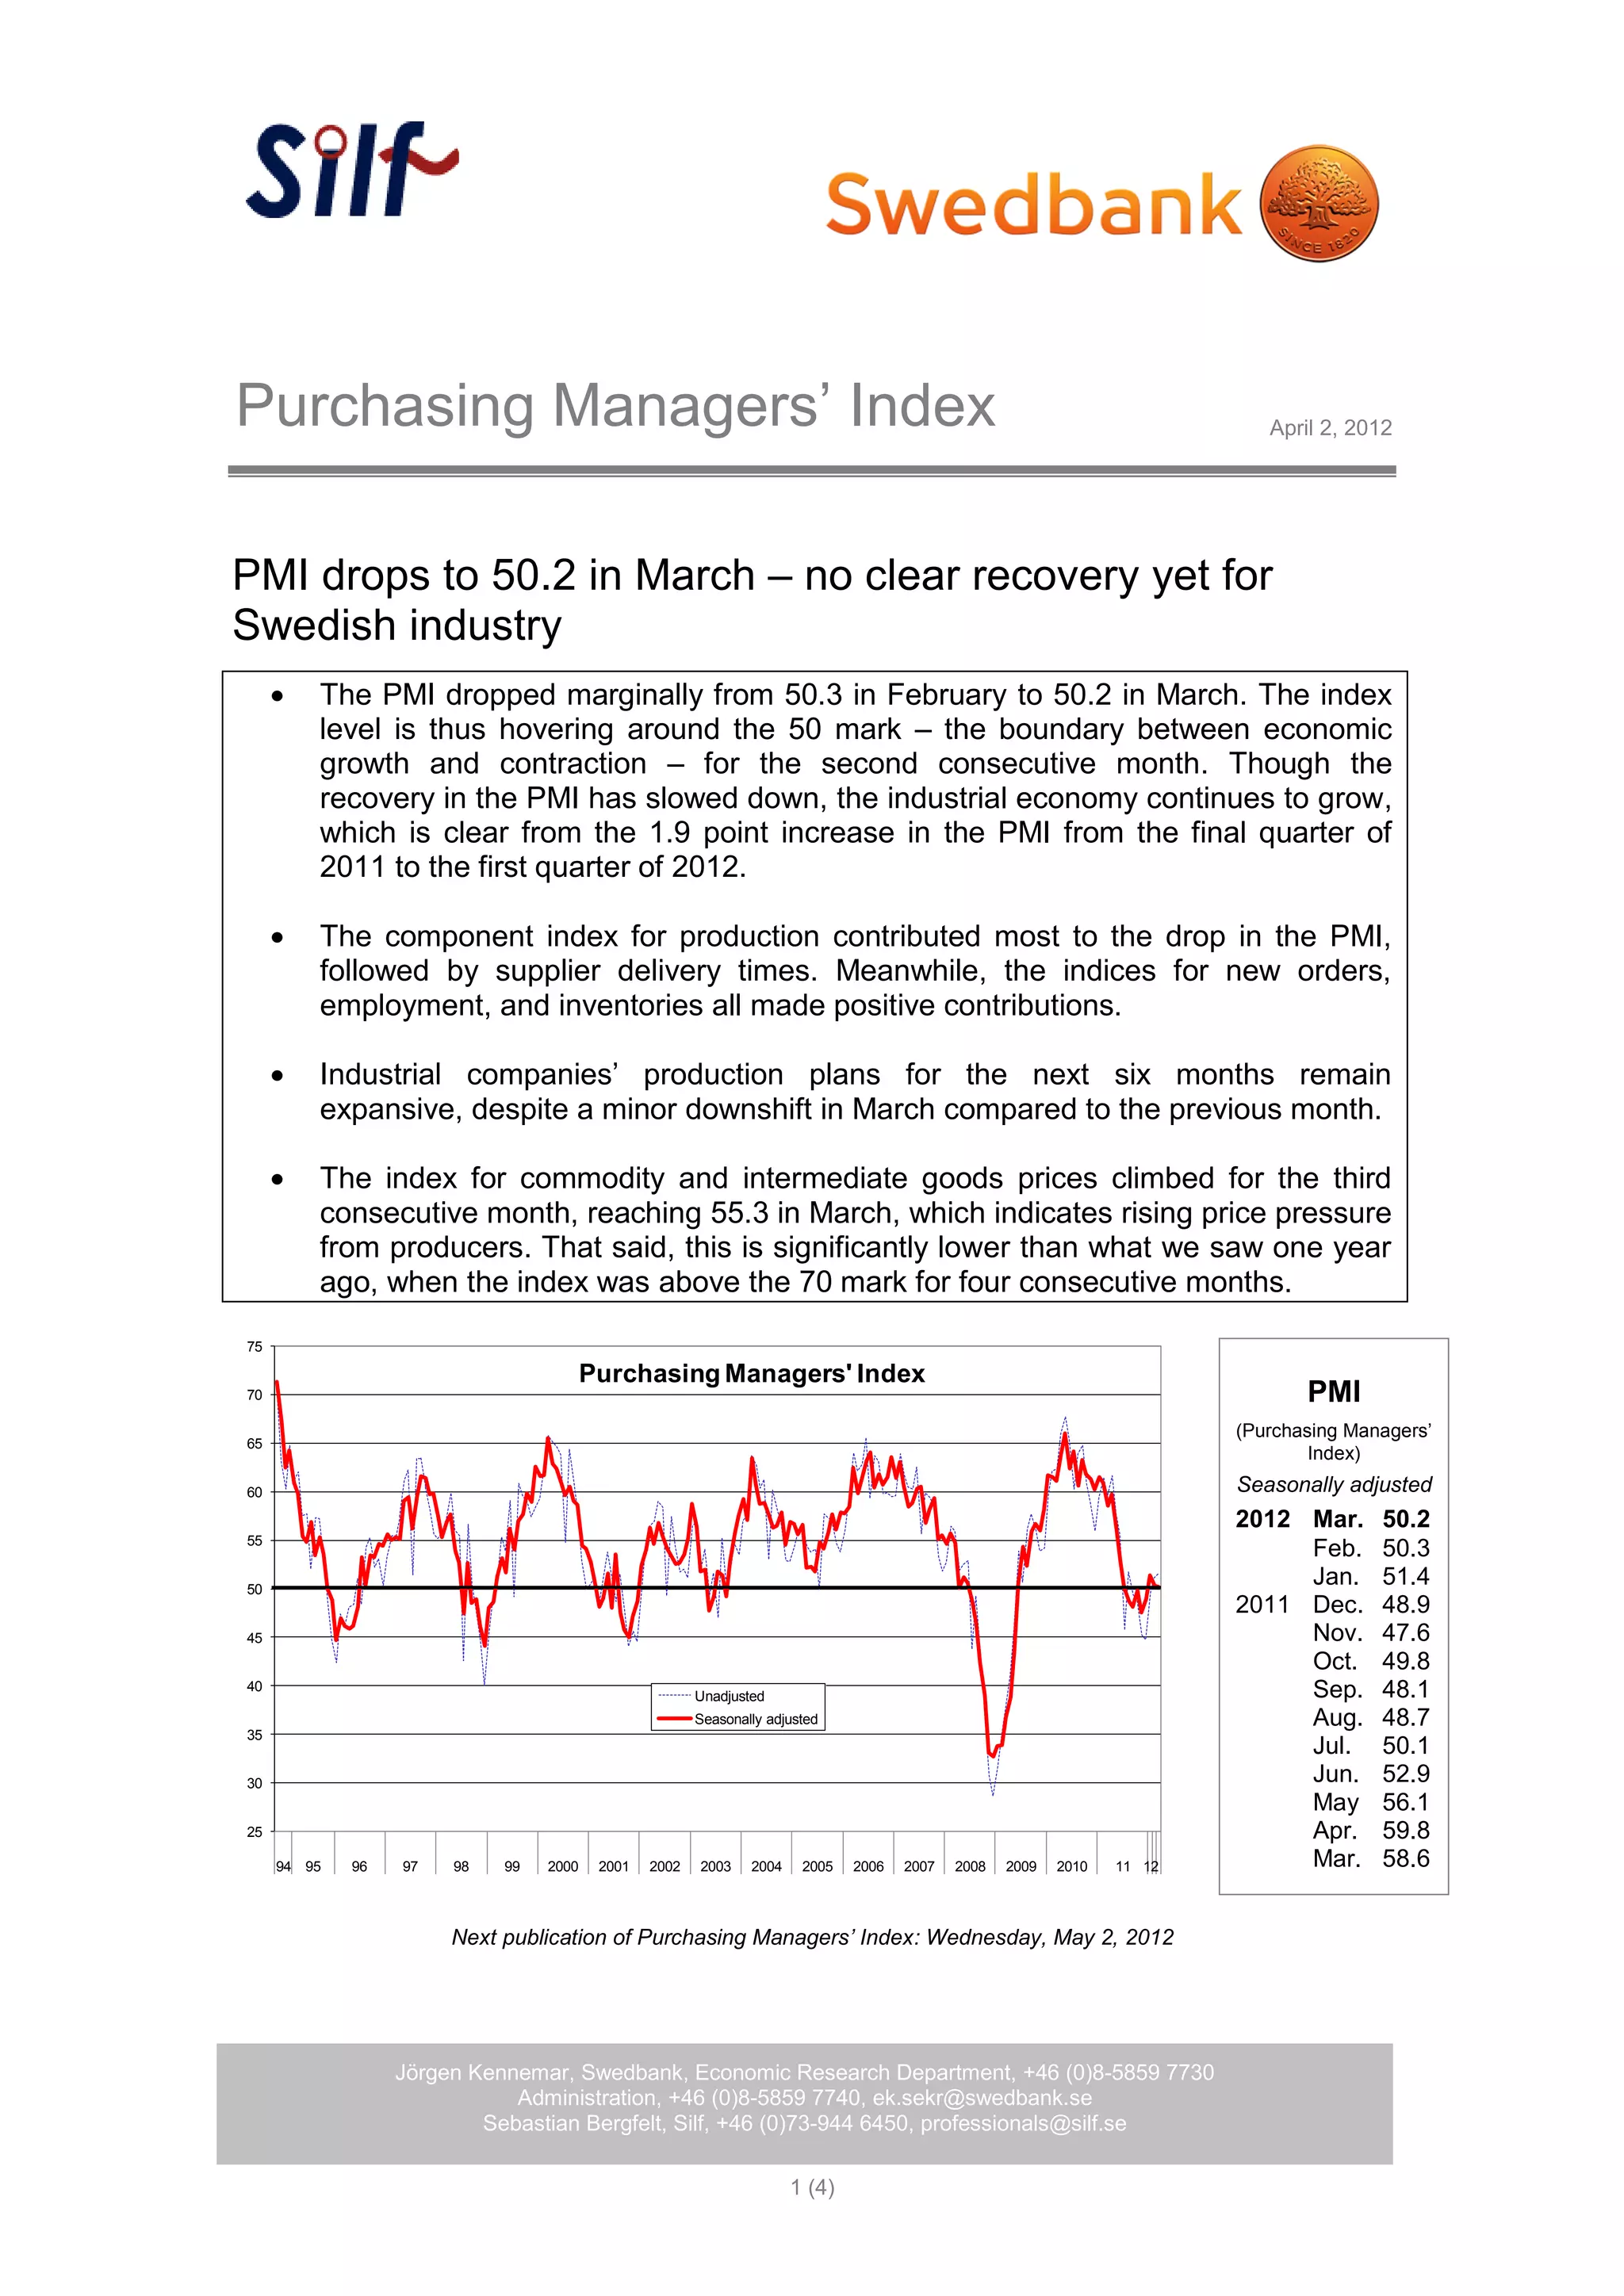

The purchasing managers' index (PMI) for Swedish industry decreased slightly from 50.3 in February to 50.2 in March, indicating no significant economic recovery as it hovers around the growth-contraction threshold. Despite this minor drop, production plans remain expansive, and positive contributions were noted in new orders and employment indices. Rising price pressures for commodities have been observed, with the price index reaching 55.3, although this is significantly lower than the previous year's levels.


