Download to read offline
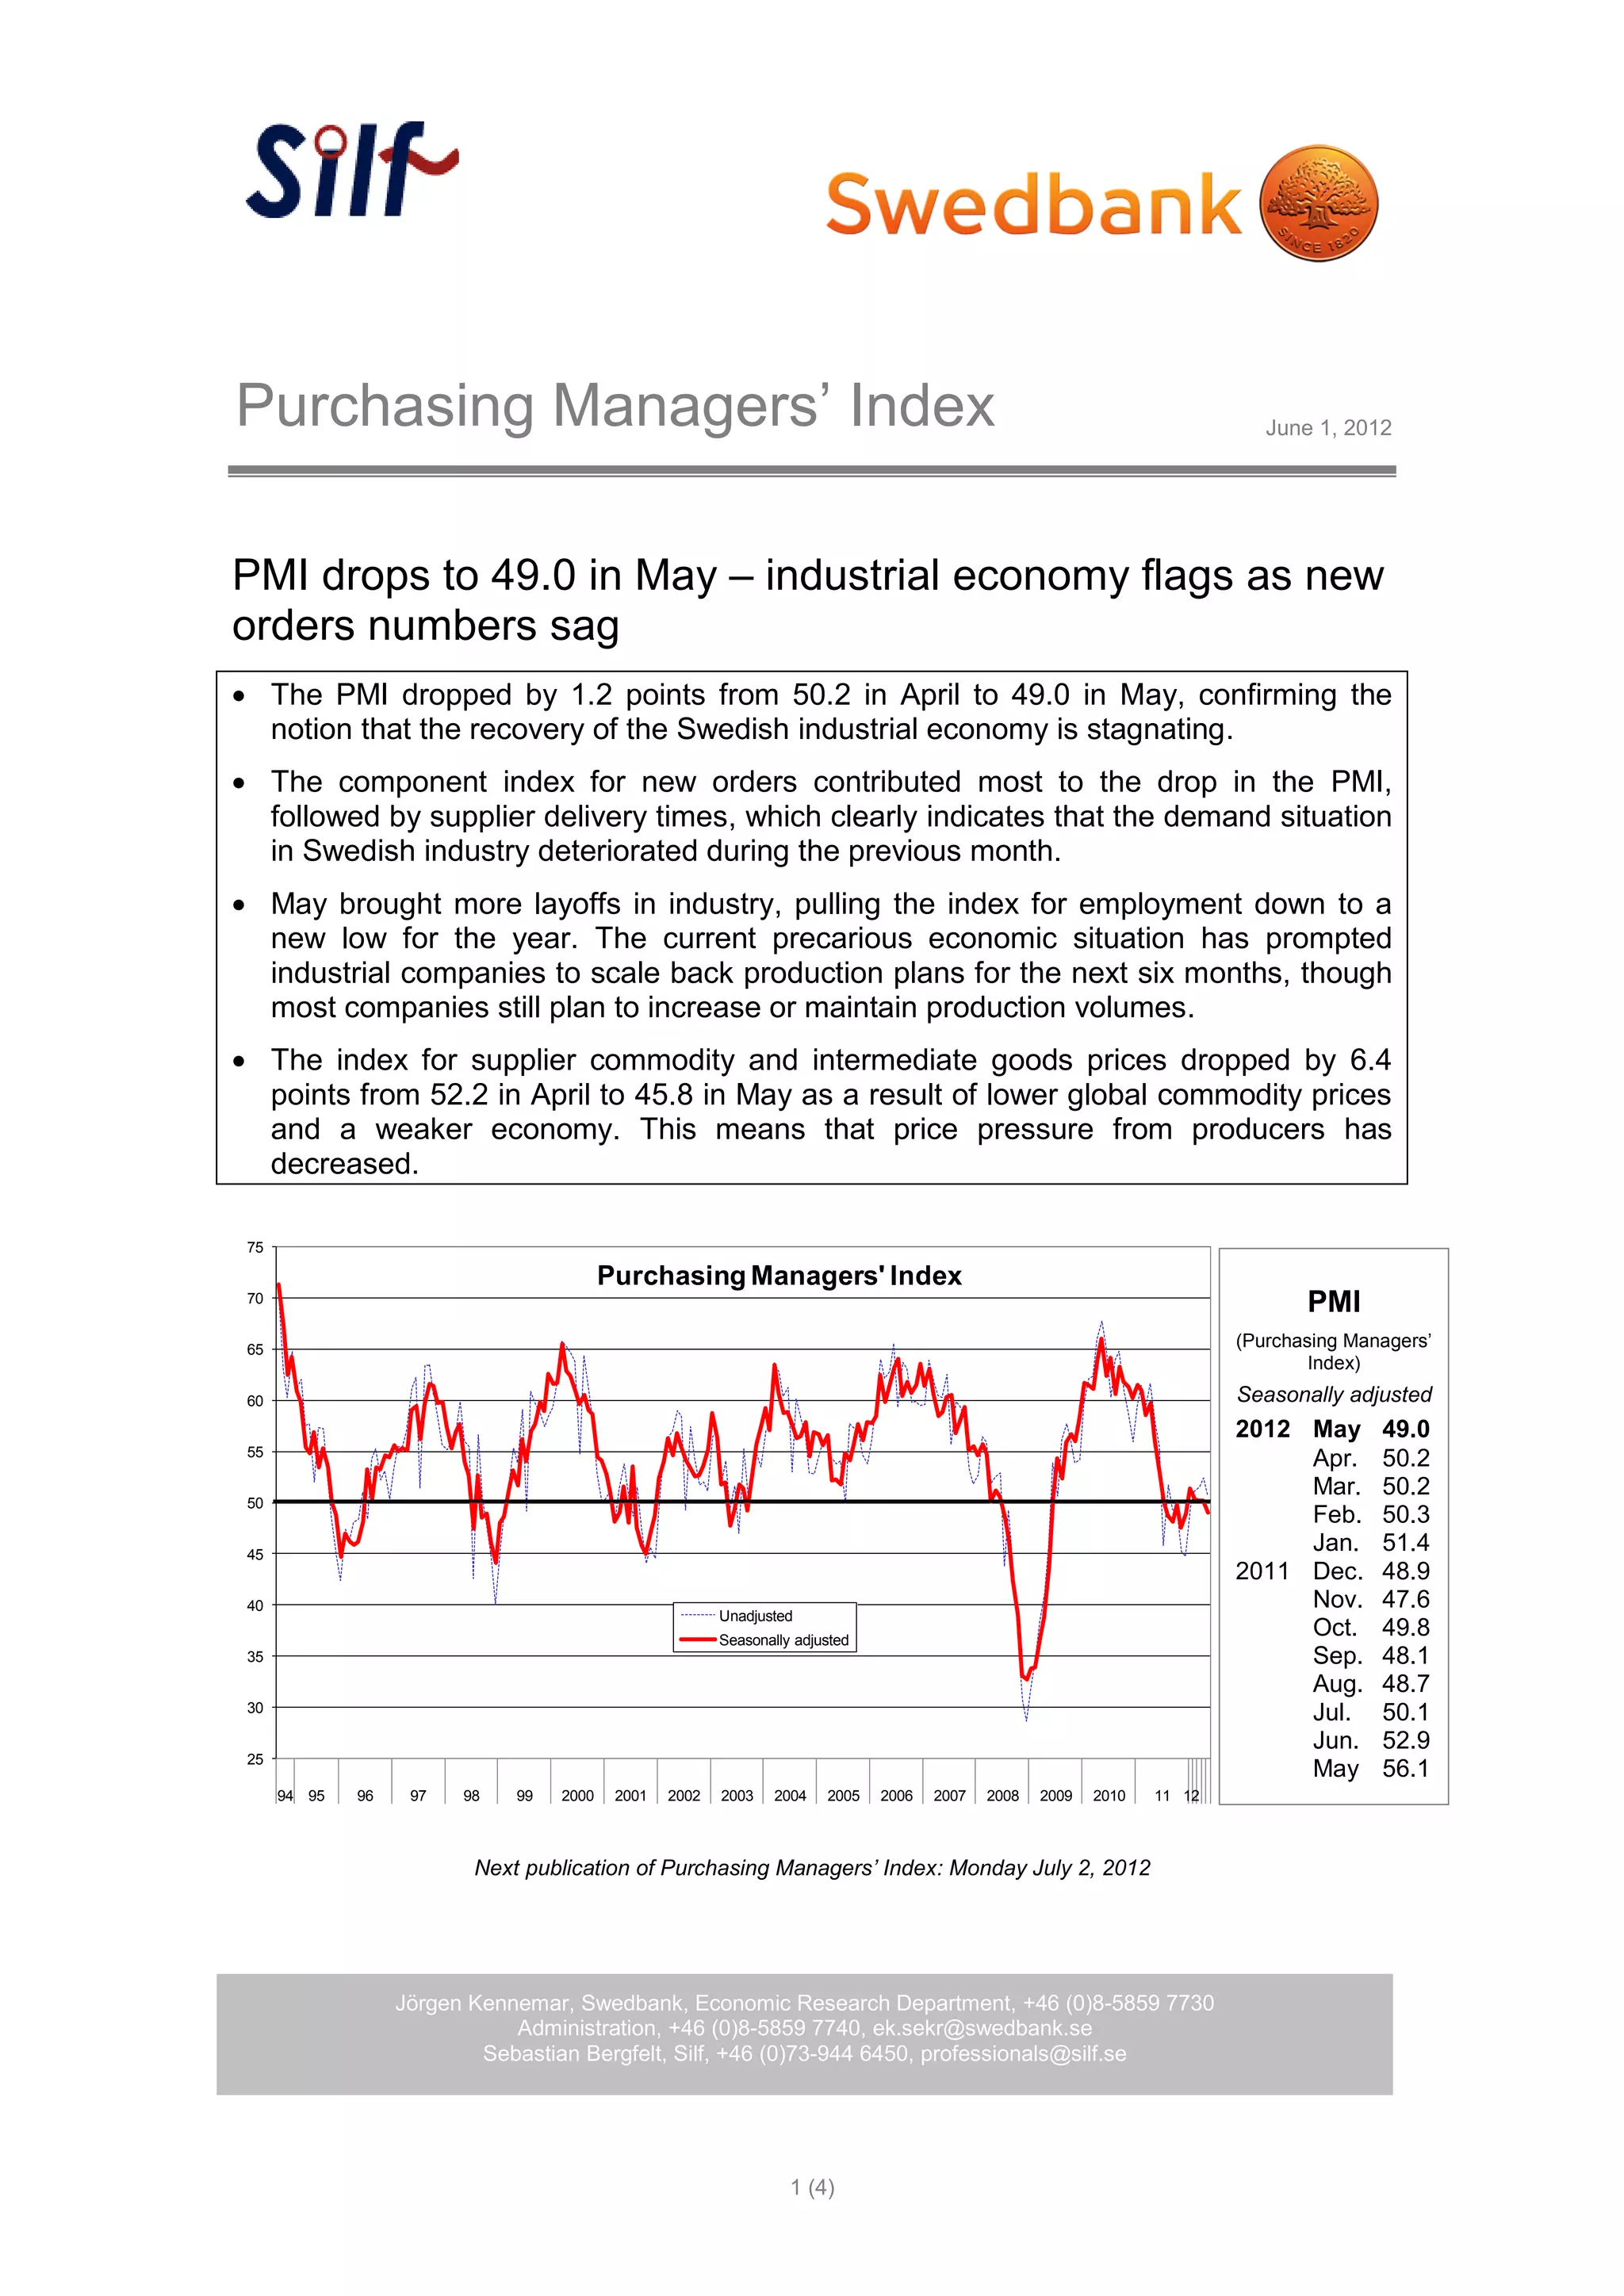

The Purchasing Managers' Index (PMI) for Swedish industry dropped from 50.2 in April to 49.0 in May, indicating that the recovery of the Swedish industrial economy is stagnating. The new orders component contributed most to the decline, followed by supplier delivery times, showing demand deteriorated. Layoffs increased in May as companies scaled back production plans due to the uncertain economic situation, though most still plan to maintain or increase production volumes. Input prices fell due to lower global commodity prices and weaker demand.


