Download to read offline
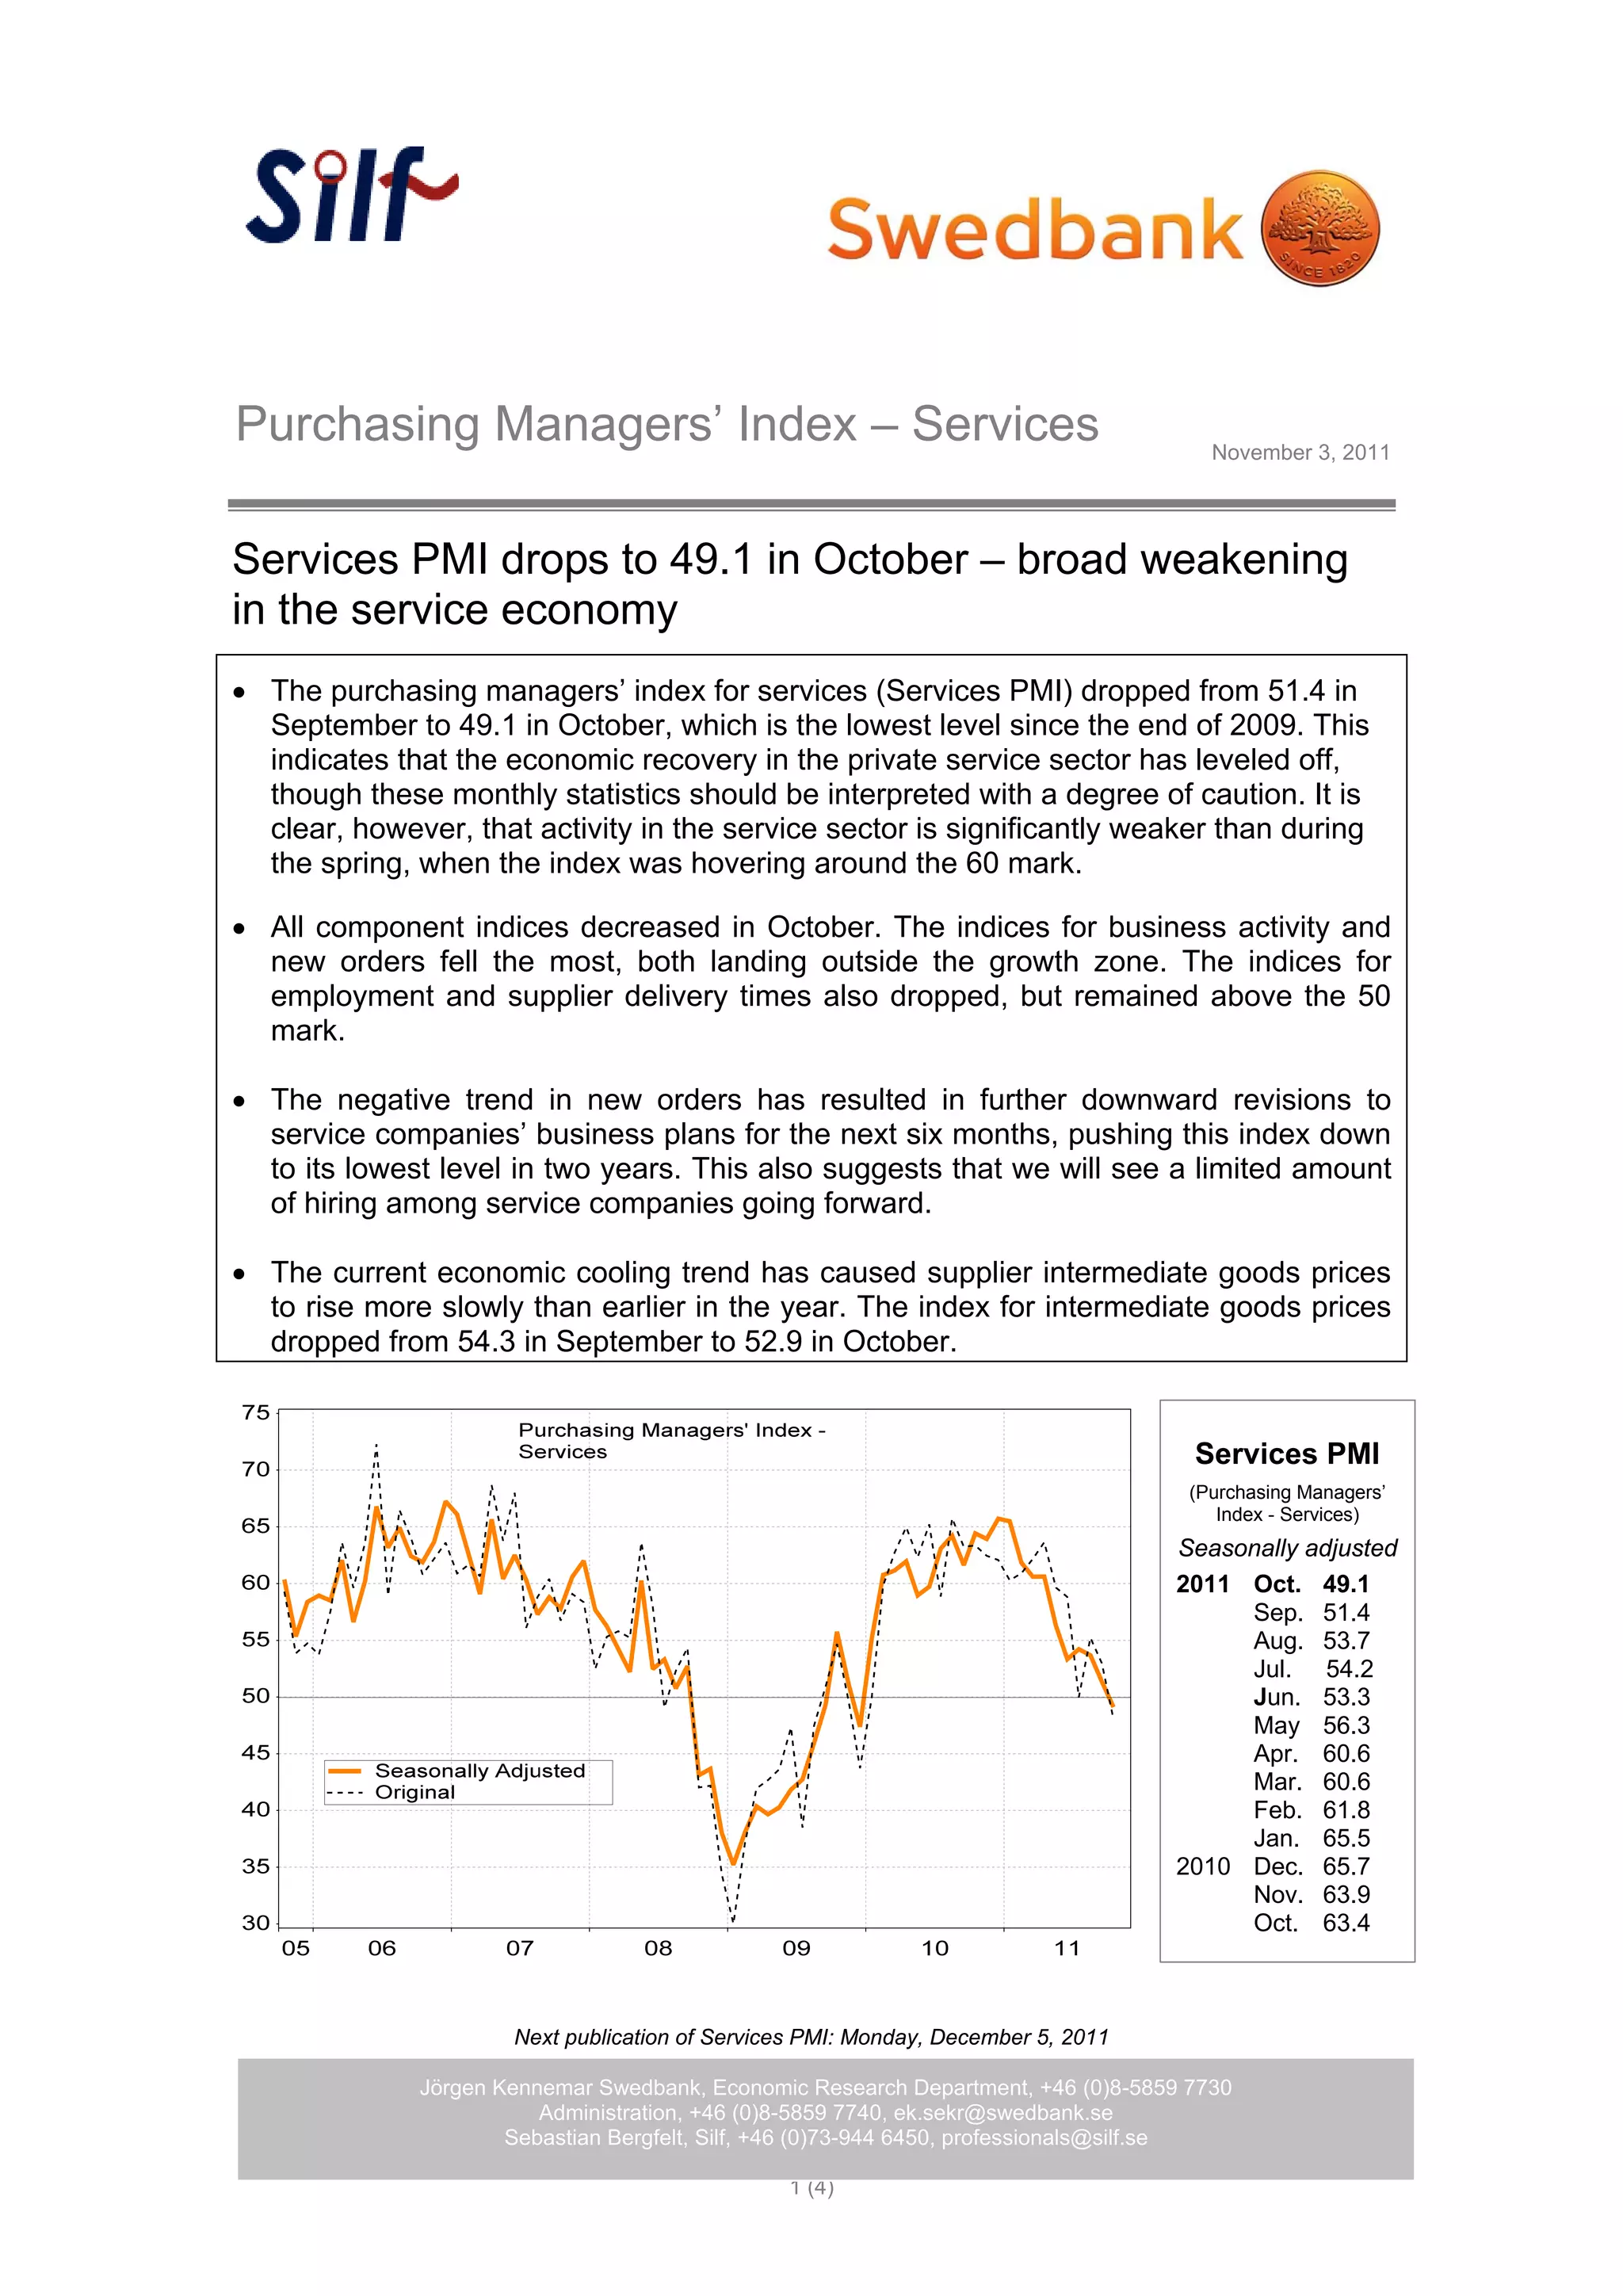

The Purchasing Managers' Index (PMI) for services dropped to 49.1 in October 2011, indicating a significant slowdown in the service sector's economic recovery, with all component indices declining. This downturn in new orders and business activity has led to revised business plans and limited hiring among service companies, reaching the lowest index in two years. Additionally, the rate of price increases for supplier intermediate goods has slowed compared to earlier in the year.


