Download to read offline
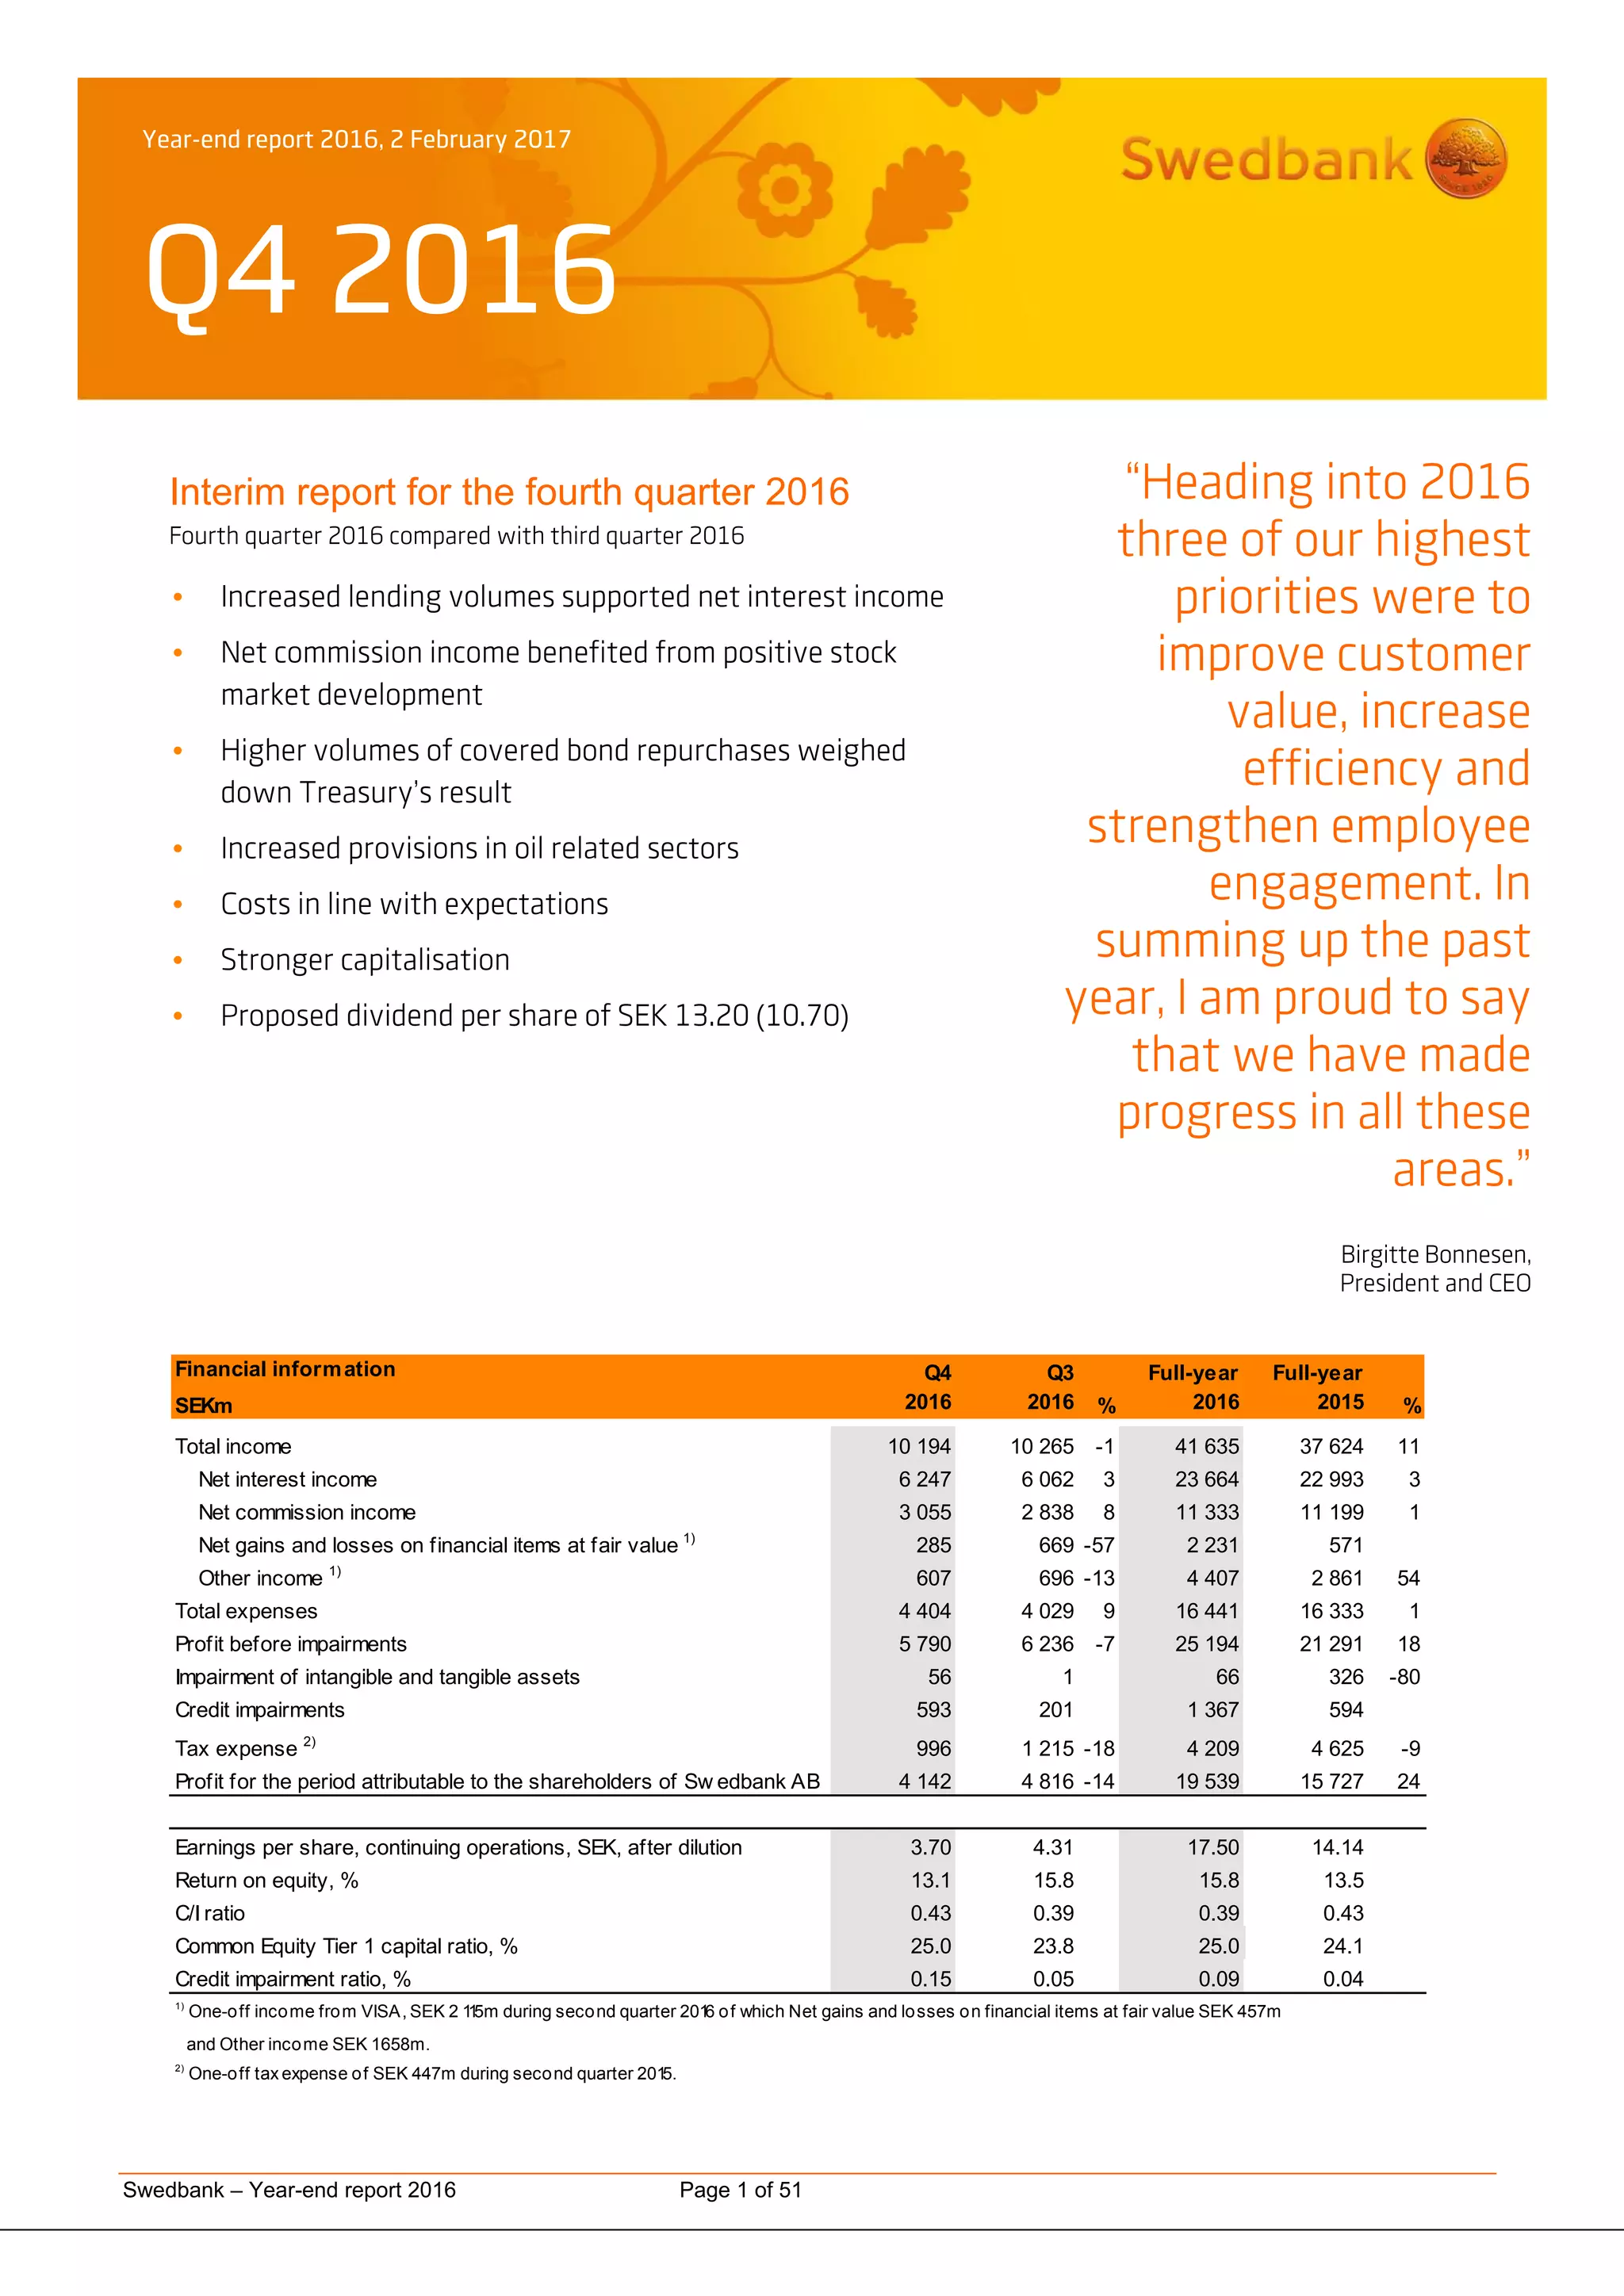


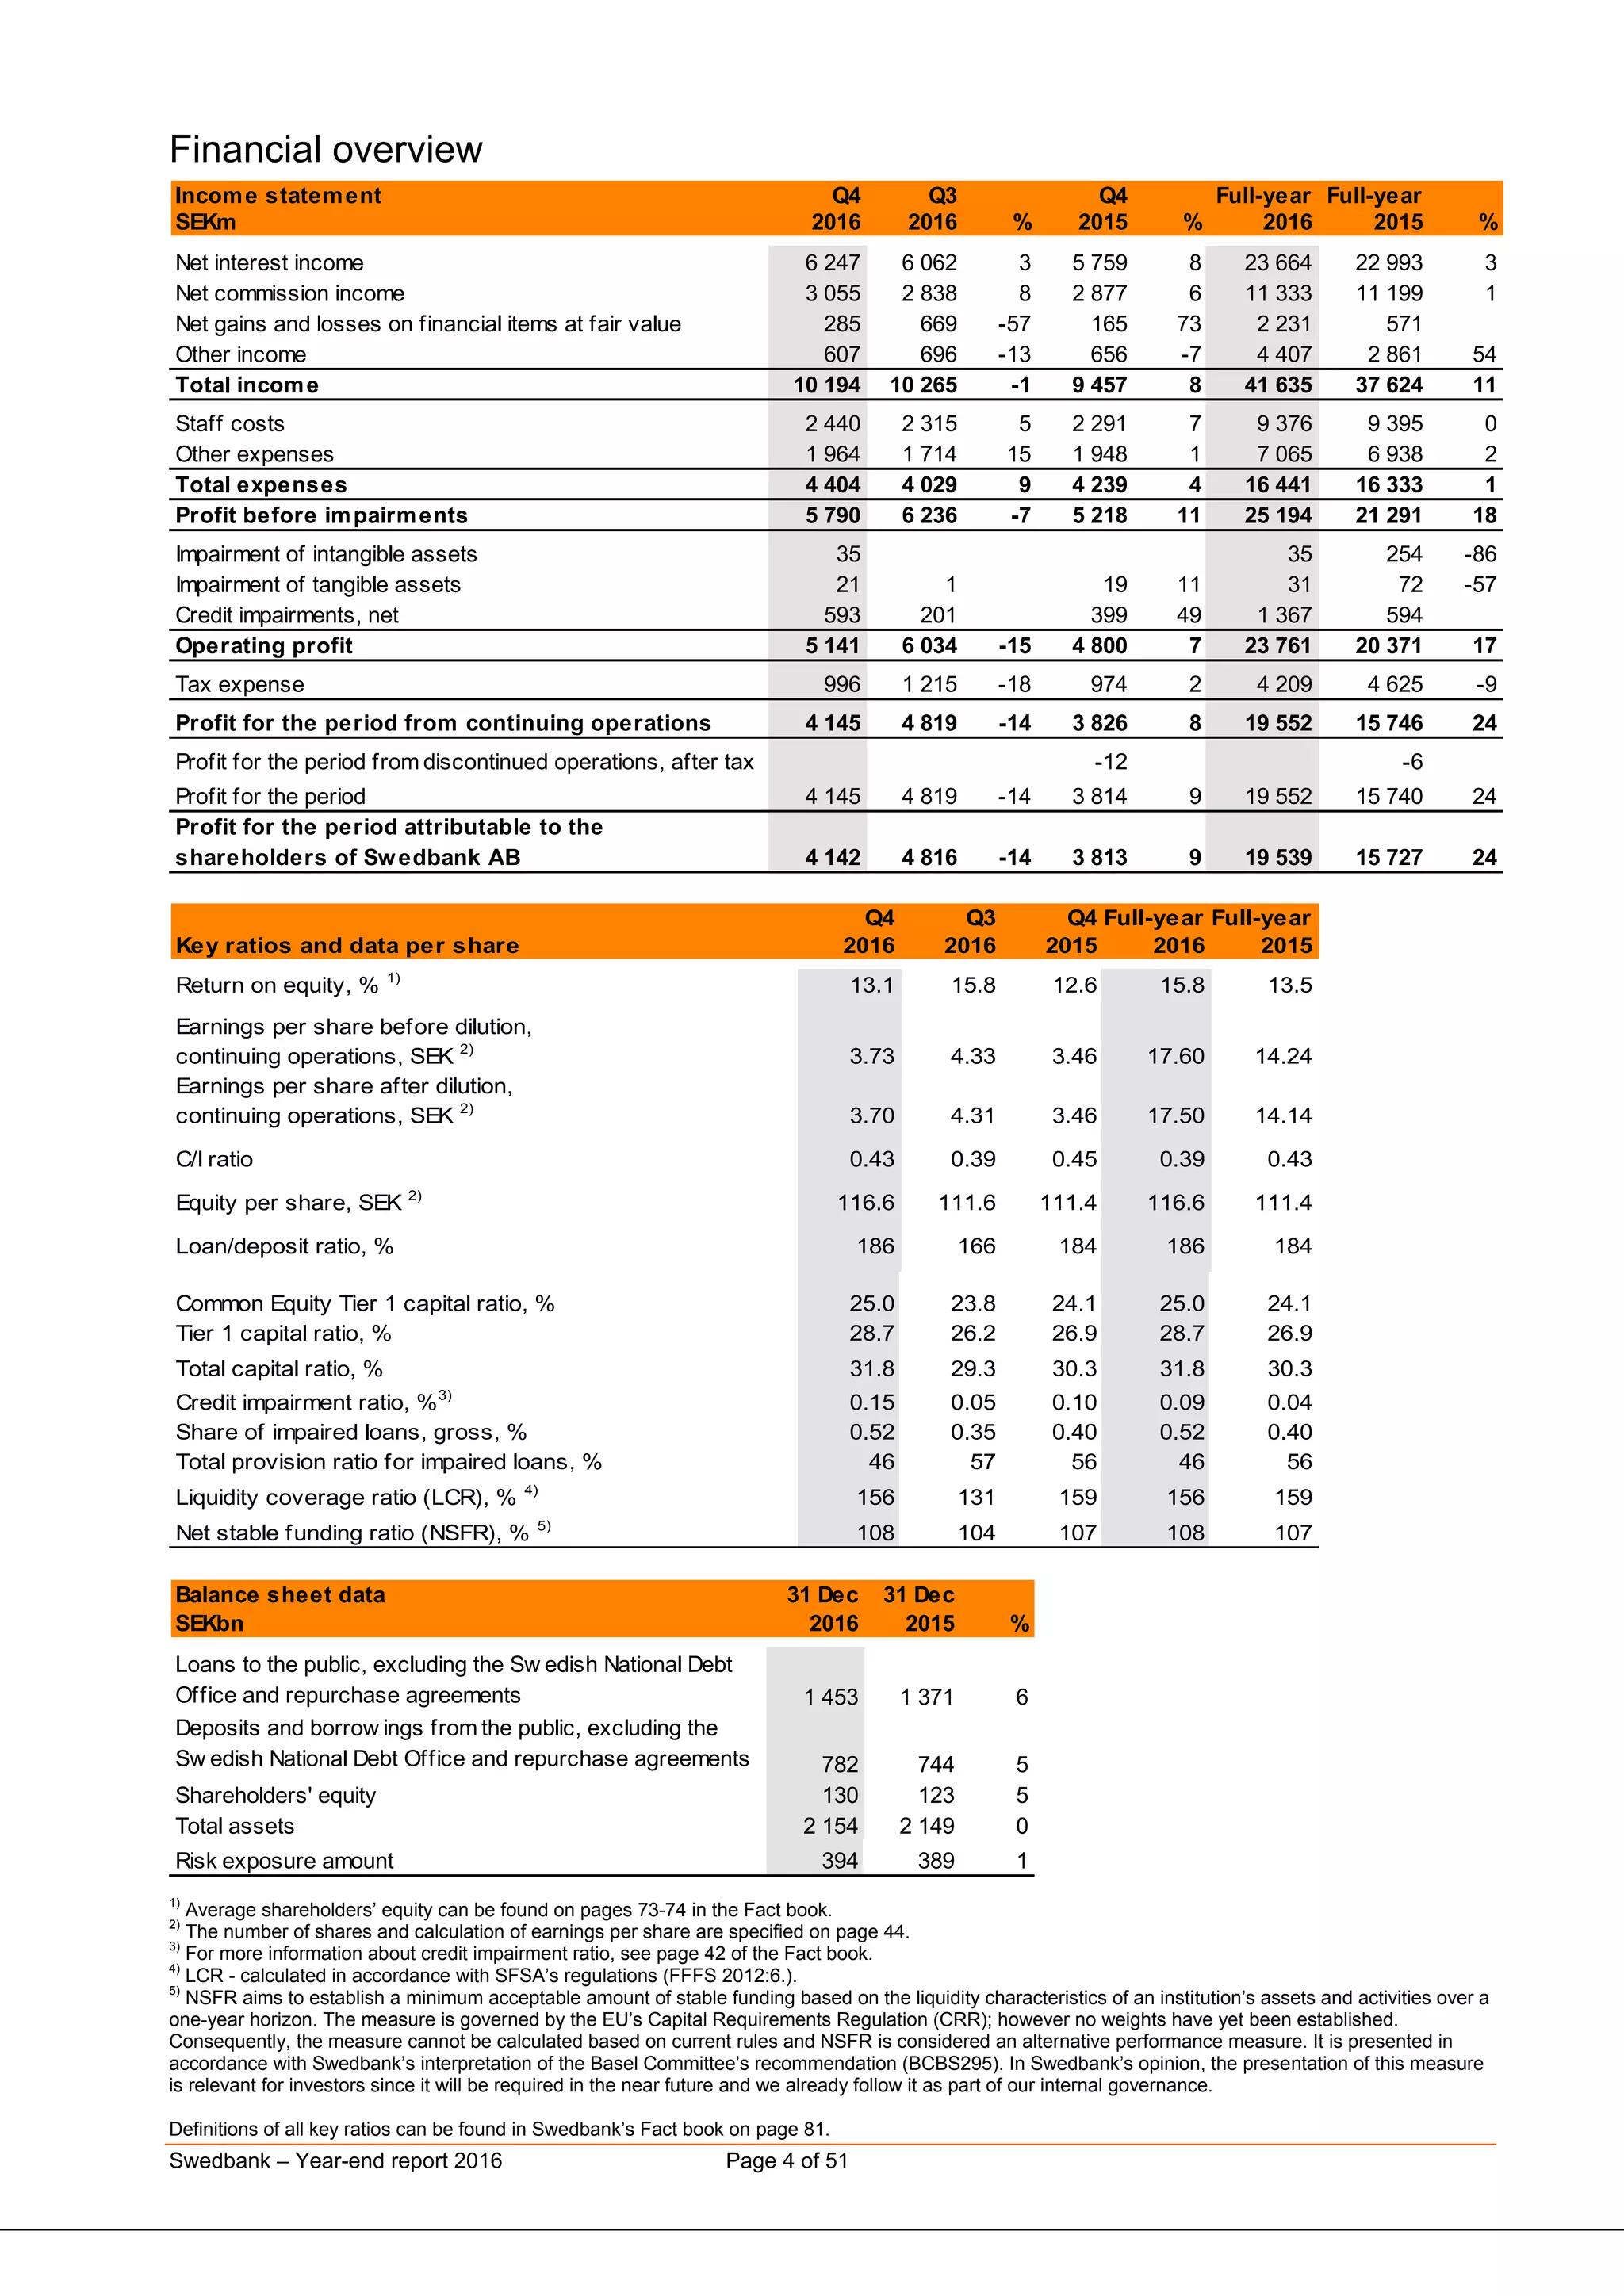


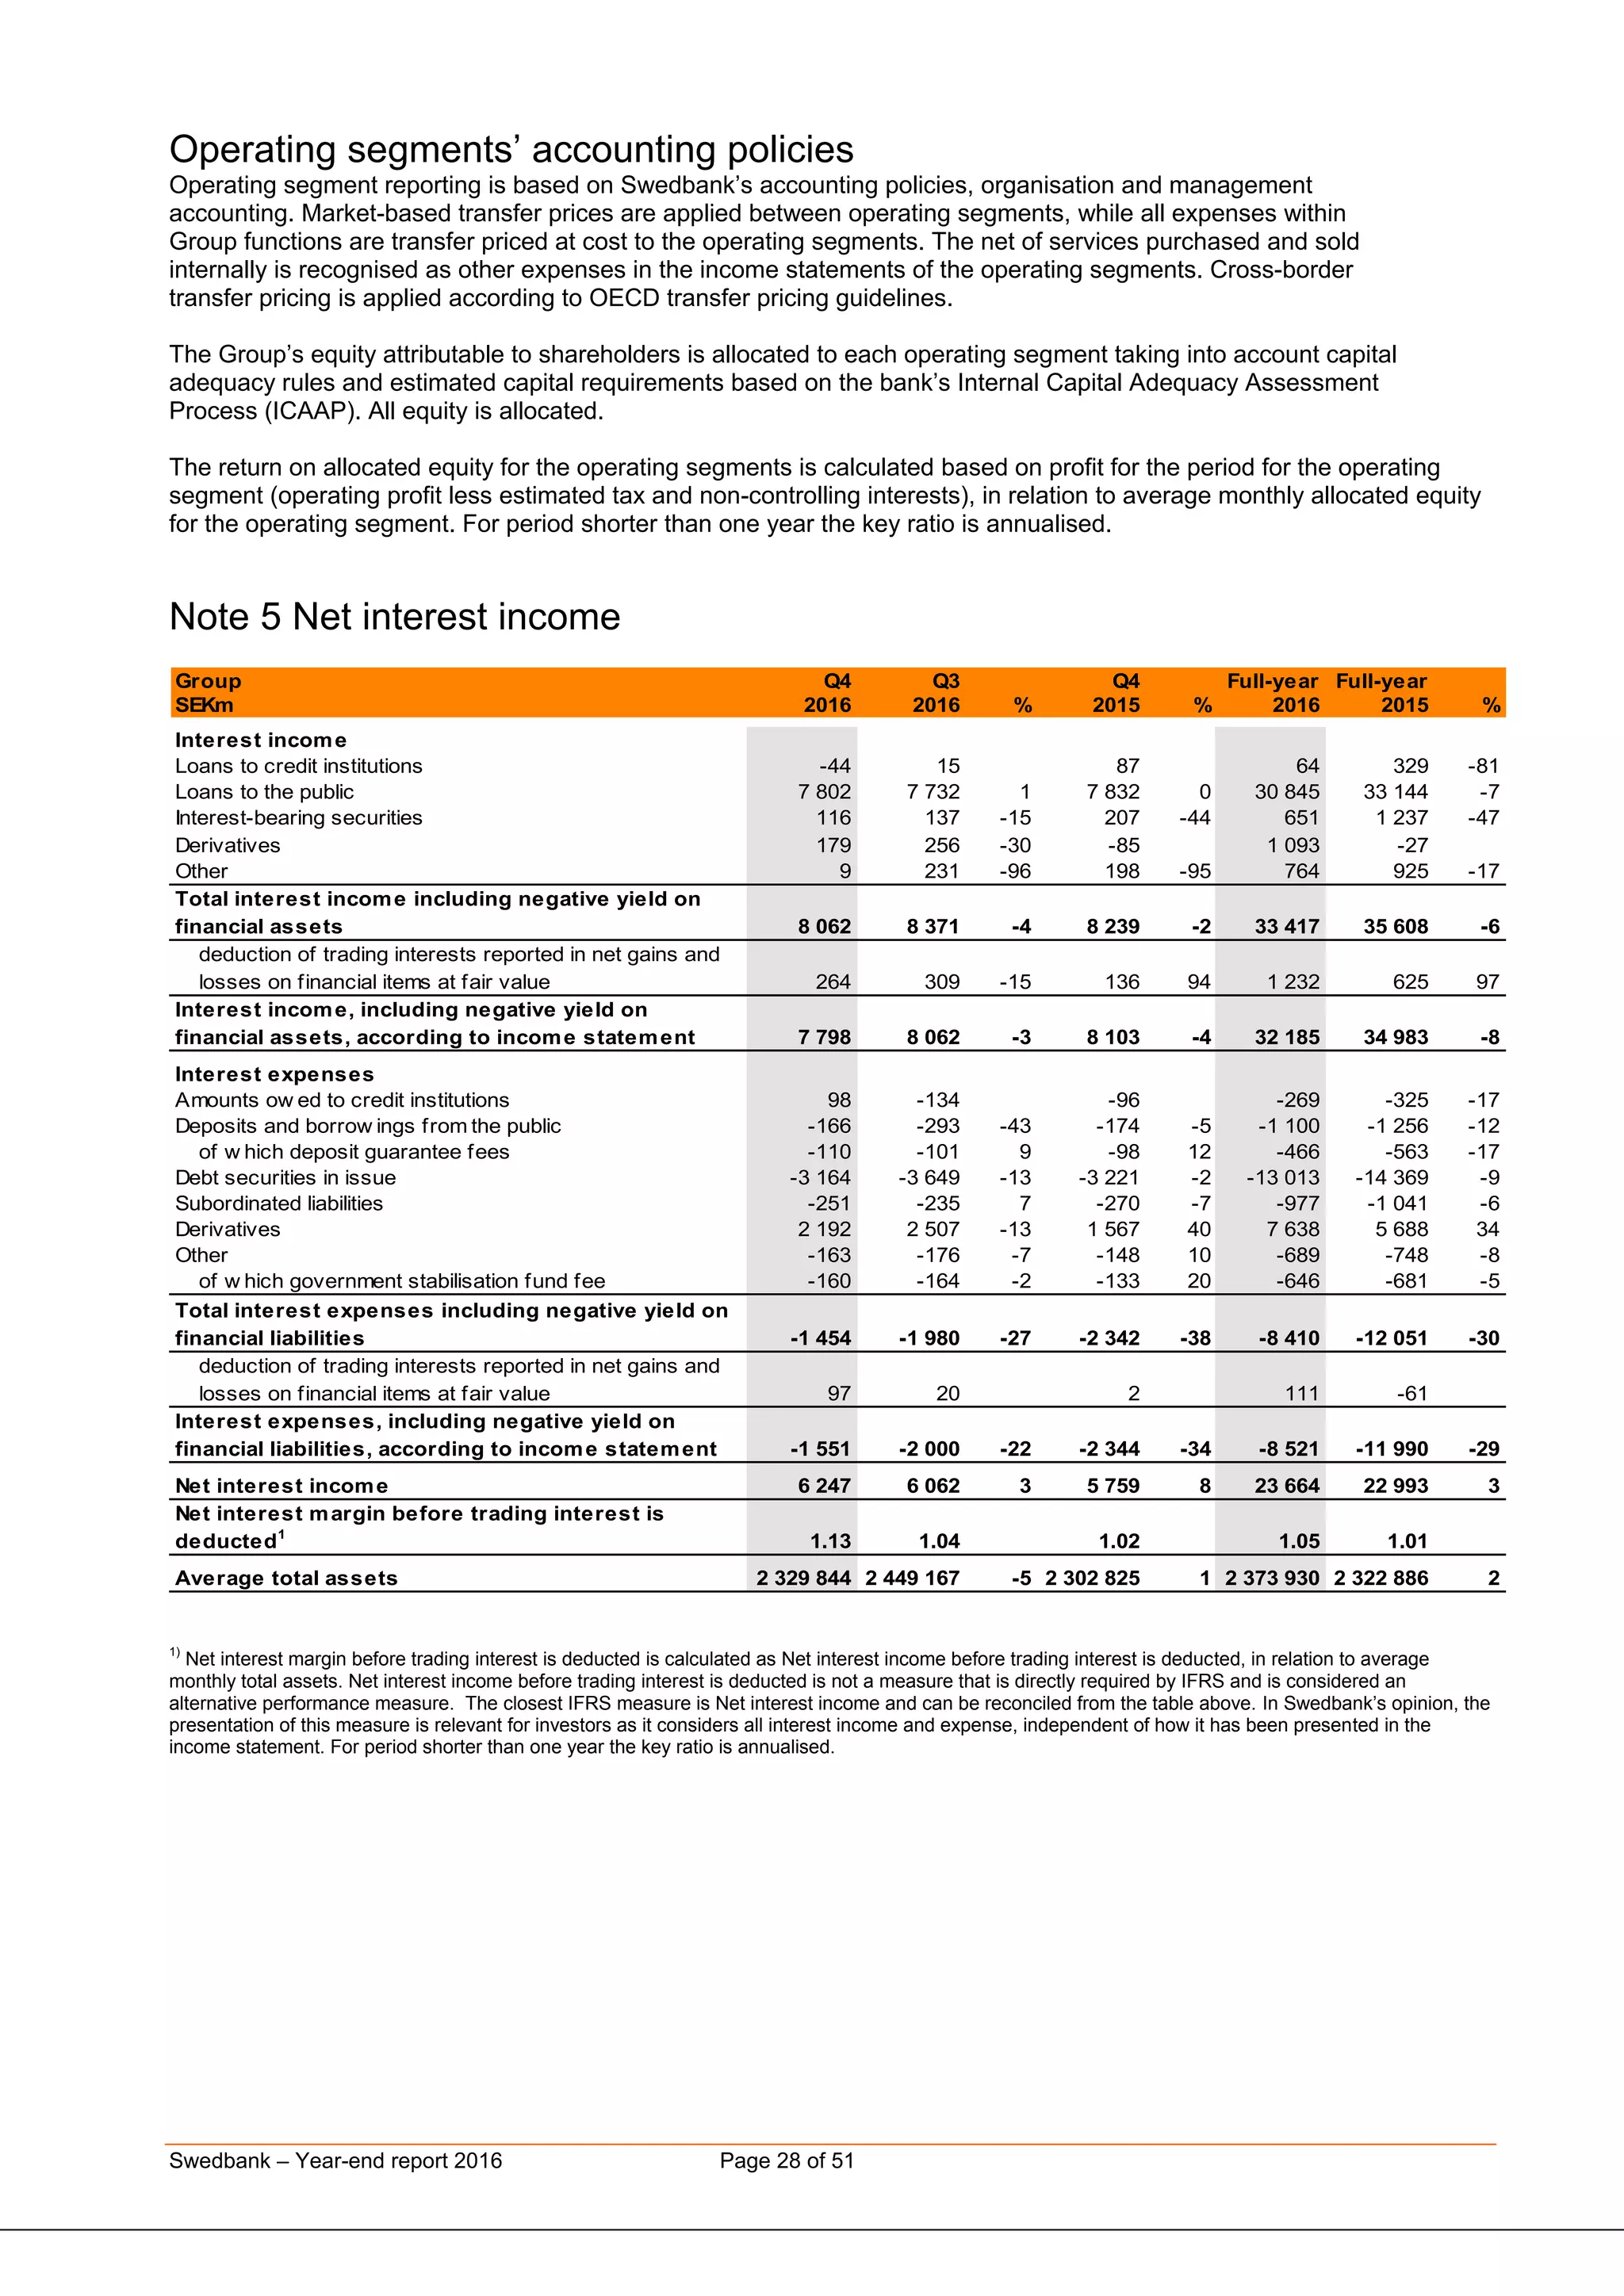
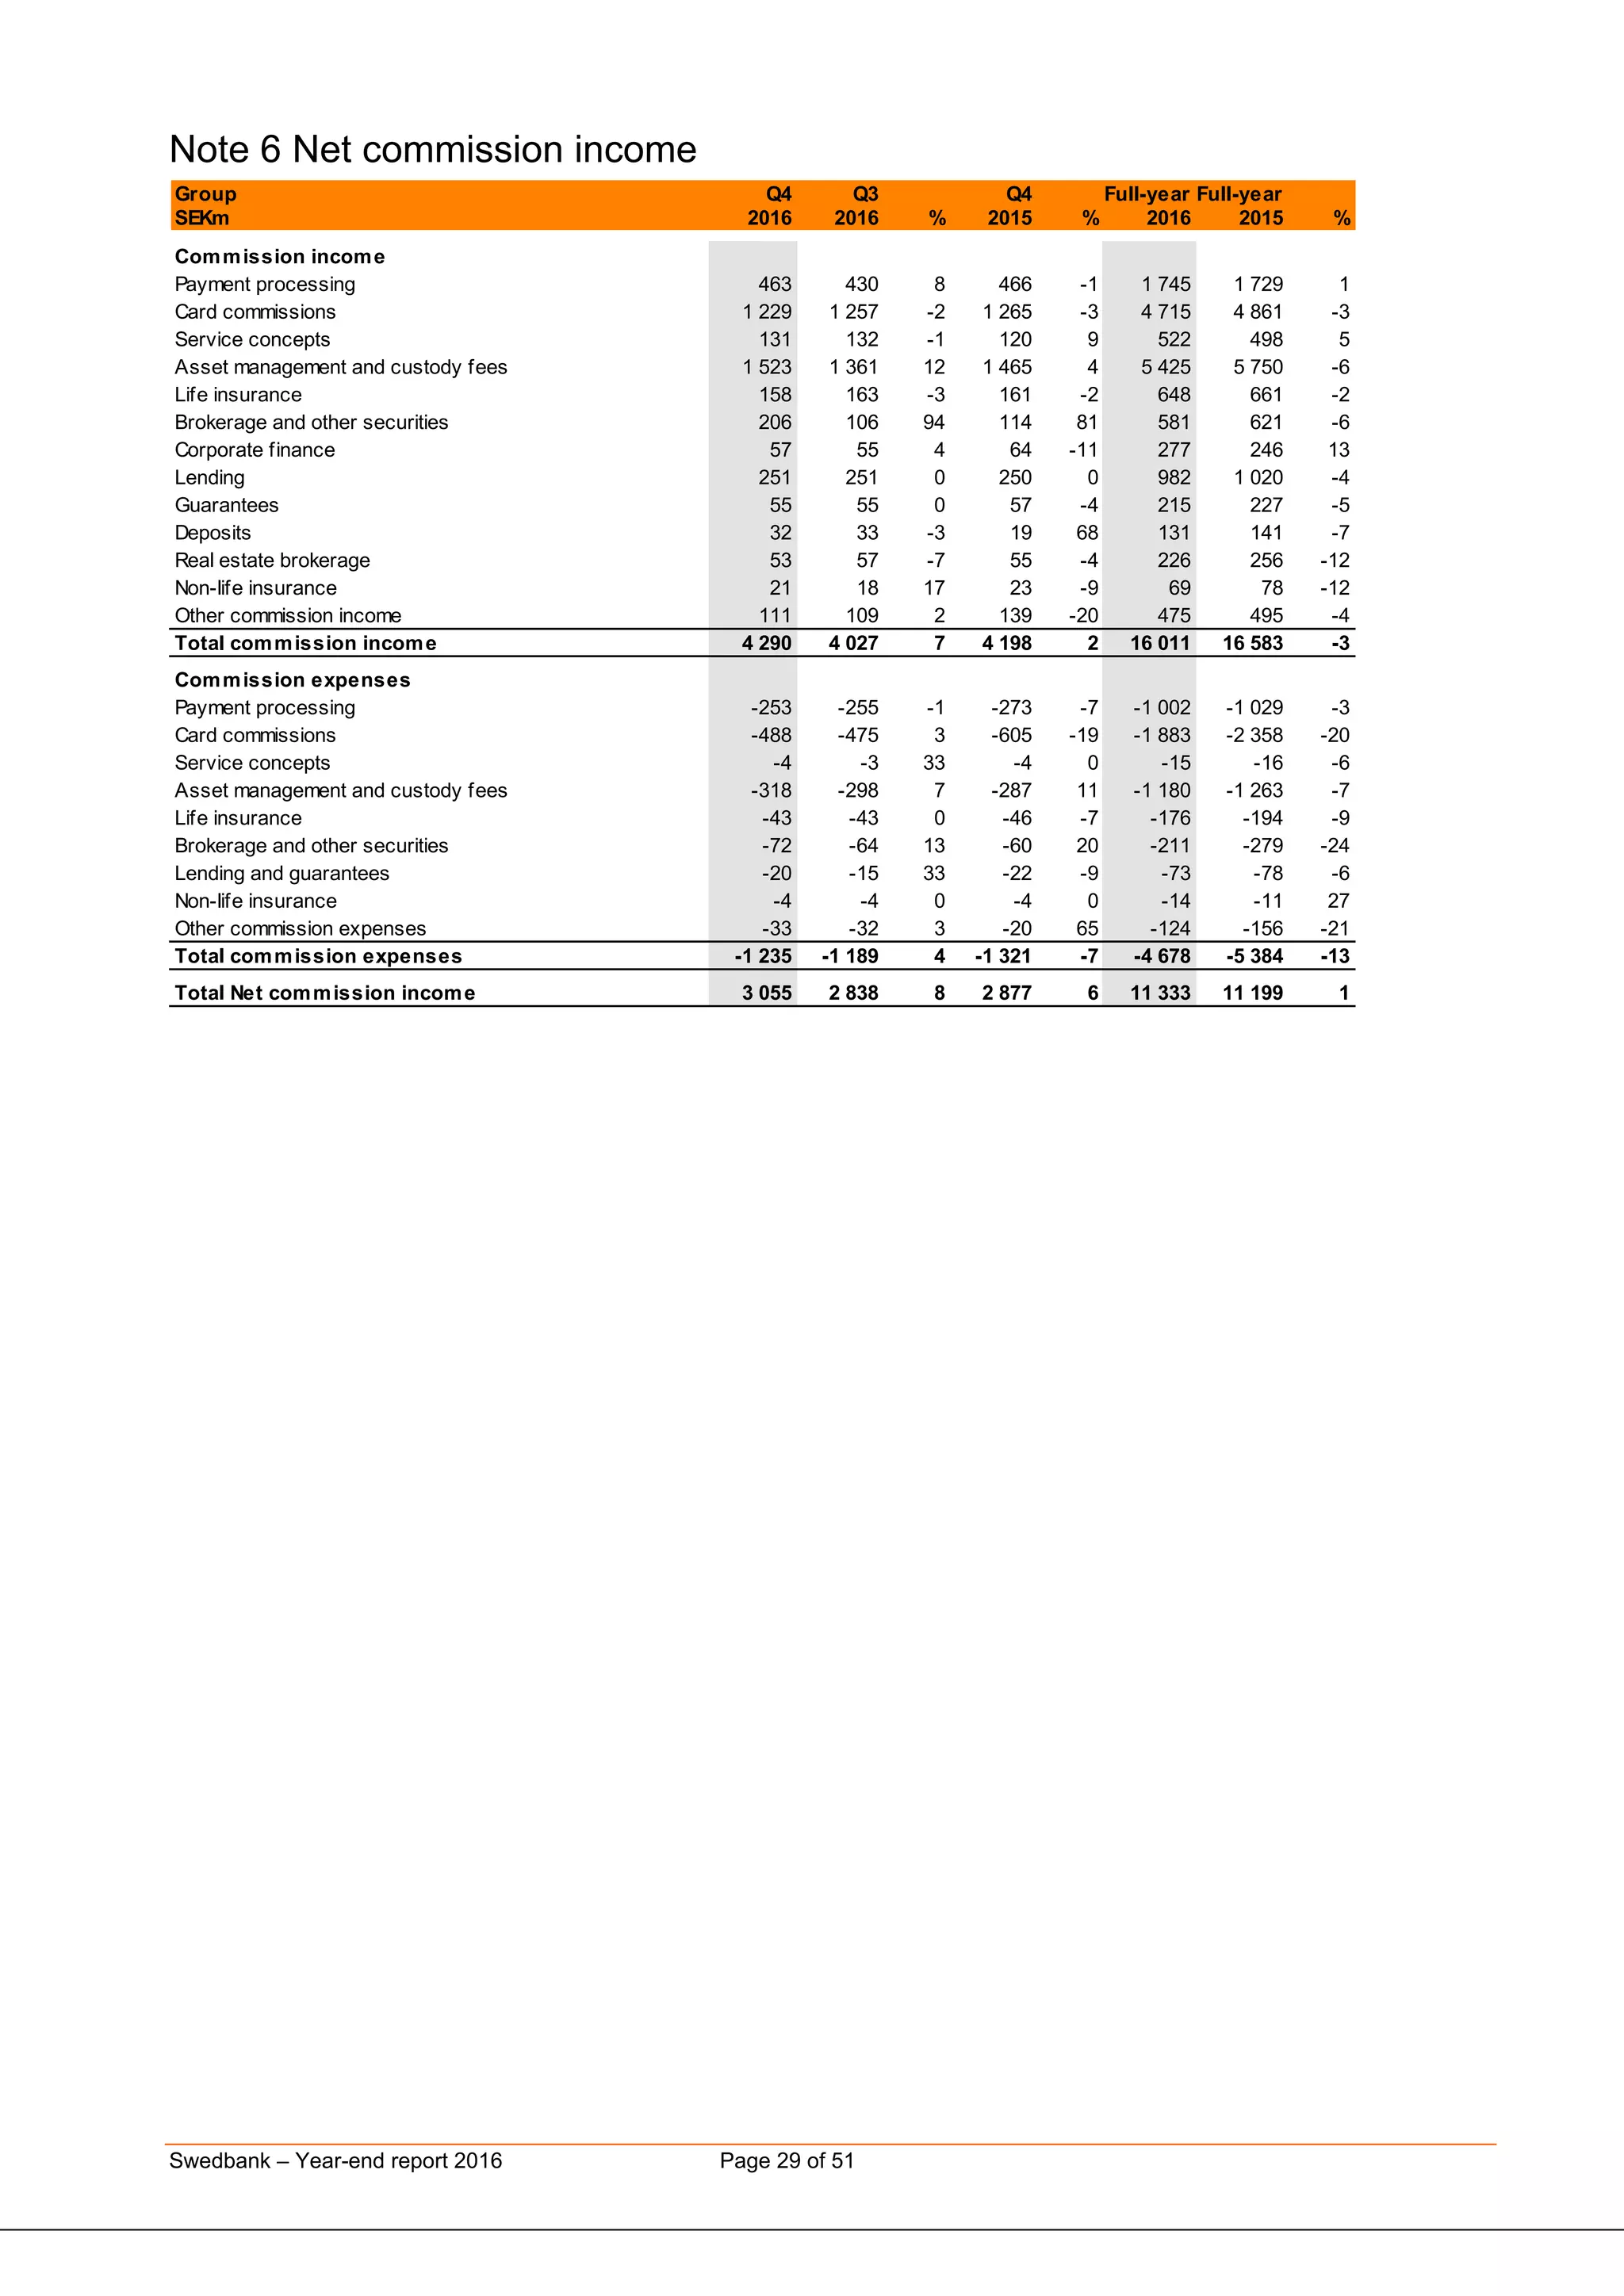


Swedbank reported its year-end results for 2016. In Q4 2016, net interest income increased 3% compared to Q3 2016 supported by increased lending volumes. Net commission income benefited from positive stock market development. Higher volumes of covered bond repurchases weighed down Treasury's result. Costs were in line with expectations and credit quality remained solid despite increased provisions in oil related sectors. For the full year 2016, total income increased 11% while total expenses increased only 1%, leading to an 18% rise in operating profit. Return on equity was 15.8% and the proposed dividend per share was SEK 13.20, up from SEK 10.70 the previous year.


