Download to read offline
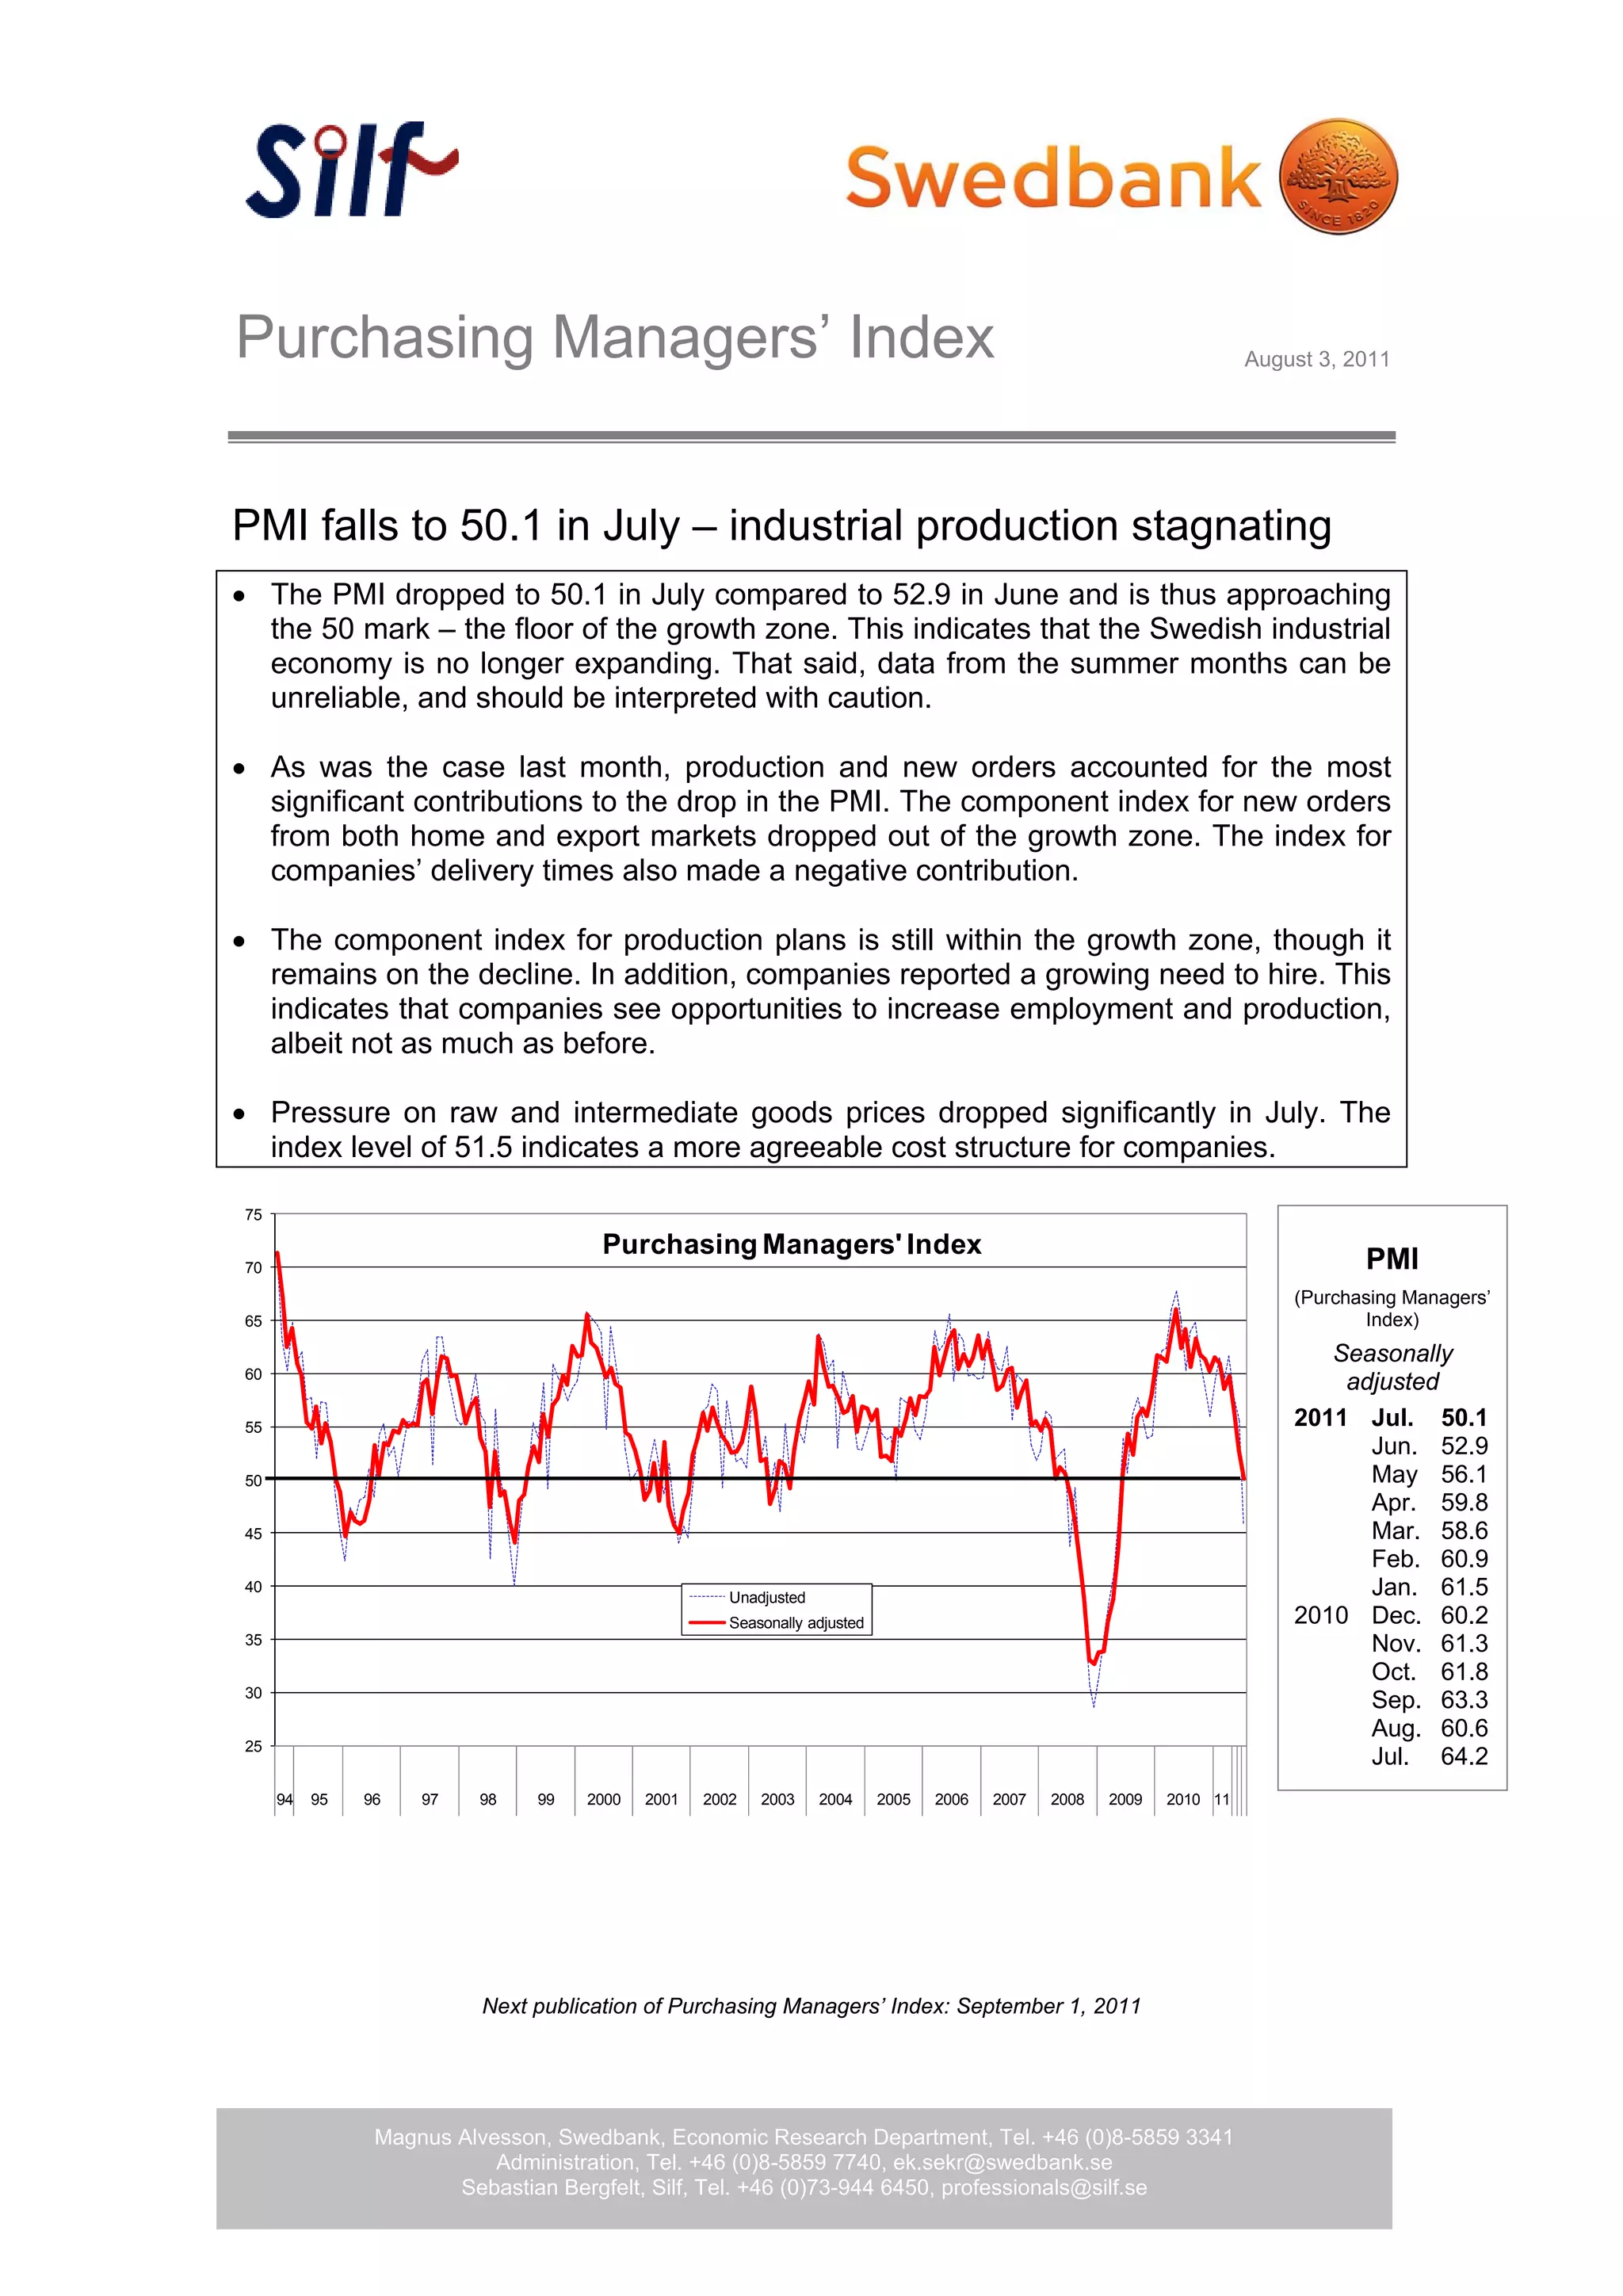

The Purchasing Managers' Index (PMI) fell to 50.1 in July from 52.9 in June, indicating stagnation in the Swedish industrial economy. The decline was attributed primarily to decreased production and new orders, with home and export markets showing negative trends. Despite these challenges, companies still reported a need to hire, suggesting potential for future growth, while cost pressures on raw materials eased.


