Download to read offline
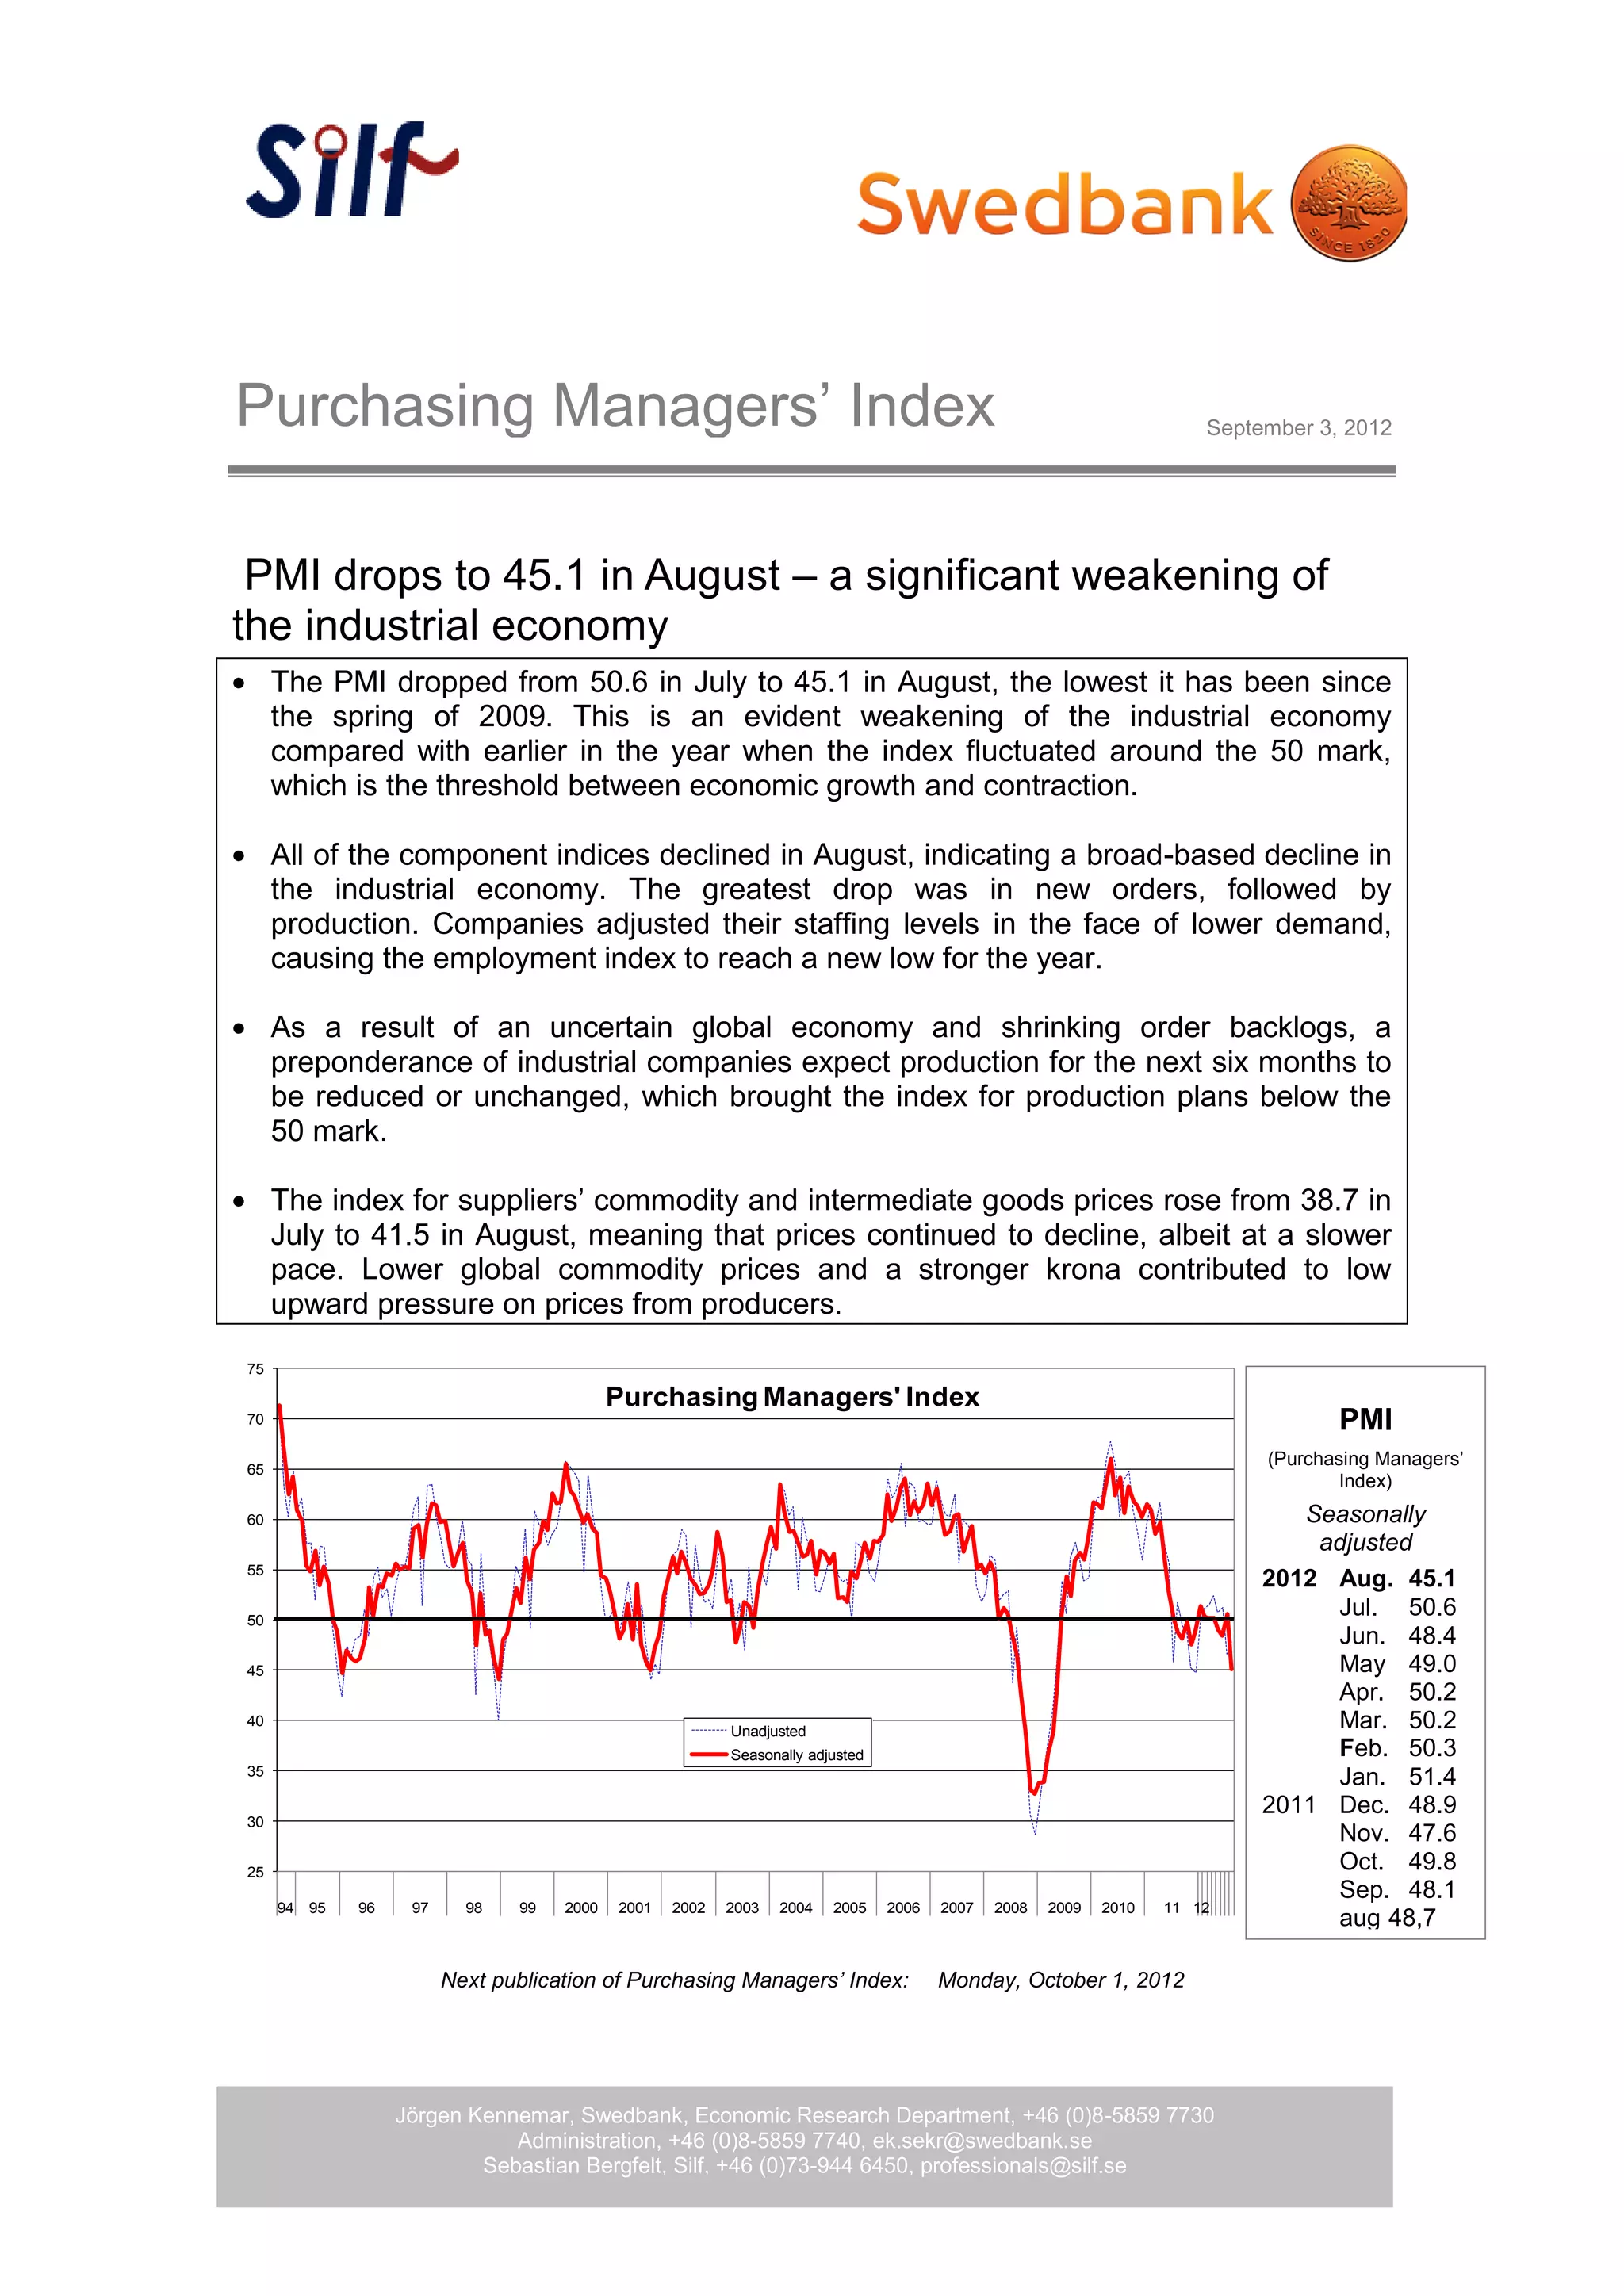

The Purchasing Managers' Index (PMI) fell to 45.1 in August 2012, indicating a significant decline in the industrial economy and marking the lowest level since spring 2009. All component indices showed decreases, especially new orders and production, prompting companies to reduce staffing due to lower demand. The uncertain global economy has led many industrial firms to anticipate production cuts or stagnation in the coming months.


