Download to read offline
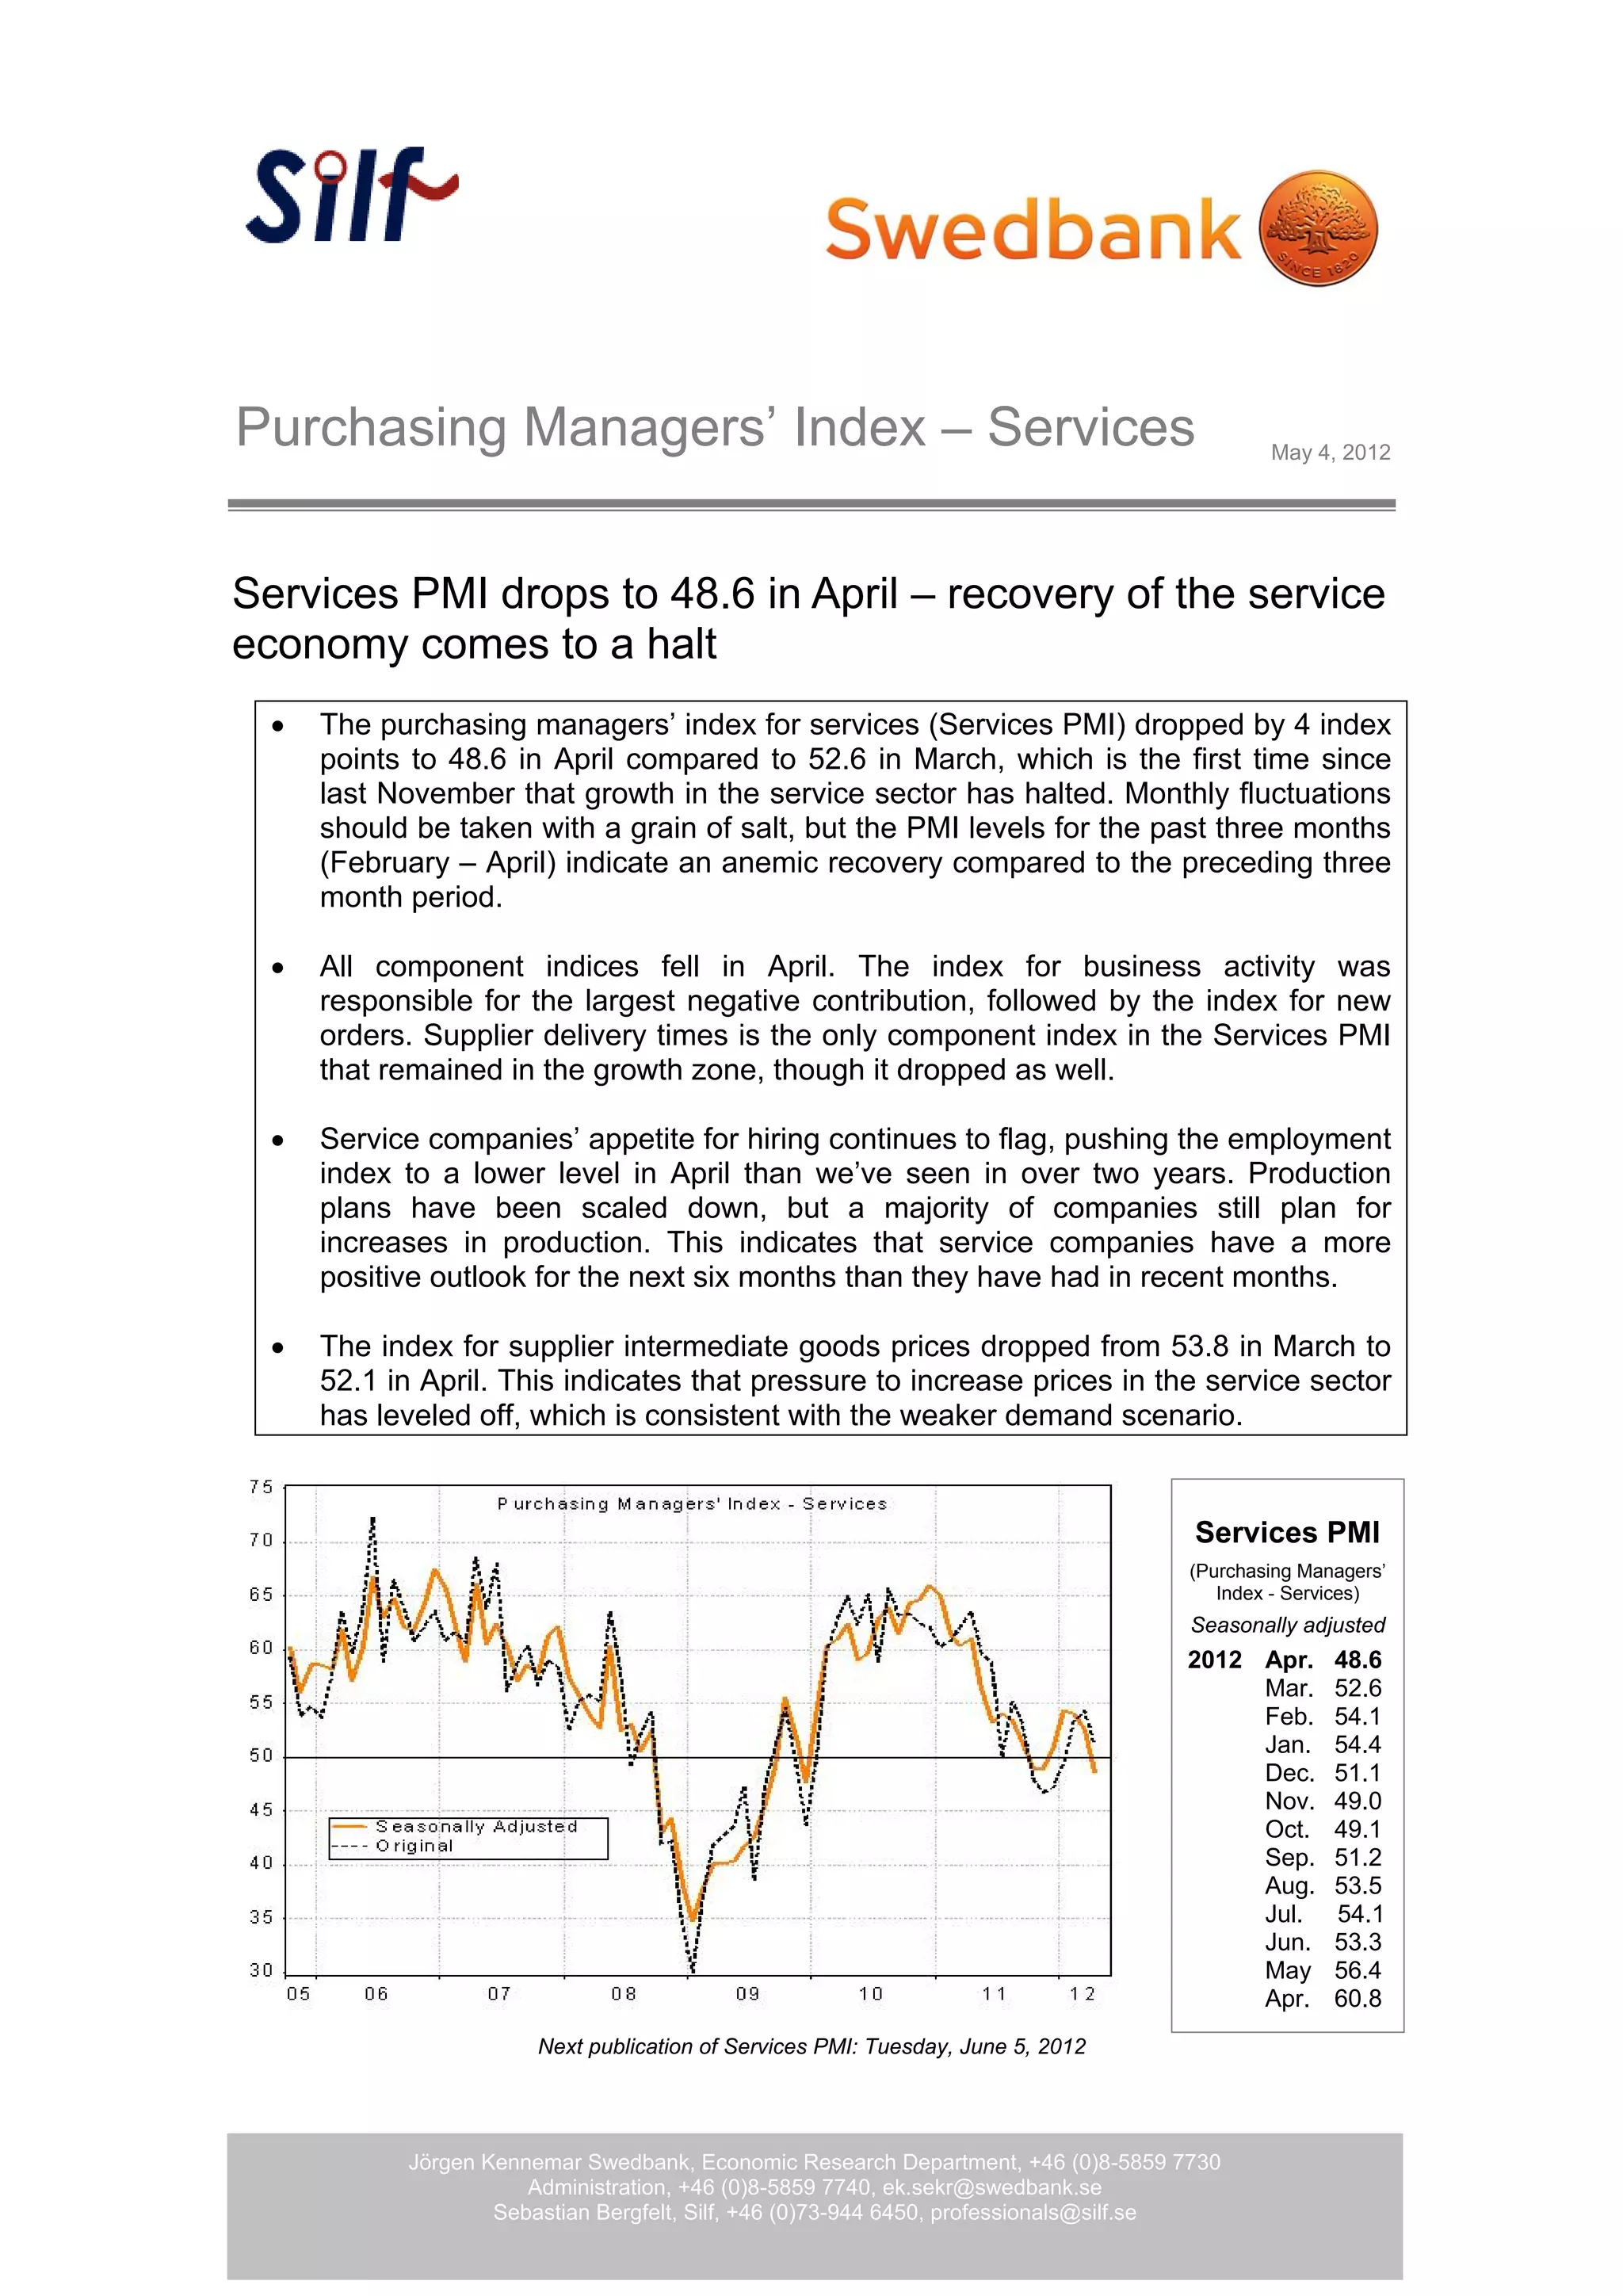

The Purchasing Managers’ Index (PMI) for services dropped to 48.6 in April, indicating a halt in the recovery of the service economy for the first time since last November. All component indices declined, with business activity showing the largest negative impact, while hiring sentiment weakened and production plans were scaled down. Despite these downturns, companies maintain a more positive outlook for the coming six months and price pressure has stabilized.


