Download to read offline
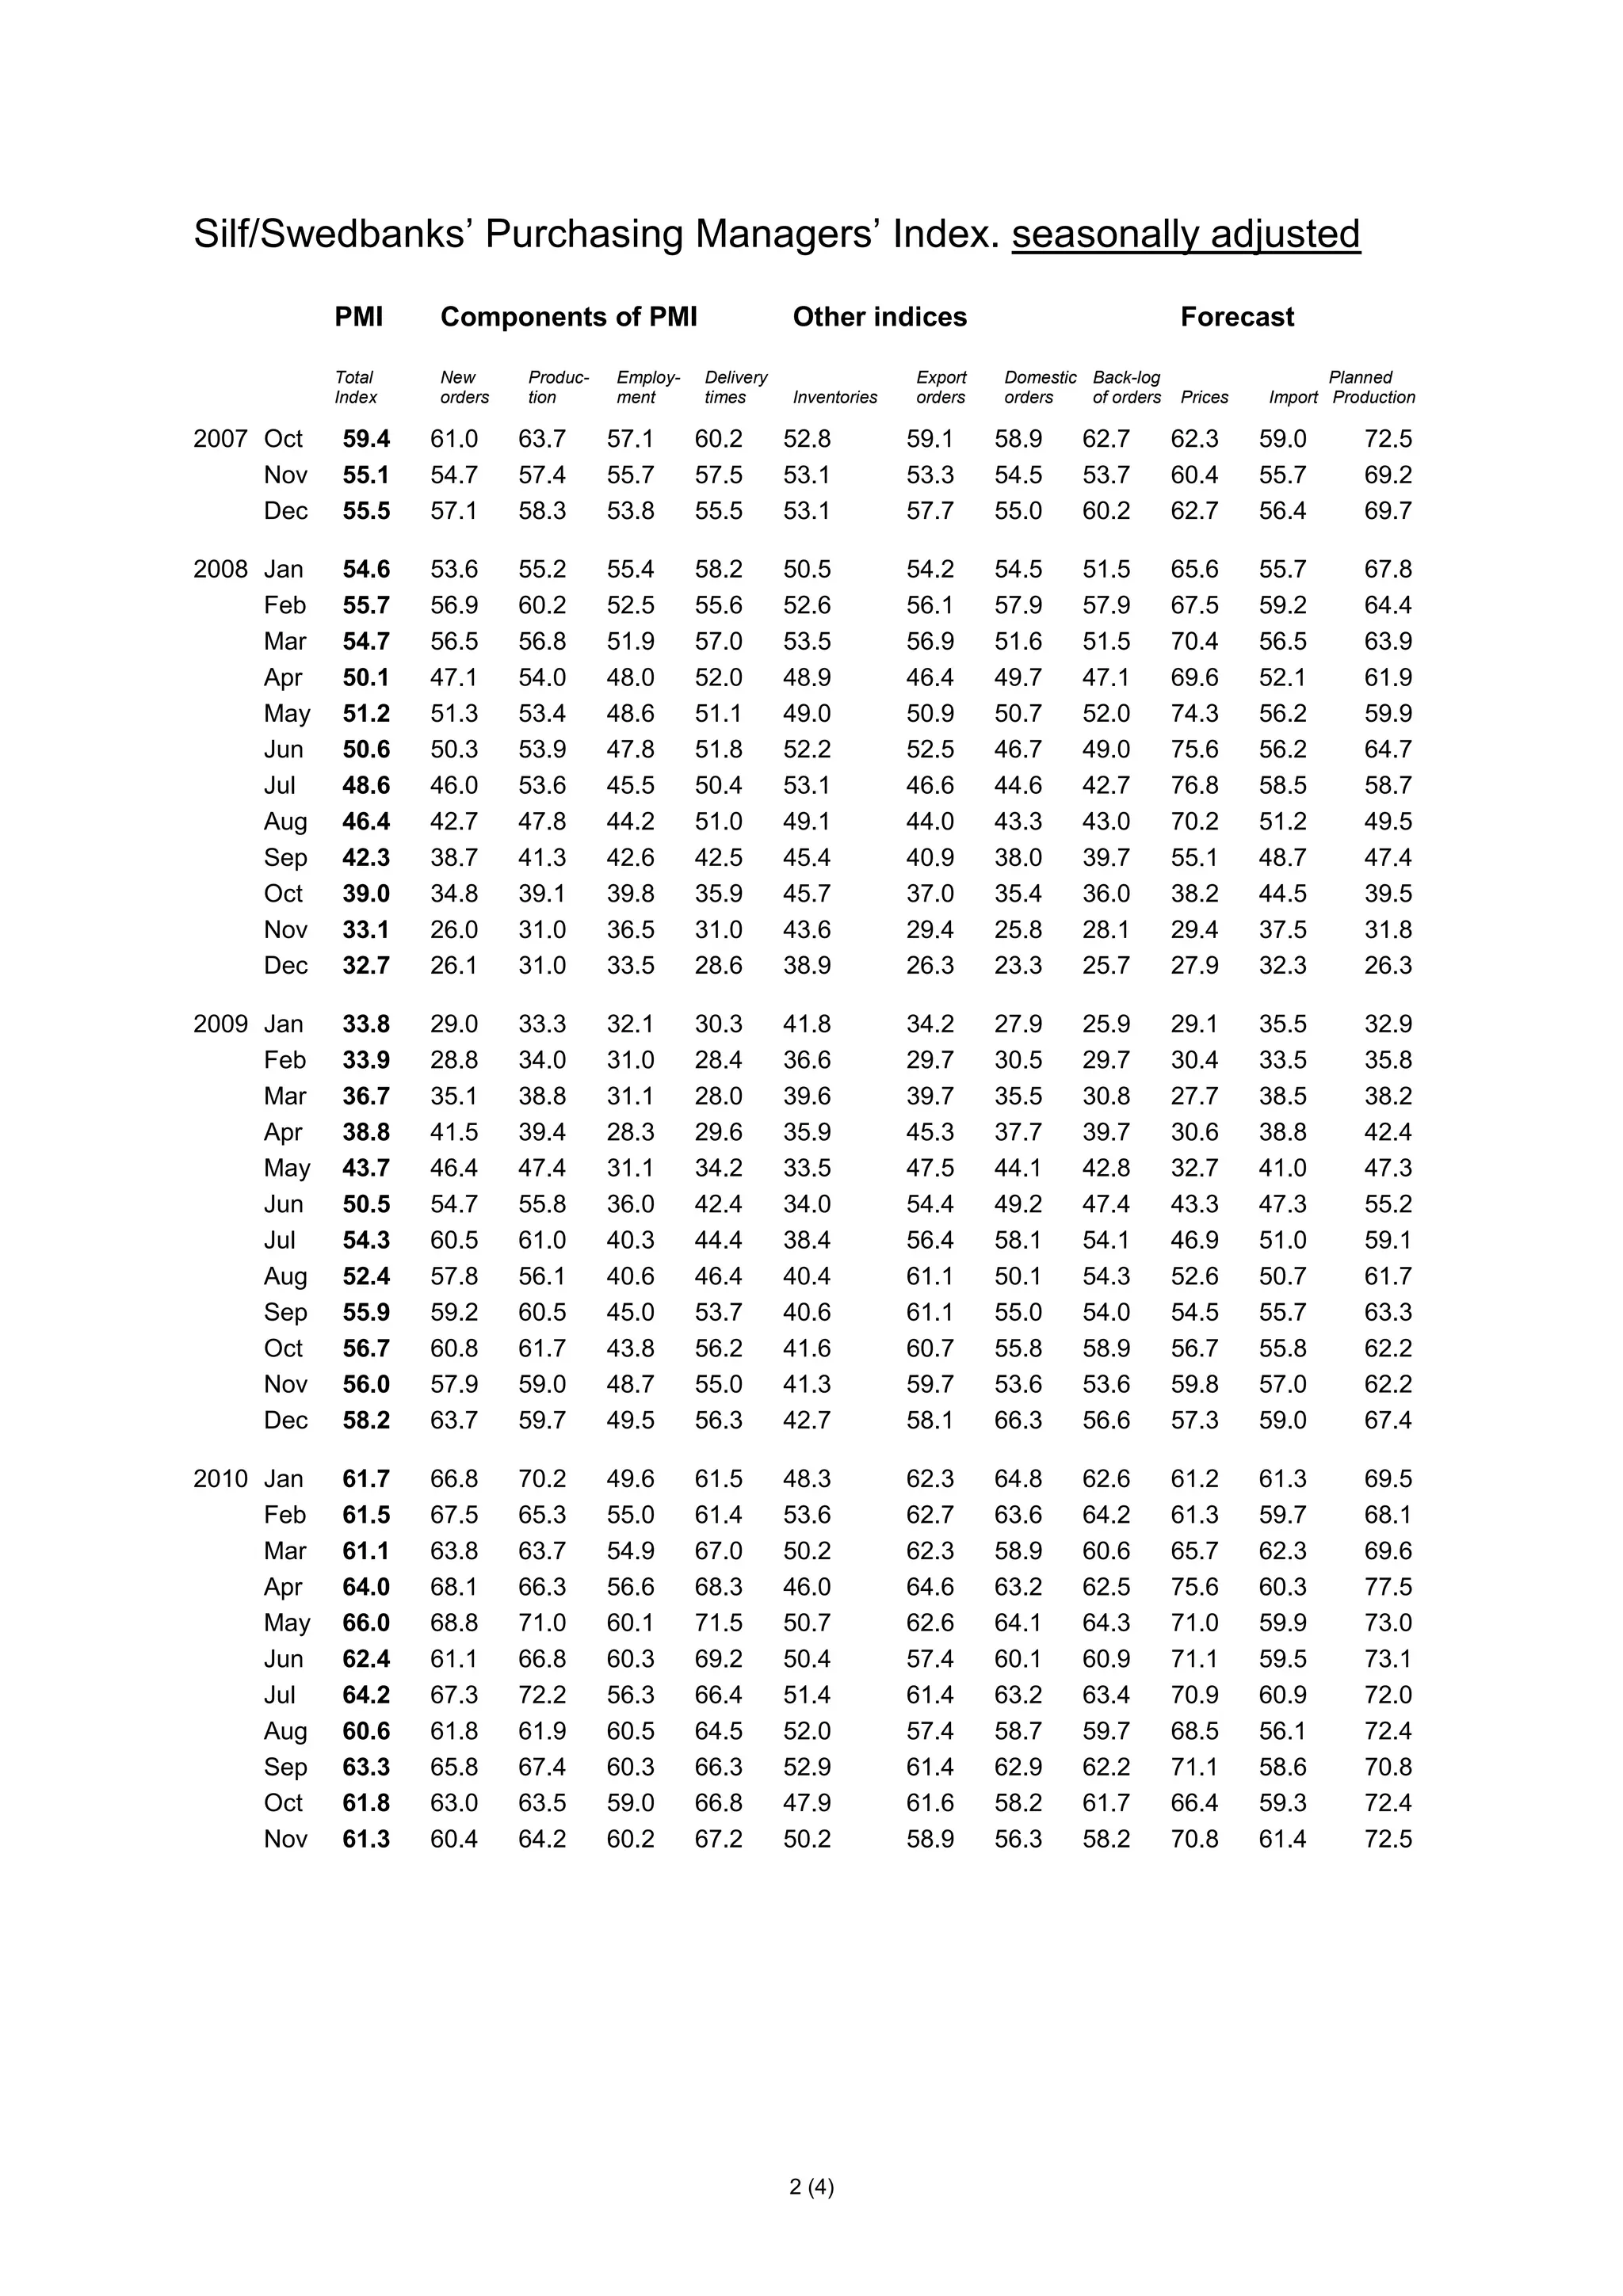
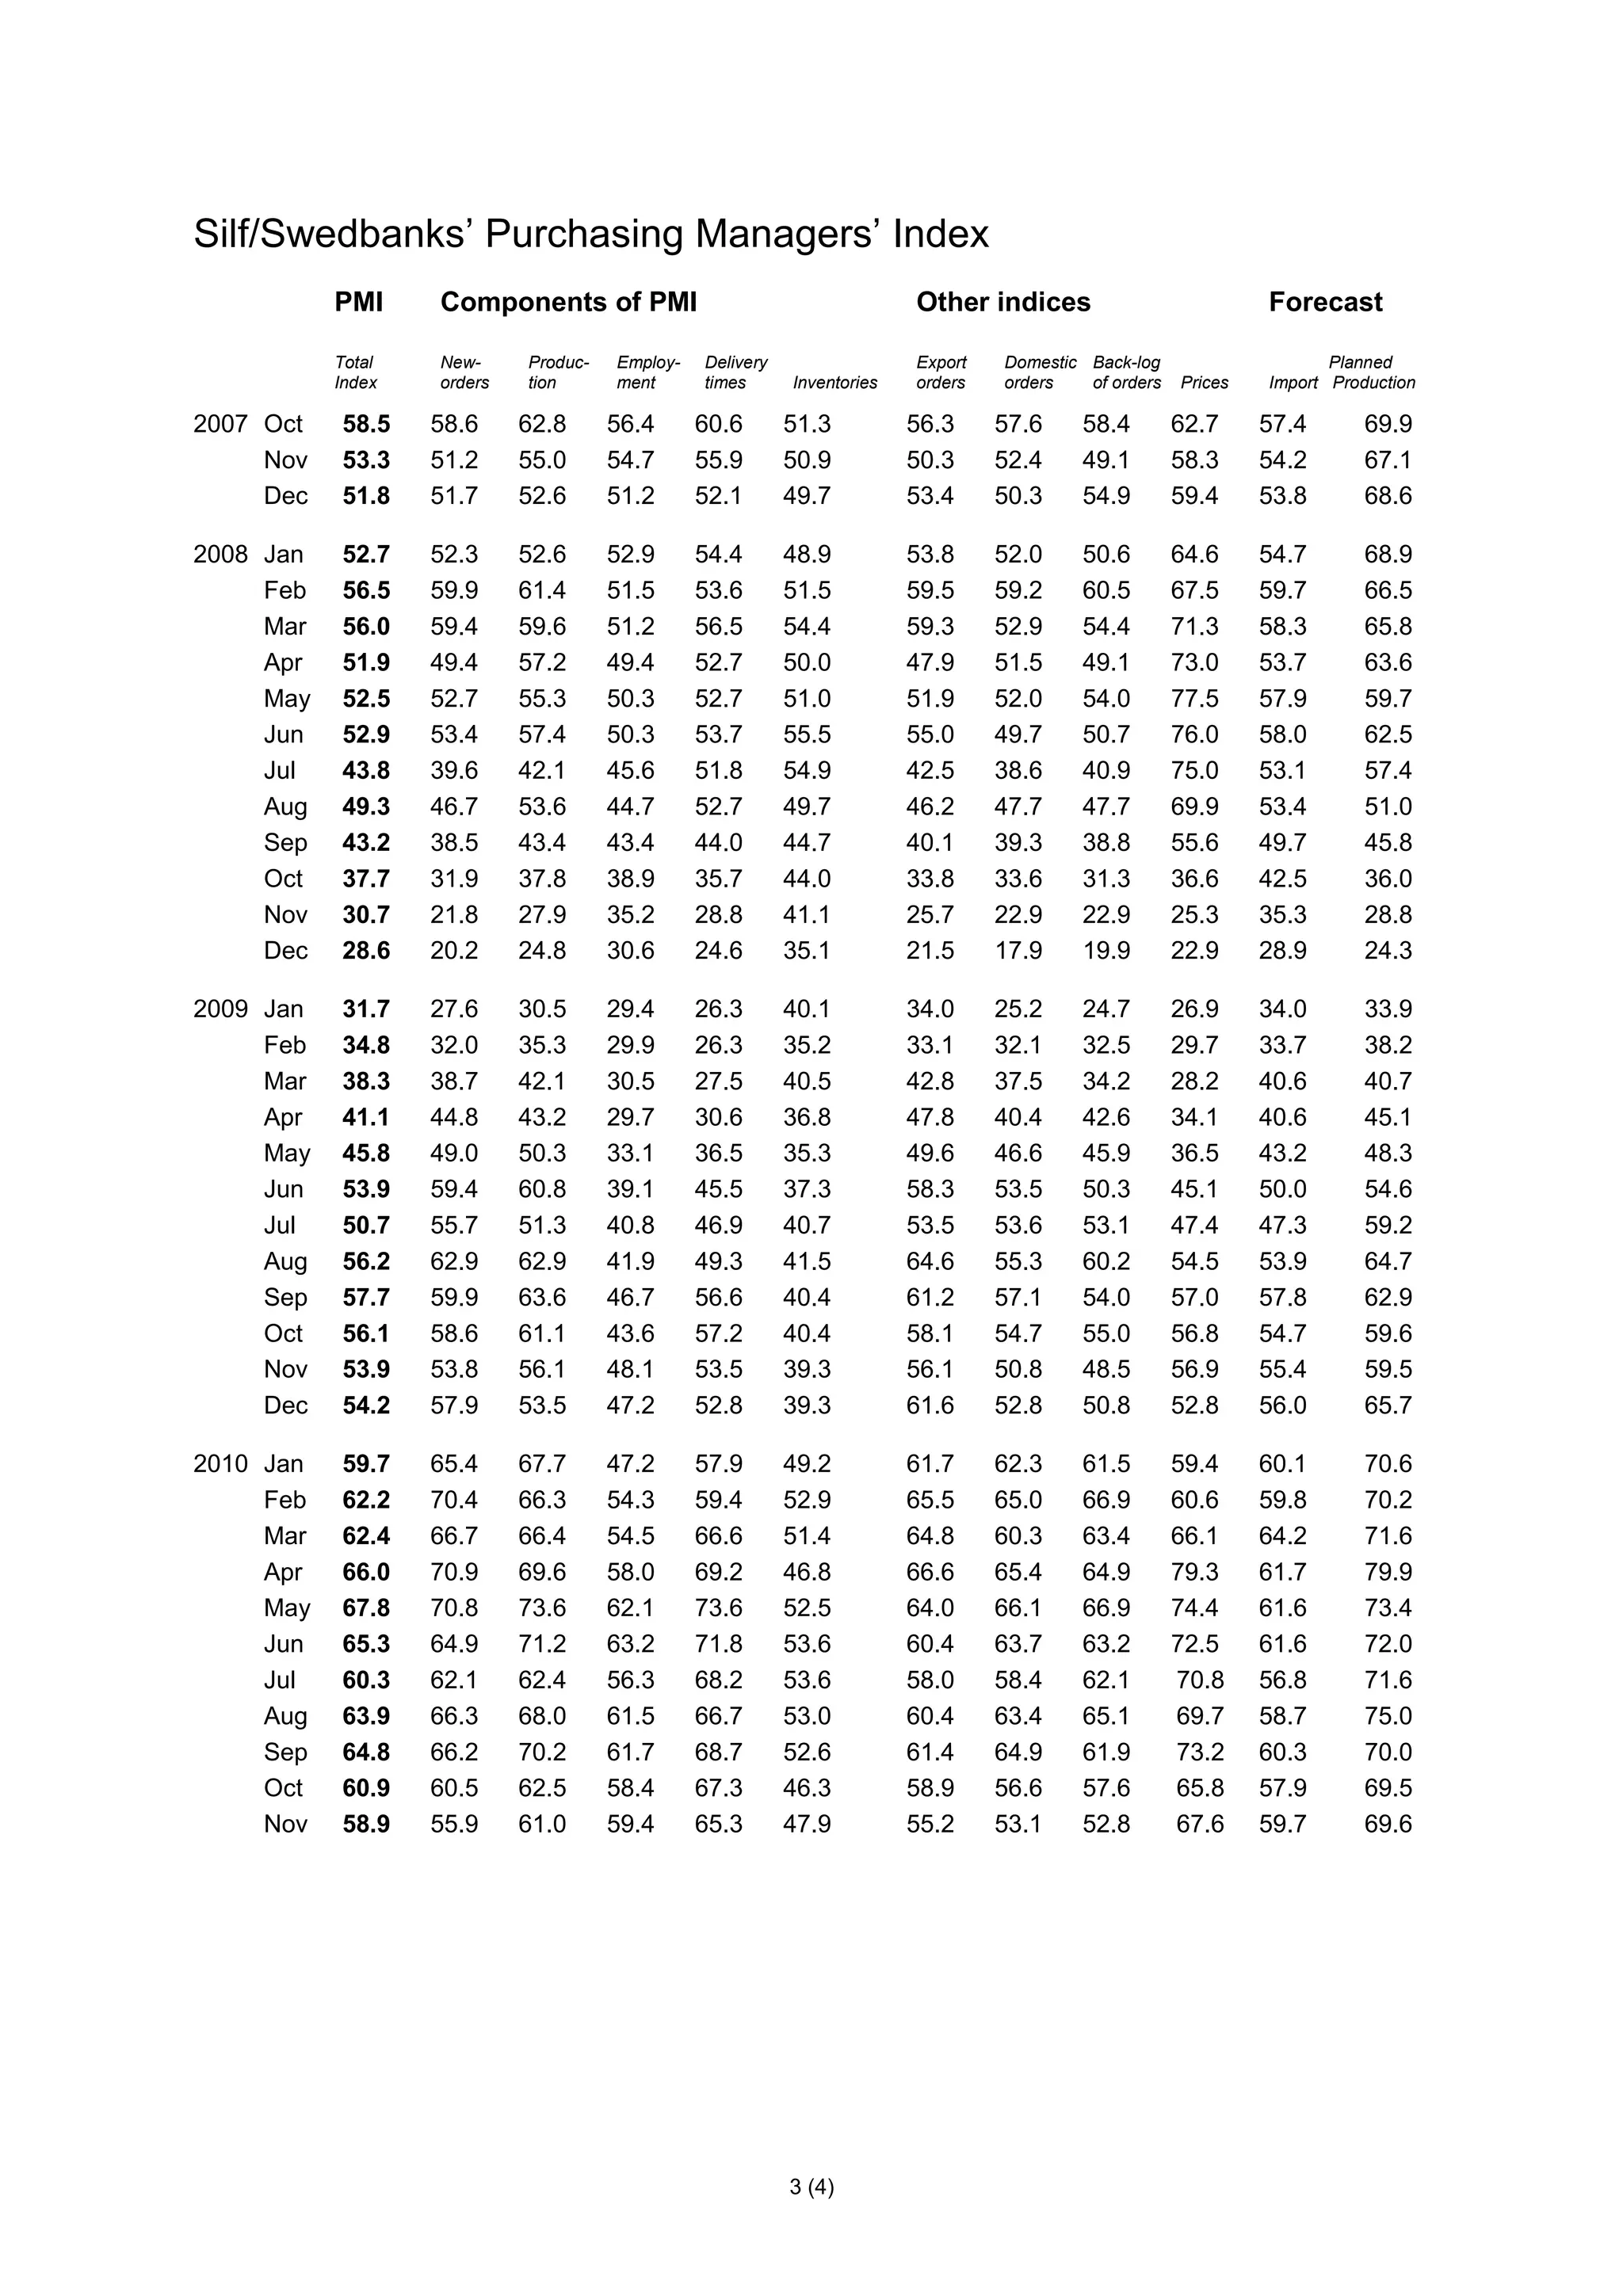

The Purchasing Managers' Index (PMI) for Sweden fell to 61.3 in November from 61.8 in October, indicating a slight slowdown in industrial growth; however, it has remained above 60 throughout 2010. New orders, particularly export orders, decreased due to both international and domestic market factors, although production and employment in the industrial sector continue to rise. Additionally, a significant increase in commodity and intermediate goods prices suggests rising costs for many companies, likely influenced by global economic improvements.


