Download to read offline
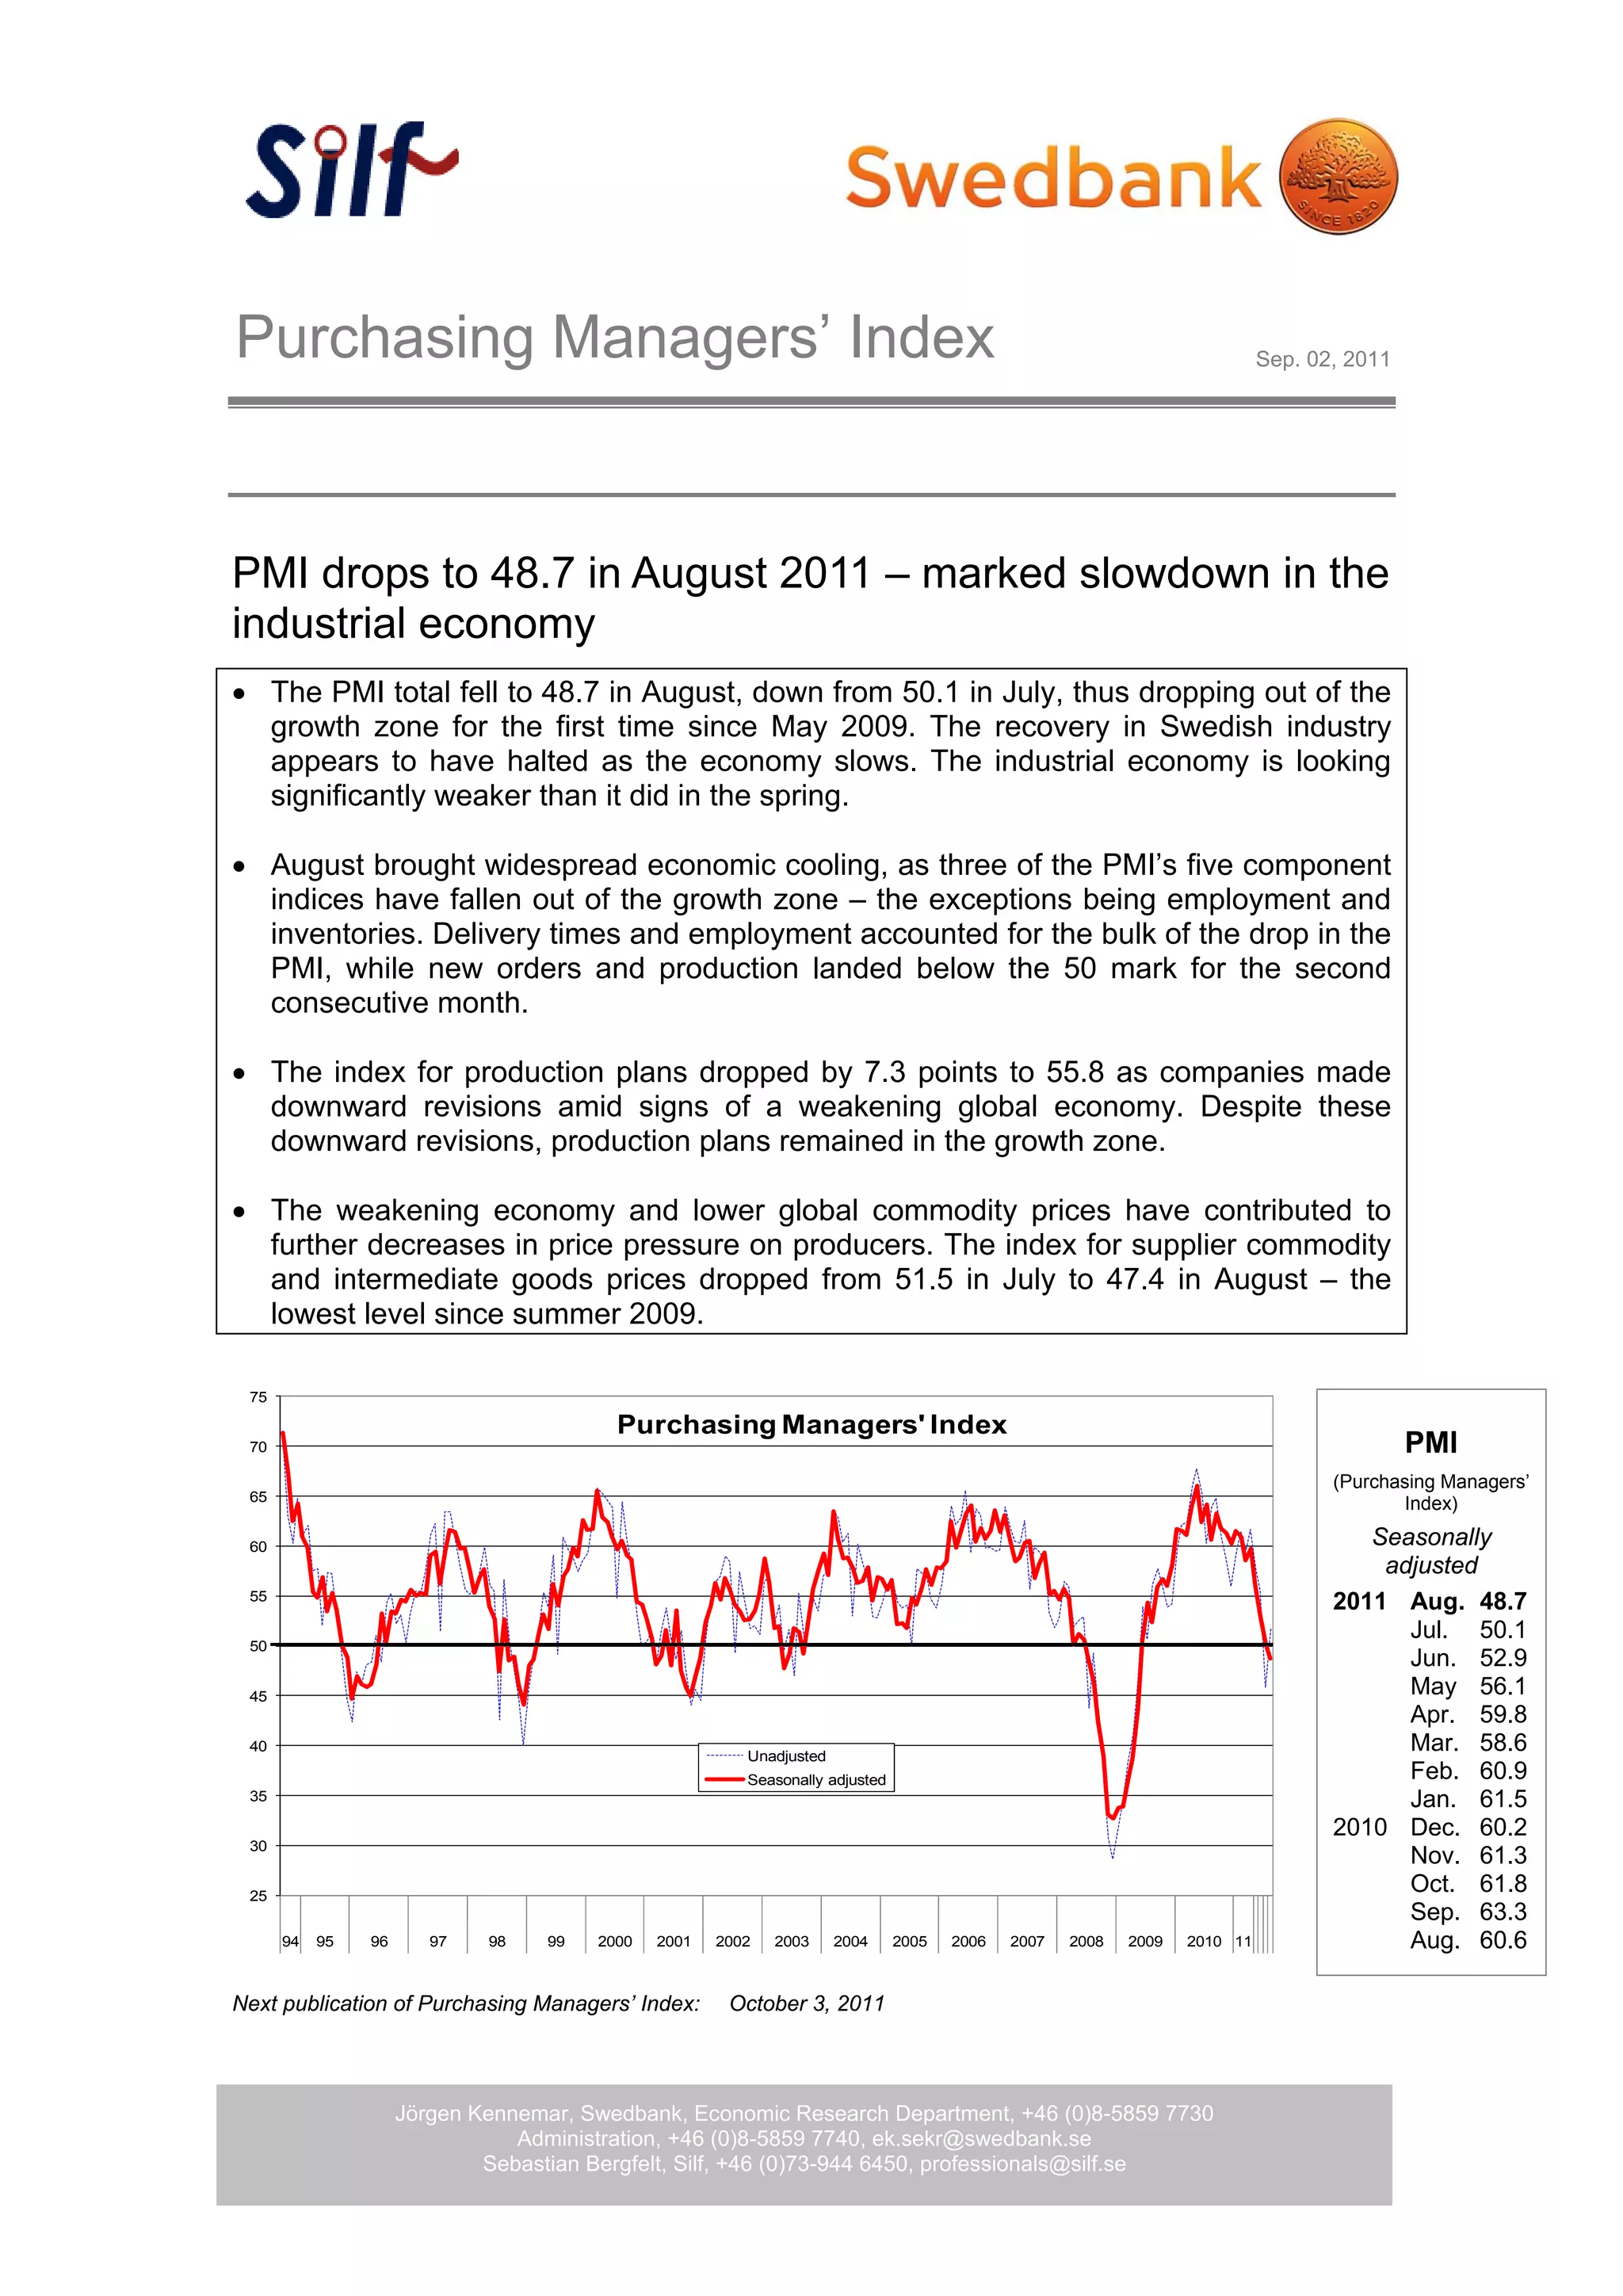

The Purchasing Managers' Index (PMI) dropped to 48.7 in August 2011, falling out of the growth zone for the first time since May 2009 and indicating a slowdown in Sweden's industrial economy. Three of the PMI's five component indices also fell out of the growth zone, with new orders, production, and delivery times declining. Additionally, the index for supplier commodity prices dropped to its lowest level since summer 2009, reflecting weaker global commodity prices and economic cooling. Overall, the data suggests Sweden's industrial recovery has stalled as the economy slows.


![Coded Agents – with UiPath SDK + LangGraph [Virtual Hands-on Workshop]](https://cdn.slidesharecdn.com/ss_thumbnails/codedagentsdeck-251215155422-5497c599-thumbnail.jpg?width=640&height=640&fit=bounds)


![Vibe Coding vs. Spec-Driven Development [Free Meetup]](https://cdn.slidesharecdn.com/ss_thumbnails/vibecodingvsspecdrivendevelopment-251209105622-43f455e7-thumbnail.jpg?width=640&height=640&fit=bounds)


