Download to read offline
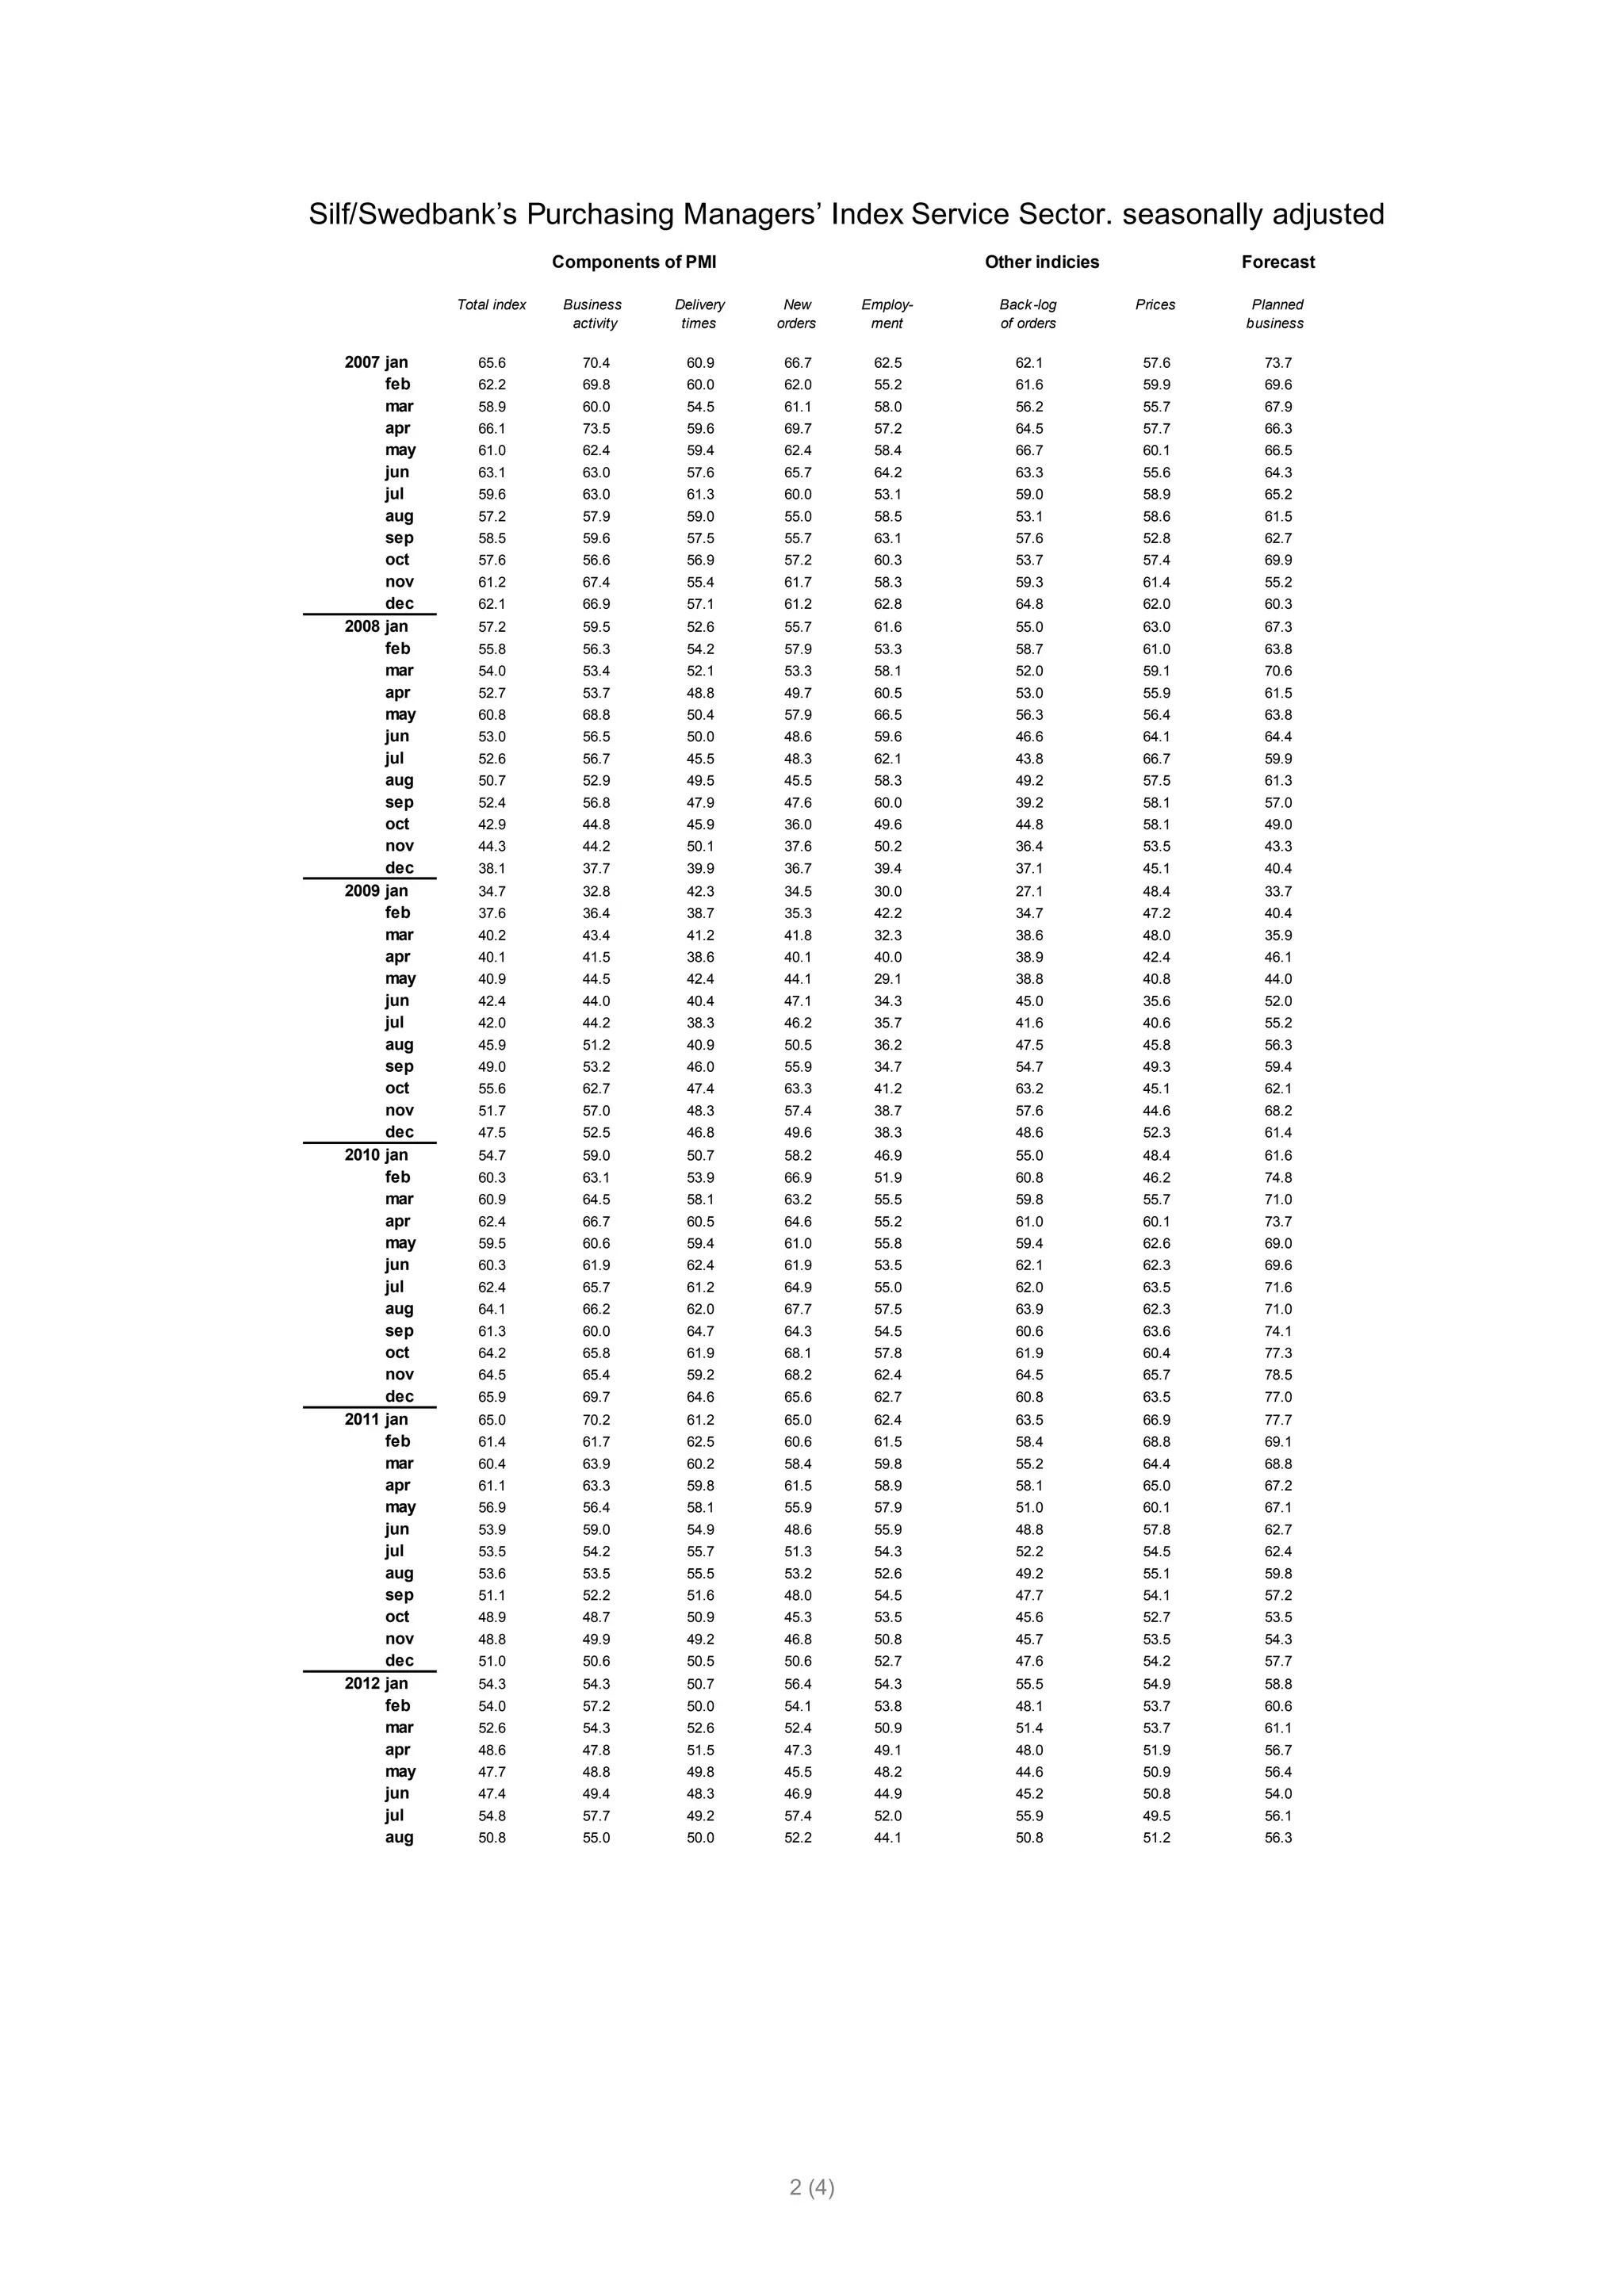

The Services PMI dropped from 54.8 in July to 50.8 in August, moderating the rise seen in July. All component indices declined except supplier delivery times. The employment index dropped significantly to 44.1, indicating weaker staffing needs among service companies. Despite the decline, indices except employment remained above 50, in the growth zone. Service companies remain cautiously optimistic about continued economic growth as the planned business activity index rose slightly.


