This document discusses conceptualizing school leadership and management from a distributed perspective. It argues that more research is needed on study operations and measures before making causal claims. It explores studying the formal and informal organization and relations between them. Several study operations are proposed and measures are discussed to capture aspects of leadership distribution, such as responsibilities of different leadership roles and alignment of leadership functions. The strengths and weaknesses of proposed measures are critically examined using school data. More work on conceptualization, study operations, and instrument development is urged to advance research from a distributed perspective.
The Importance Of Collective Leadership Aimed At Developing School Organizationnoblex1
Although teacher leadership is an established feature of educational reform, it was only 30 years ago that most literature on school improvement focused on principals and superintendents. Though the idea of teacher leadership is not new, the conception of this role has evolved considerably.
Source: https://ebookschoice.com/the-importance-of-collective-leadership-aimed-at-developing-school-organization/
Book review curriculum-theory and practice-kellyFernando Santos
This book answers the questions regarding to what is a real Educational Curriculum? or What should be a Democratic Curriculum? By implication, it refers the misconceptions and flaws in the practice of Curriculum Development and implementation, by reference to the Curriculum process in England and Wales throughout three decades.
The author ends this book by stating that an appropriate curriculum for a democratic society allows continuing development of knowledge, provides opportunities for young people to develop their powers of autonomous thinking, provides teachers with autonomy to make professional judgments, is developed in a democratic system of accountability, is framed in terms of guidelines and principles, is planned with the participation of key actors, among them professionals, academics, policy-makers and others.
Finally, this book Invites to develop further research on questions such as, the exploration of ‘the role of the professional teacher in a democratic society’, how democratic in the context in which the teacher performs his work?, the practical procedural principles based on the Human Development theory for a National Curriculum or Curriculum Development, the dimensions of the concept of education left behind in current National curriculums, the features of a National Curriculum that promote or block the development of students’ autonomy for a democratic society.
Authentic assessment of reflection in an ePortfolio: How to make reflection m...Helen Farley
In a doctoral study that focused on the enhancement of reflection through an ePortfolio-based learning environment, students’ indicated that they felt reflection was not real when it was used for assessment. This led to an examination of assessment practices linked to reflection and ways to make it authentic. The literature revealed that reflection is often a component of authentic
assessment rather than being a focus of it. The practices associated with the assessment of reflection are examined in order to formulate 4 guiding principles. These principles aim to make the process of reflection more ‘real’ to students in higher education settings, particularly when
using an ePortfolio platform.
Influence of Inspirational Motivation on Teachers’ Job Commitment in Public P...inventionjournals
The purpose of this study was to establish the influence of inspirational motivation on teachers’ job commitment in public primary schools in Matinyani Sub County, Kitui County, Kenya. One research objective guided the study. The study employed descriptive survey design. The sample for the study was 25 head teachers and 169 teachers. Data was collected by use of questionnaires. Pearson product correlation coefficient was used to analyze the data. Findings revealed that there was a significant and positive relationship between inspirational motivation and teachers’ job commitment (r = .774, N = 160). Based on the findings, the study concluded that inspirational motivation increased teachers’ job commitment and thus head teachers should increase inspirational motivation which is a key to increasing teachers’ job commitment. The study suggested that comparable studies in other public primary schools should be carried out in other parts of the county to find out whether the findings can be generalized to the entire county. Secondly, since the study focused on one element of transformative leadership style, a study should be conducted to establish how other elements of transformational leadership styles influence teachers’ job commitment.
EDUC 7001-8 Assignment 6: Prepare an Alpha-Numeric Outlineeckchela
This is a North Central University course (EDUC 7001-8), Advance Scholarly Writing: Assignment 6: Prepare an Alpha-Numeric Outline. It is written in APA format, has been graded by an instructor (A), and includes references. Most higher-education assignments are submitted to turnitin, so remember to paraphrase. Let us begin.
Running head TEN STRATEGIC POINTS 1TEN STRATEGIC POINTS 8.docxtodd521
Running head: TEN STRATEGIC POINTS 1
TEN STRATEGIC POINTS 8
Ten Strategic Points
Ten Strategic Points for a Quantitative Correlational Study
1. Topic- Topic plays a critical role in offering a wide research issue in the area of: Influence of Transformational Leadership on Student Performance and Engagement.
2. Literature review - Lists primary points for four sections in the Literature Review: a. Background of the problem/gap; b. Theoretical foundations (models and theories to be foundation for study); c. Review of literature topics with key theme for each one; d. Summary
a. Background of the Problem: Comment by Mohamed Ali: Please don’t describe
List first gap sources like
Gap
Vidyarthi et al. (2014) found that the EI of leaders demonstrated a significant, positive correlation with the job performance of their employees, and suggested continued research to explore the relationship between leaders’ emotional perceptions and their employees’ attitudes – specifically job satisfaction
Cancio et al. (2013) recommended that future studies look at the relationship between administrator support and teacher job satisfaction outside of a professional support organization
Bacground
Theories or models
i. Student engagement and performance are some of the leading problems that affect educators and institutional leaders. Numerous studies indicate that students should develop a sense of belonging for them to participate and improve their performance in school. However, there is still a dearth in knowledge on how transformational leadership can be leveraged to enhance student engagement and performance.
II. Many studies on student engagement only regard it as an indicator of academic attainment. These concepts are often premised on the idea that students who are disengaged or disaffected perform poorly. Nonetheless, low achievements can also cause students to withdraw from school.
III. There are many conditions that have been proposed as prerequisites for improved academic achievement. These often range from provision of learning resources to development of conducive learning climate.
IV. However, there is a paucity of knowledge on the impacts that leadership has on promoting learning behaviors in schools. In particular, not many studies have been conducted to investigate the effects of transformational leadership on academic achievement.
b. Theoretical foundations (models and theories to be foundation for study); Comment by Mohamed Ali: Cite sources
i. The transformational leadership theory will; inform the theoretical foundations of this study. The theory postulates that leaders posses behaviors that improve their followers’ level of motivation and innovative thinking. In so doing, the followers can effectively improve organizational innovation, individual performance, and organizational performance.
ii. Unlike the transactional leadership model, the transformational leadership theory seeks to nurture a sense of idealism and .
What is good teaching? Who is a good teacher? The search for the answers to these questions has become for teacher education a search for an educational Holy Grail. While appearing to be deceptively simple and seductively straightforward, these questions have instigated an enduring and ever-multiplying research tradition as well as a many sided international conversation involving practitioners, theorists, social scientists, teacher educators and faculty developers at all levels, administrators, and students.
Source: https://ebookschoice.com/the-search-for-an-educational-holy-grail/
Scaling up Innovation: Why Theories of Change MatterBrandon Muramatsu
by Elaine Seymour, University of Colorado at Boulder. Presented at the Workshop on Disseminating CCLI Innovations: Arlington, VA, February 18-19, 2010. Workshop organized by Joe Tront, Flora McMartin and Brandon Muramatsu.
Author One
Author Two
Author Three
Author Four
Author Five
Type and purpose
of study
Type means qualitative, quantitative, or mixed methods research.
Hypothesis or Research Questions
Both quantitative and qualitative research can have research questions, but only quantitative can have hypotheses.
Population
and
Sample
Methodology
Examples are case study, grounded theory, ethnography, quasi-experimental design etc.
Findings
We call it findings in qualitative research and results in quantitative research.
Evaluation
notes
Look for the limitations to the study. Small sample size, not generalizable, bias of researcher etc.
How will the study help your research or why are you rejecting it?
Stern’s (2015) Note Taking Table
Article One
Enabling school structures, collegial trust and academic emphasis: Antecedents of professionals learning
Article Two
Enhancing self-efficacy in elementary science teaching with Professional Learning Communities
Article Three
Teacher's perceptions and implementation of professional learning communities in a large Suburban School
Type and purpose
of study
Type means qualitative, quantitative, or mixed methods research.
The study examines the roles of ESS, trust and academic significance in the enlargement of PLC
The main aim of the study was to find out if there existed a relationship between the application of CL by elementary schools and the implementation of PLCs and other blocks that prevented the use of CL.
The main aim of this article was to understand the teachers’ take before and after the implementation of PLCs in the school. It was to provide more information on majorly three areas that is retention and success of students, retaining of teachers and lastly, teachers’ perception on leadership.
Hypothesis or Research Questions
Both quantitative and qualitative research can have research questions, but only quantitative can have hypotheses.
How is enabling structure of importance in the development of PLCs?
What is the role of collegial trust ?
How did self-efficacy of the teachers change during the period when the professional program was developed?
How did teacher instructional practice altered over time?
How did the results of expectancy change during that time?
What was the teachers’ perception before the implementation of PLCs?
How did the teachers react to the implementation of PLCs?
How teachers perceived leadership?
Population
and
Sample
General group being studied, size of sample or number of participants, age(s), gender, etc.
A survey was collected from 67 schools.
The concerned group was elementary school teacher. Different schools were picked and the research carried out in the sample of the concerned teams.
The study conducted with a population of 190 teachers from a district school and three more schools were included. The sample contained at least two teachers in each subject except in mathematics which had t.
This presentation is part of a workshop I run on Approaches to Doctoral Supervision as part of a Research Supervision Module for new doctoral supervisors.
A Systematic Literature Review of Servant Leadership Theoryi.docxransayo
A Systematic Literature Review of Servant Leadership Theory
in Organizational Contexts
Denise Linda Parris • Jon Welty Peachey
Received: 20 February 2012 / Accepted: 8 April 2012 / Published online: 22 April 2012
� Springer Science+Business Media B.V. 2012
Abstract A new research area linked to ethics, virtues,
and morality is servant leadership. Scholars are currently
seeking publication outlets as critics debate whether this
new leadership theory is significantly distinct, viable, and
valuable for organizational success. The aim of this study
was to identify empirical studies that explored servant
leadership theory by engaging a sample population in order
to assess and synthesize the mechanisms, outcomes, and
impacts of servant leadership. Thus, we sought to provide
an evidence-informed answer to how does servant leader-
ship work, and how can we apply it? We conducted a sys-
tematic literature review (SLR), a methodology adopted
from the medical sciences to synthesize research in a sys-
tematic, transparent, and reproducible manner. A disci-
plined screening process resulted in a final sample
population of 39 appropriate studies. The synthesis of these
empirical studies revealed: (a) there is no consensus on the
definition of servant leadership; (b) servant leadership
theory is being investigated across a variety of contexts,
cultures, and themes; (c) researchers are using multiple
measures to explore servant leadership; and (d) servant
leadership is a viable leadership theory that helps organi-
zations and improves the well-being of followers. This
study contributes to the development of servant leadership
theory and practice. In addition, this study contributes to the
methodology for conducting SLRs in the field of manage-
ment, highlighting an effective method for mapping out
thematically, and viewing holistically, new research topics.
We conclude by offering suggestions for future research.
Keywords Leadership � Leadership theory � Servant
leadership � Systematic literature review
Introduction
Leadership is one of the most comprehensively researched
social influence processes in the behavioral sciences. This is
because the success of all economic, political, and organi-
zational systems depends on the effective and efficient
guidance of the leaders of these systems (Barrow 1977). A
critical factor to understanding the success of an organiza-
tion, then, is to study its leaders. Leadership is a skill used to
influence followers in an organization to work enthusiasti-
cally towards goals specifically identified for the common
good (Barrow 1977; Cyert 2006; Plsek and Wilson 2001).
Great leaders create a vision for an organization, articulate
the vision to the followers, build a shared vision, craft a path
to achieve the vision, and guide their organizations into new
directions (Banutu-Gomez and Banutu-Gomez 2007; Kotter
2001). According to Schneider (1987), the most important
part in build.
Synthetic Fiber Construction in lab .pptxPavel ( NSTU)
Synthetic fiber production is a fascinating and complex field that blends chemistry, engineering, and environmental science. By understanding these aspects, students can gain a comprehensive view of synthetic fiber production, its impact on society and the environment, and the potential for future innovations. Synthetic fibers play a crucial role in modern society, impacting various aspects of daily life, industry, and the environment. ynthetic fibers are integral to modern life, offering a range of benefits from cost-effectiveness and versatility to innovative applications and performance characteristics. While they pose environmental challenges, ongoing research and development aim to create more sustainable and eco-friendly alternatives. Understanding the importance of synthetic fibers helps in appreciating their role in the economy, industry, and daily life, while also emphasizing the need for sustainable practices and innovation.
Macroeconomics- Movie Location
This will be used as part of your Personal Professional Portfolio once graded.
Objective:
Prepare a presentation or a paper using research, basic comparative analysis, data organization and application of economic information. You will make an informed assessment of an economic climate outside of the United States to accomplish an entertainment industry objective.
The Roman Empire A Historical Colossus.pdfkaushalkr1407
The Roman Empire, a vast and enduring power, stands as one of history's most remarkable civilizations, leaving an indelible imprint on the world. It emerged from the Roman Republic, transitioning into an imperial powerhouse under the leadership of Augustus Caesar in 27 BCE. This transformation marked the beginning of an era defined by unprecedented territorial expansion, architectural marvels, and profound cultural influence.
The empire's roots lie in the city of Rome, founded, according to legend, by Romulus in 753 BCE. Over centuries, Rome evolved from a small settlement to a formidable republic, characterized by a complex political system with elected officials and checks on power. However, internal strife, class conflicts, and military ambitions paved the way for the end of the Republic. Julius Caesar’s dictatorship and subsequent assassination in 44 BCE created a power vacuum, leading to a civil war. Octavian, later Augustus, emerged victorious, heralding the Roman Empire’s birth.
Under Augustus, the empire experienced the Pax Romana, a 200-year period of relative peace and stability. Augustus reformed the military, established efficient administrative systems, and initiated grand construction projects. The empire's borders expanded, encompassing territories from Britain to Egypt and from Spain to the Euphrates. Roman legions, renowned for their discipline and engineering prowess, secured and maintained these vast territories, building roads, fortifications, and cities that facilitated control and integration.
The Roman Empire’s society was hierarchical, with a rigid class system. At the top were the patricians, wealthy elites who held significant political power. Below them were the plebeians, free citizens with limited political influence, and the vast numbers of slaves who formed the backbone of the economy. The family unit was central, governed by the paterfamilias, the male head who held absolute authority.
Culturally, the Romans were eclectic, absorbing and adapting elements from the civilizations they encountered, particularly the Greeks. Roman art, literature, and philosophy reflected this synthesis, creating a rich cultural tapestry. Latin, the Roman language, became the lingua franca of the Western world, influencing numerous modern languages.
Roman architecture and engineering achievements were monumental. They perfected the arch, vault, and dome, constructing enduring structures like the Colosseum, Pantheon, and aqueducts. These engineering marvels not only showcased Roman ingenuity but also served practical purposes, from public entertainment to water supply.
Unit 8 - Information and Communication Technology (Paper I).pdfThiyagu K
This slides describes the basic concepts of ICT, basics of Email, Emerging Technology and Digital Initiatives in Education. This presentations aligns with the UGC Paper I syllabus.
How to Make a Field invisible in Odoo 17Celine George
It is possible to hide or invisible some fields in odoo. Commonly using “invisible” attribute in the field definition to invisible the fields. This slide will show how to make a field invisible in odoo 17.
Francesca Gottschalk - How can education support child empowerment.pptxEduSkills OECD
Francesca Gottschalk from the OECD’s Centre for Educational Research and Innovation presents at the Ask an Expert Webinar: How can education support child empowerment?
Palestine last event orientationfvgnh .pptxRaedMohamed3
An EFL lesson about the current events in Palestine. It is intended to be for intermediate students who wish to increase their listening skills through a short lesson in power point.
2. and management are distributed in schools and school outcomes (Heck & Hallinger,
2009; Silins & Mulford, 2002). Still, much of the empirical work to date has been
descriptive, sometimes focused on hypothesis generation and theory development.
Although often portrayed, at least implicitly, as inferior to research that seeks to test
hypotheses or predict outcomes, more descriptive work is necessary to improve our
understanding of how leadership is distributed in schools so that we can then explore
how these arrangements influence school outcomes.
The distributed perspective’s appeal to scholars suggests that it has some utility in
framing and focusing research studies and some promise in extending the extant
empirical knowledge base on elementary school leadership and management. How-
ever, appeal or popularity, though necessary, is insufficient. Whether a distributed
perspective realizes its potential as a conceptual framework and makes a unique
contribution to scholarship on leadership and management will depend on how
scholars use the perspective to frame their research. At least three distinct though
closely related areas of work are essential in this regard. First, while most of the
writing on distributed leadership has focused on developing the theoretical or ana-
lytical frame, more work is still needed, especially work that explores different
emerging conceptualizations and their implications for scholarship. The primary
goal of such work should be to sharpen the analytical tools that researchers can apply
in their empirical work. Loose constructs contribute to fuzzy scholarship as research-
ers easily talk past one another with broad constructs or ideas that denote very
different concepts from one person to the next, thereby creating a false sense of
consensus.
Second, the development of study operations is especially critical for translating
theoretical and analytical ideas into measures for data collection and analysis, en-
abling the distributed framework to be used systematically in research studies. Study
operation refers to the definition and specification of an aspect of a conceptual or
analytical framework so that the framework can be measured based on observations
in the field. The operationalization of theoretical or analytical ideas in the distributed
perspective has received short shrift to date. This work will involve developing study
operations and measures of different aspects of school leadership and management
when viewed through a distributed lens that can be used to gather and analyze data.
A key part of this work has to be a critical appraisal of what these study operations
include and exclude. Such work is essential so that the field moves beyond relying
chiefly on repackaging or relabeling existing measures to fit with a distributed per-
spective. While we can, and indeed should, salvage existing measures whenever pos-
sible in applying a distributed perspective, an exclusive focus on salvaged measures
runs the risk of a distributed perspective becoming simply a new label for old and
familiar constructs: It increases the likelihood that a distributed perspective simply
becomes a catchall for any attempt to share or delegate leadership (Harris, 2005).
Third, most of the work to date has relied on a handful of research instruments
that have dominated research on school leadership and management—especially
school staff surveys, structured and semistructured interviews, and open- and
closed-ended observations. Using a distributed perspective to frame research on
leadership and management, however, will very likely necessitate the development of
new research instruments, or at least the redesigning of instruments borrowed from
other fields, so that the instruments are properly tailored for studies of elementary
school leadership and management (Camburn, Spillane, & Sebastian, 2010; Pitts &
⅐
3. Spillane, 2009; Pustejovsky, Spillane, Heaton, & Lewis, 2009; Spillane & Zuberi,
2009). Hence, more work on the design and validation of research instruments is
important.
The ultimate quality of any effort to make causal inferences between leadership
and management, framed from a distributed perspective, and key school outcomes
will be largely determined by work on construct conceptualization, study operations
and measures, and instrument development. Fancy statistical methods, or even ran-
dom assignment, cannot compensate for loose constructs, weak study operations,
and invalid and unreliable measurement. While some recent work has attended
explicitly to study operations when using a distributed perspective, more work is
necessary (Camburn et al., 2003; Spillane et al., 2007, 2009).
In this article, we explore some study operations and measures for school leader-
ship and management when conceptualized from a distributed perspective. In doing
so, we argue for more work that strives to theorize about key dimensions with respect
to how leadership and management are distributed in schools, consider different
study operations based on these conceptualizations, and entertain possible measures
for them. While this work is in part technical, it is also fundamentally conceptual as
such measures have to be motivated and justified using existing theoretical and
empirical work. Honing in on certain core aspects of the distributed perspective, we
motivate and justify specific study operations and explore measures of these opera-
tions. Using data from the 30 elementary schools in one midsized urban school
district, we examine the extent to which these measures pick up on variation between
schools and then critically appraise the strengths and weaknesses of our measures.
Recognizing that a distributed perspective presses for attention to both the formal
and informal organization, we focus this article on the formal and informal organi-
zation and relations between these two aspects.
We discuss our particular understanding of a distributed perspective before re-
viewing how the distributed perspective has been operationalized in some recent
empirical research. We next describe the data used in the article before turning our
attention to different ways of conceptualizing, operationalizing, and measuring as-
pects of the formal and informal organization. We entertain several study opera-
tions, motivating and justifying these operations using the theoretical and/or empir-
ical literature. In short, we explore the different ways in which aspects of a distributed
framework might be operationalized so that we can measure these dimensions. It is
important to note that our work is not meant to be exhaustive as we focus on par-
ticular aspects of the framework, and the study operations that we entertain for these
aspects are limited by our data. After articulating and justifying our study operations,
we explore whether our measures of these operations capture variation between the
30 elementary schools in our study.
Conceptual and Empirical Anchors
A Distributed Perspective
Before proceeding, it is important to explain what we mean by taking a distributed
perspective to frame research on leadership and management (Gronn, 2003; Spil-
lane, 2006; Spillane, Diamond, & Jita, 2003). A distributed perspective involves two
⅐
4. aspects: the leader-plus aspect and the practice aspect (Spillane, 2006; Spillane &
Diamond, 2007).
The leader-plus aspect recognizes that leading and managing schools can involve
multiple individuals in addition to the school principal, including others in formally
designated leadership or management positions, such as assistant principals, mentor
teachers, and curriculum specialists. Among other things, the available empirical
work suggests that an exclusive focus on the school principal is limiting, as other
formally designated leaders play critical roles in leading and managing schools
(Camburn et al., 2003; Harris, 2005; Leithwood et al., 2007; MacBeath et al., 2004;
Spillane & Diamond, 2007). Furthermore, a distributed perspective allows for the
possibility that individuals without any formal leadership designation can take re-
sponsibility for the work of leading and managing in schools. Contrary to some
portrayals, a distributed perspective as we understand it does not assume that every-
one is or ought to have a hand in leading and managing.
At one level, the leader-plus aspect is simply about identifying those individuals
involved in leading and managing in the school. By moving beyond identification of
individual leaders and simple aggregations, a distributed perspective also presses us
to consider how these individuals, as a collective, are arranged in carrying out the
work of leading and managing. Such considerations press us to examine various
factors, from the division or duplication of leadership and management responsibil-
ities to whether and how those who have a hand in leading and managing in schools
complement one another.
The leadership practice aspect foregrounds the practice of leading and managing.
Defining leadership and management in terms of practice allows for the possibility
that people without formal leadership designations might take responsibility for that
work (Heifetz, 1994). But the practice aspect presses us to move beyond individual
actions. From a distributed perspective, practice is not just about the actions of
individual leaders, although they are clearly relevant, but instead is fundamentally
about interactions (Spillane, 2006). Actions are insufficient in the study of leadership
and management practice from a distributed perspective because practice is framed
as a product of the interactions among leaders, followers, and aspects of their situa-
tion. In this framing, school staff—be they the principal, curriculum specialist, or
classroom teacher—can move in and out of leadership and management roles de-
pending on the activity or situation. Of course, regardless of their activities, formally
designated leaders such as the school principal always have their assigned position.
Therefore, framing leadership and management from a distributed perspective fore-
grounds formal and informal aspects of the school organization as well as the rela-
tionship between the formal and informal aspects.
Study Operations
As one might expect given the relative novelty of efforts to flesh out a distributed
perspective, applications of the perspective as a conceptual frame in empirical work
are neither uniform nor monolithic. However, some common usages are emerging,
which, in our view, is healthy, as this process reflects something of a dialogue among
scholars. Though often not explicitly discussed, various studies have used different
study operations in framing and measuring school leadership and management from
a distributed perspective. To get a sense of some of the different study operations and
⅐
5. measures employed by researchers using a distributed perspective, we consider three
studies that relied on questionnaires and/or interviews.
Camburn et al. (2003) surveyed teachers and formally designated school leaders in
120 geographically dispersed U.S. elementary schools, most of which were involved
in one of three comprehensive school reform (CSR) models. Taking a distributed
perspective, Camburn et al. (2003) operationalized leadership as a set of leadership or
organizational functions (Heller & Firestone, 1995) and surveyed formally desig-
nated leaders about their responsibility for these functions. Study participants were
asked about leadership functions that fell into one of three categories: instruction,
building management, and boundary spanning. Camburn et al. (2003) then exam-
ined which formally designated leadership positions took responsibility for different
leadership functions, showing that while some formally designated leadership posi-
tions (e.g., school principal) were generalists performing functions that cut across
instruction, building management, and boundary spanning, others tended to be
specialists (e.g., CSR coaches) focused on instruction. In Camburn et al.’s (2003)
study, researchers asked all formally designated leaders to report on their work re-
sponsibilities.
Leithwood et al. (2007) also took a distributed perspective in a study involving 25
secondary and 140 elementary schools in a large urban/suburban school district in
Ontario. Extending Peter Gronn’s (2002) work on three “holistic forms” of distrib-
uted leadership, Leithwood et al. conceptualized how leadership is distributed in
schools by focusing on the extent to which the performance of leadership functions
is consciously aligned across different sources of leadership. Leithwood et al. (2007)
proposed four study operations. First, planful alignment denotes situations in which
those responsible for leadership in a school have worked out in advance who will take
responsibility for particular leadership tasks and functions. Second, spontaneous
alignment, similar to Gronn’s “spontaneous collaboration,” denotes situations in
which responsibility for leadership tasks and functions is not based on planning but
rather on tacit agreements that emerge from spontaneous interactions among staff.
Third, spontaneous misalignment has identical origins to spontaneous alignment
but results in situations in which the sources of leadership in a school are misaligned
with one another in terms of the beliefs, values, and norms communicated by differ-
ent sources. Fourth, anarchic misalignment refers to situations in which some of the
individuals who take responsibility for leadership in a school actively reject the legit-
imacy of other sources of leadership for particular tasks or functions. As a result of
this conflict, particular groups of school leaders can work independently of one
another, actively challenging the perspectives of other leaders and competing with
them for access to resources. Leithwood and colleagues theorized how these different
leadership arrangements impact school outcomes. They argued, for example, that
spontaneous misalignment and anarchic alignment are likely to have negative effects
on organizational performance and outcomes (Leithwood et al., 2007; Leithwood,
Seashore Louis, Anderson, & Wahlstrom, 2004).
In another study using a distributed leadership framework, Heck and Hallinger
(2009) focused on sources of leadership, but from the teachers’ perspective. To
model distributed leadership effects on student learning, they conceptualized dis-
tributed leadership as “forms of collaboration practiced by the principal, teachers,
and members of the school’s improvement team in leading the school’s develop-
ment” (Heck & Hallinger, 2009). Heck and Hallinger (2009) developed study oper-
⅐
6. ations that tap into three aspects of distributed leadership in schools and measure
these operations using survey items regarding teachers’ perceptions of leadership as
exercised by different sources. First, Heck and Hallinger examined teachers’ percep-
tions of collaborative decision making about educational improvement in the school
(e.g., the extent to which school leadership ensures that teachers have a major role in
decisions about curriculum development). Second, they considered teachers’ per-
ceptions of the extent to which school leadership emphasized school governance that
empowered staff and students, as well as encouraged commitment, participation,
and shared accountability for student learning. Third, they considered teachers’ per-
ceptions of the emphasis school leaders placed on participation in efforts to evaluate
the school’s academic development, such as the provision of regular opportunities
for all the school’s stakeholders to review the school’s vision and purpose.
These studies, employing a distributed framework and all focusing on sources of
leadership in a school, apply different study operations and measures of how lead-
ership is distributed. While Camburn et al. (2003) focused exclusively on the formal
organization, the other studies also attend to the informal sources of leadership in a
school as it is perceived by staff members. Whereas Leithwood et al. (2007) focused
on the degree to which leadership is preplanned and aligned among leaders, Heck
and Hallinger (2009) focused on how teachers perceive the distribution of leadership
functions. Comparing and contrasting these three studies, we can identify at least
three dimensions on which study operations might differ when taking a distributed
perspective. One dimension concerns who takes responsibility for leadership and
management; that is, among which individuals or roles is responsibility for the work
distributed. Study operations can focus exclusively on the formal organization or
they can also include informal sources of leadership. Another dimension is the what;
that is, what aspects of the work or functional responsibilities are distributed. Both
Camburn et al.’s (2003) and Heck and Hallinger’s (2009) study operations attend to
the what aspect but conceptualize and carve up this terrain differently. A third di-
mension concerns how the work is distributed, such as Leithwood et al.’s (2007)
attention to spontaneous versus planned distribution, or Heck and Hallinger’s
(2009) focus on empowerment and collaborative decision making. As the aforemen-
tioned studies illustrate, study operations may or may not attend to any one of these
dimensions. Furthermore, each dimension can be operationalized in different ways,
and the resulting study operations can be combined (e.g., who takes responsibility
for what functions) in ways that can accentuate differences between studies. If we
took the next step and focused on the measurement of study operations, we suspect
that the differences among studies would increase.
Our point here is not that any of these study operations are preferable. Indeed, we
could have included three different research studies with study operations that
differed from those used in the three aforementioned studies. Rather, we want to
underscore that the conclusions we can draw from empirical research using a dis-
tributed framework on school leadership depend on the study operations and mea-
sures used in the research.
Research Methodology
We use data from one midsized urban school district in this article in order to
examine how various aspects of a distributed framework might be operationalized
⅐
7. and measured. Furthermore, we consider whether and how our measures capture
variance among the schools in our study.
Site and Sample
Data for this study come from an urban, midsized K–12 district in the southeast-
ern United States. For this article, we analyzed data collected using two research
instruments: a principal questionnaire (PQ) and a school staff questionnaire (SSQ),
both of which were administered in 2005. Twenty-nine elementary school principals
completed the PQ (a Web questionnaire) in the spring of 2005, with a response rate
of 97%.1
Also in the spring of 2005, staff members at each of the district’s 52 schools,
including 1,210 staff members at 30 elementary schools, completed the baseline SSQ.
The elementary school response rate was 89%, with school-level rates ranging from
62% to 100%. Not included in the SSQ sample are art, music, and computer teachers;
paraprofessionals; administrative secretaries and clerks; social workers; psycholo-
gists; and food-service workers. Descriptive statistics about the elementary schools
are included in Table 1. Any additional variation in the number of respondents is due
to missing data.
Data Analysis
As this article is largely descriptive, the analysis primarily includes descriptive
statistics and correlations. Our primary unit of analysis is the school, with most
variables representing data aggregated from individual school staff members. Given
that the focus of this piece is the development of study operations and measures
when taking a distributed perspective, we take up the description of the measures and
the analysis involved below as we describe each measure. We use three purposively
selected schools from our sample—Taylor, Hancock, and Chase—to illustrate the
variance between schools on key measures. We selected these three schools in order
to maximize variance on the ratio of formally designated leaders to all other staff
(discussed below). These three cases take us beyond central tendencies and ranges
and give the reader a sense of what some of our study operations look like in the
schools.
Operationalizing and Measuring Leadership and Management:
Formal and Informal Aspects of the School Organization
Conceptualizing school leadership and management from a distributed perspective,
we organize our account around the formal and informal aspects of school organi-
Table 1. Elementary School Descriptive Statistics for the 2004–2005
Academic Year (n ϭ 30)
Variable Mean SD
Number of students 572.60 122.14
Number of faculty members 45.17 10.03
Free and reduced-price lunch eligible students (%) 63.61 21.77
Caucasian students (%) 27.77 24.18
African American students (%) 64.76 27.97
Hispanic students (%) 3.36 4.23
⅐
8. zation. Researchers have long concluded that the informal organization is not a
mirror image of the formal organization (Dalton, 1959; Downs, 1967; Homans, 1950;
Meyer & Rowan, 1977). Formally designated leaders, for example, do not always
behave as their job descriptions suggest they should. This is not simply a function of
intentional subversion or the shirking of formal responsibilities on the part of orga-
nizational members; the formal organization can lend legitimacy to the organization
even if it does not accurately reflect what organizational members actually do (Meyer
& Rowan, 1977). Efforts to study leadership and management need to pay attention to
formal and informal aspects of the school organization and relations among the two
(Bidwell & Yasumoto, 1999; McLaughlin & Talbert, 1993). We begin by situating our
work in this article within the extant theoretical and empirical literature. We then
articulate our study operations and measures for the dimension and consider the
evidence on the variation among schools in our study.
Our goal is to extend the conversation about developing study operations and mea-
surement from a distributed perspective. The study operations we propose here are not
intended to supplant prior study operations but rather to supplement them so as to
extend the dialogue about operationalizing a distributed perspective in research. Our
efforts are constrained by our current empirical work. Hence, we make no claims with
respect to being exhaustive or comprehensive in our treatment.
The Formal Organization
Prior empirical work suggests that an exclusive focus on the school principal is
indeed shortsighted in studying school leadership and management (Harris, 2005;
Leithwood et al., 2007; MacBeath et al., 2004; Spillane & Diamond, 2007). Previous
research on schools has shown that an array of formally designated leaders have a
hand in leading and managing schools, though their responsibilities differ depending
on their position (Camburn et al., 2003; Heller & Firestone, 1995; Spillane, 2006).
Camburn et al.’s (2003) previously discussed study of more than 100 U.S. elementary
schools found that responsibility for leadership functions was typically distributed
across three to seven formally designated leadership positions per elementary school.
Camburn et al. (2003) surveyed formally designated leaders in each school to exam-
ine the distribution of responsibility for leadership functions. Such positions in-
cluded principals, assistant principals, program coordinators or facilitators, subject
area coordinators or facilitators, mentors, master teachers, teacher consultants, and
other auxiliary professional staff such as family outreach workers.
In acknowledging that an array of formally designated leaders may have a hand in
the work of leading and managing, the practice aspect of a distributed perspective
presses us to consider this team of leaders not only in the aggregate, but also in
interaction with each other and with the rest of the organization. We consider the
formally designated leadership team from three perspectives, suggesting three dif-
ferent study operations and specifying measures for each operation: the relative size
of the team of formally designated leaders, the extent to which occupants of a par-
ticular position have a focused role, and the diversity of the leadership team. The SSQ
included items about formally designated leadership positions, time use, and respon-
sibilities. We identified these other formally designated leaders by a survey item
asking whether the respondent holds a formally designated leadership position.
School staff were also asked to indicate their appointment and teaching responsibil-
⅐
9. ities, which allowed us to differentiate formally designated leaders whose primary
responsibility was classroom teaching from those whose primary responsibility was
leading and managing. We use the term full-time formally designated leader to refer to
those formally designated leaders who were not the primary instructor for any classes
during a typical school day, signaling that administration rather than teaching was
their primary responsibility.
Leader to staff ratio. The sheer number of formally designated leaders in a school
is likely in part a function of school size; as schools vary tremendously in terms of
size, we do not simply want to know how many leaders are in a school. Hence, a more
descriptive measure of the number of formal leaders in a school might be the ratio of
formally designated leaders to school staff. Using a ratio instead of a net count pro-
vides more information about the prevalence of formally designated leaders relative
to staff without a leadership designation. We consider a number of different mea-
sures including full-time and part-time formally designated leaders to school staff.
Our rationale here is relatively simple: there is likely to be more support available to
teachers when there are more formally designated leaders available to school staff.
Approximately 30% of elementary school respondents reported having a formally
designated leadership role in their school.2
Table 2 shows that, including the school
principal, the average school in our sample had approximately 12 formally designated
leaders, though the number of formally designated leaders ranged from 5 to 17. As
discussed previously, the number of formally designated leaders is largely driven by
school size (Pearson’s correlation ϭ .641, p Ͻ .001), so the ratio of formal leaders to
all other staff may provide more information about the distribution of formally
designated leadership positions among elementary schools.
Our analysis suggests substantial between-school variation in the number of for-
mally designated leaders for each staff member. As displayed in Table 2, the formally
designated leader to all other staff ratio ranged from 1:6.4 to 1:1.4.3
We focus on the
formally designated leader to other staff ratio, rather than the leader to student ratio,
because most of the work on the effects of school leadership and management on
student achievement suggests an indirect relationship mediated by school and class-
room conditions. This suggests substantial differences between schools in terms of
the number of formally designated leaders available to offer guidance and support to
Table 2. Formally Designated Leaders per School (n ϭ 30)
Variable Mean SD Min Max
Number of staff per school with a formally designated leadership
role 12.20 2.98 5.00 17.00
Percent of staff with a formally designated leadership role 30.15 6.44 13.51 41.67
Ratio of formally designated leaders to all other staff .44 .13 .16 .71
Number of staff with a full-time formally designated leadership
role 4.77 1.63 2.00 8.00
Percent of staff with a full-time formally designated leadership
role 11.68 3.49 5.41 18.92
Ratio of full-time formally designated leaders to all other staff .13 .05 .06 .23
Percent of formally designated leaders that are full-time leaders 39.82 13.05 20.00 80.00
Full-time formally designated leaders with just one leadership
role 2.27 1.09 1.00 4.00
Number of roles reported by full-time formally designated
leaders with multiple roles 4.14 1.48 2.00 8.50
⅐
10. other school staff, who are mostly classroom teachers with no formal leadership
designation. Indeed, aside from the principal, the vast majority of formally desig-
nated leaders (89%) reported engaging in activities that support classroom instruc-
tion as part of their leadership role. These activities included practices such as mod-
eling instructional practices, discussing student work and standardized test results,
and monitoring classroom instruction. At one school, at least in theory, there was a
formally designated school leader to provide support for practically every other staff
member, whereas in another school each formally designated school leader had to
support six other staff members. Ignoring how these formally designated leaders
were assigned or their capacity to support staff, the level of support from formally
designated leaders, as measured in terms of their numbers relative to other staff
members, suggests tremendous variation between schools. Still, it is important to
take into account that the schools with the lowest leader to staff ratios serve the most
challenging student populations (e.g., Title I students), so that the low ratio of for-
mally designated leaders to other staff may be consumed in working directly with
students and addressing the extra demands placed on classroom teachers in these
schools.
To illustrate these differences, consider three schools in our study. Demographic
information about each school is shown in Table 3.4
Taylor Elementary School5
served 530 students in the 2004–2005 school year, roughly 38% of whom received free
or reduced-price lunch. Roughly half of the students were Caucasian and half were
African American, though there were a few Hispanic students. The school had 39 staff
members, and the principal was in his sixth year as a principal in the district with all
6 years having been spent at Taylor. Hancock Elementary School had 459 students
and 38 staff members, including the principal who was in her second year as principal
at the school, though she had 10 years of experience as a principal in the district. Over
90% of the students were African American and nearly 70% of the students received
free or reduced-price lunch. At Chase Elementary School, there were 587 students
and 53 staff members. The principal had 16 years of experience as a principal in the
district, 5 years of which occurred at Chase. Approximately 70% of the students were
African American, while 20% were Caucasian, and nearly 60% of the students re-
ceived free or reduced-price lunch.
There were substantial differences in the ratio of formally designated leaders to all
other staff at these three schools. With a ratio of 1:1.5, Taylor School had one formally
designated leader for roughly every 1.5 staff members. These formally designated
leaders included the principal, an assistant principal, three reading/language arts
coordinators and multiple whole school reform coaches, special program (i.e., Title
I) coordinators, school improvement coordinators, mentor teachers, and teacher
Table 3. Case Study School Characteristics for the 2004–2005 Academic Year
Variable Taylor Hancock Chase
Number of students 530 459 587
Number of faculty members 39 38 53
Free or reduced-price lunch eligible students (%) 38.1 69.9 58.9
Caucasian students (%) 44.3 4.6 20.3
African American students (%) 47.6 91.3 69.5
Hispanic students (%) 1.1 .7 3.1
Years principal has been principal at the school 6 2 5
⅐
11. consultants. No respondents from Taylor reported being math coordinators. With a
ratio of 1:2.2, Hancock School had one formally designated leader for roughly every
two staff members. These formally designated leaders included the principal, three
assistant principals (each of whom reported additional leadership roles), three read-
ing/language arts coordinators, one math coordinator, and multiple whole school
reform coaches, special program coordinators, school improvement coordinators,
mentor teachers, and teacher consultants. With a ratio of 1:3.2, Chase School had a
high formally designated leader to staff ratio with one formally designated leader for
every three staff members. The 12 formally designated leaders at Chase included the
principal, one assistant principal, one math coordinator, and several mentor teachers
and school improvement coaches. No one who responded to the survey from Chase
indicated being a reading/language arts coordinator. Looking across these three
schools we see that, in theory, a formally designated leader at Chase would have twice
as many staff to support compared to a formally designated leader at Taylor. We
acknowledge that these comparisons are based on a number of assumptions that may
not hold in practice, including the fact that other staff members are evenly distrib-
uted among formally designated leaders.
Across the 30 sample schools, we found that over half of the schools have a for-
mally designated leader to school staff ratio between .3 and .5, that is, ranging from
one formally designated leader for every two staff members to one for every three
staff members. Almost one-third of the schools (nine schools) in our sample had
ratios greater than .5, indicating that there was at least one formally designated leader
for every two staff members.
The ratio of formally designated leaders to other staff may inflate the level of
support available to staff from formally designated leaders because many of the
people holding these positions in our study were also classroom teachers. Having a
formally designated leadership position while also working as a classroom teacher
very likely constrains the time and effort leaders devote to supporting their col-
leagues. Moreover, we suspect that for most of these individuals their own classroom
teaching may take priority over their leadership and management responsibilities.
Hence, we consider another measure: the ratio of full-time formally designated lead-
ers to school staff. Defining full-time formally designated leaders as those who are
not the primary instructor for any class during a typical day and who reported having
at least one formally designated position, we found that approximately 39% of for-
mally designated leaders are full-time leaders, indicating that 60% of formally
designated leaders also had at least one classroom teaching assignment. Table 2
shows that, including the school principal, the average number of full-time formally
designated leaders per school was 4.8, with 11.7% of the professional staff having a
full-time formally designated leadership position.
Looking across the 30 elementary schools, the percentage of school staff with a
full-time formally designated leadership position ranged from 5% to 19%. The full-
time formally designated leader to all other staff (including other formally desig-
nated leaders who are not full time) ratio then ranged from roughly 1:17.5 to 1:4.3. In
other words, while one school had approximately one full-time formally designated
leader for every four staff members, other schools had approximately one full-time
formally designated leader for every 18 staff members, resulting in staff in one school
having more than four times as much support, in terms of full-time leaders, than staff
in another school. Whether or not these differences in staff assignments resulted in
⅐
12. corresponding differences in terms of leadership practice, though important, is be-
yond the scope of this article and our data.
To illustrate these differences, consider our three case schools. With a ratio of
1:4.3, Taylor had one full-time formally designated leader for roughly every four staff
members. These full-time formally designated leaders included the principal, an
assistant principal, one reading/language arts coordinator and multiple whole school
reform coaches, special program coordinators, school improvement coordinators,
mentor teachers, and teacher consultants. With a ratio of 1:6.6, Hancock was near the
middle of the distribution, with one full-time formally designated leader for roughly
every seven staff members. These full-time formally designated leaders included the
principal and three assistant principals, one reading/language arts coordinator, one
math coordinator, one special program coordinator, and multiple whole school re-
form coaches, school improvement coordinators, mentor teachers, and teacher con-
sultants. With a ratio of 1:9, Chase had a high leader to staff ratio, with one full-time
formally designated leader for every nine staff members. The five full-time formally
designated leaders at Chase included the principal and assistant principal, and one
special program coordinator, whole school reform coach, and school improvement
coordinator. There were no full-time reading/language arts or math coordinators,
full-time mentor teachers, or teacher consultants at Chase. Full-time leaders at Chase
had more than twice as many staff to support compared with their counterparts at
Taylor. Other things being equal, staff at Chase had fewer resources in terms of
full-time school leaders.
As one might expect, the full-time formally designated leader to school staff ratio
provides a more realistic measure of the amount of support available to staff from the
team of formally designated school leaders because it takes into account whether the
formally designated leaders are chiefly responsible for leadership and management
positions or a classroom teaching position. However, recognizing the formal orga-
nization as represented in formal positions is not a mirror image of the informal or
lived organization, we should interpret these measures cautiously. Examining the
distribution of our 30 elementary schools in terms of the ratio of full-time formally
designated leader to other staff ratio, we see that the modal ratio is .09, or roughly one
full-time formally designated leader for every 10 other staff members. Again, this
measure varied considerably across these 30 schools.
Position focus. The ratio of formally designated leaders to school staff is one way
of operationalizing leadership and management from a distributed perspective. An-
other dimension that merits attention concerns the extent to which those who oc-
cupy formally designated positions are focused on a single leadership position or
have their time divided among multiple positions that have potentially competing
responsibilities. We might label this as position focus. Another way to operationalize
position focus is to consider the extent to which occupants of formally designated
leadership positions report that their leadership and management responsibilities
are concentrated in a particular set of functions or dispersed across multiple func-
tions. For example, whereas the work of some formally designated leaders might be
dispersed across leading and managing instruction and dealing with the external
environment, others might only be focused on leading and managing instruction
(Camburn et al., 2003). We describe below both formally designated leaders who
have just one leadership designation and those with multiple designations.
We first consider the degree to which individual formally designated leaders in a
⅐
13. school report holding a single position such as assistant principal or mentor teacher.
It is possible that the more a formally designated leader’s work is focused in a single
position, the more likely it is that he or she will effectively and efficiently perform that
position in that the single designation allows for greater focus. Furthermore, holding
just one formally designated leadership position may reduce the potential for role
conflict, which is heightened when an individual occupies multiple positions simul-
taneously. Of course, one might also argue that an individual who holds multiple
formally designated leadership positions can understand the work of leading and
managing school improvement from a variety of perspectives, which has potential
advantages in terms of creating a more coherent improvement effort.
Of the 143 full-time formally designated leaders,6
half indicated that they were
assigned to just one formally designated leadership position with the other half re-
porting multiple leadership positions.7
Among the full-time leaders indicating mul-
tiple positions, the mean number of formally designated leadership positions by
school was 4.1. The extent to which full-time formally designated leaders held mul-
tiple leadership positions varied widely across the 30 schools. At two schools, none of
the full-time formally designated leaders held multiple positions. At the same time, at
18 schools, at least half of the full-time formally designated leaders reported multiple
positions. For example, at Taylor, the assistant principal also reported acting as the
special program coordinator, whole school reform coach, school improvement co-
ordinator, and teacher consultant. Occupying multiple positions, Taylor’s assistant
principal may be torn about which positions to give her or his primary allegiance and
effort. Furthermore, to the extent that the responsibilities associated with any of
these positions conflict, this assistant principal may experience role conflict. To the
extent that the position of assistant principal may involve some component of eval-
uating teachers’ classroom practice, it may conflict with the responsibilities associ-
ated with the position of teacher consultant, for which having an open and frank
exchange with teachers is critical. More specifically, teachers at Taylor may be slow to
seek help about instructional challenges from a teacher consultant who also evaluates
them in the position of assistant principal. Similarly, each of the three assistant
principals at Hancock reported at least two additional leadership positions, includ-
ing reading/language arts coordinator, math coordinator, special program coordi-
nator, whole school reform coach, school improvement coordinator, mentor
teacher, and teacher consultant. At Chase, the school improvement coordinator and
one of the subject area coordinators had no other formal leadership designations.
Formally designated leadership team diversity. Turning our attention to the
interactions among formally designated leaders, we examine the composition of the
team that does the work of leading and managing to better understand how charac-
teristics of team members might matter to their productivity. There is considerable,
if somewhat inconclusive, literature on team diversity that indicates diversity in areas
such as gender, race, and experience hinders some aspects of group performance
while promoting other aspects. In school leadership teams, diversity may help teams
overcome coordination and motivation losses that could plague homogenous teams
as they pursue school improvement efforts. A study of Chicago schools illustrates the
motivation losses that can be associated with leadership-team homogeneity. In sev-
eral schools in the study, a core group of senior faculty created obstacles to school
reform because they had come to accept the school’s dysfunctional conditions and
were disinclined to make changes (Bryk, Easton, Kerbow, Rollow, & Sebring, 1993).
⅐
14. In this way, homogeneity can serve as an obstacle to progress. Diversity can enhance
the performance of school leadership teams if it increases the innovation and open-
ness to change that are necessary for school improvement (McLeod & Lobel, 1992;
Watson, Kumar, & Michaelsen, 1993). However, diversity can also contribute to
conflict and lower levels of trust among group members (Brewer, 1979; De Dreu &
Weingart, 2003; Tajfel & Turner, 1986).
Diversity research has principally focused on relating surface-level or social-
category differences among team members (e.g., age, gender, and tenure) to group
performance (Harrison, Price, & Bell, 1998; Pelled, 1996). Given the tendency for
individuals to prefer interactions with similar others, it is not surprising that social-
category diversity has been associated with increased conflict in groups (Jehn, 1995).
Gender diversity is an especially interesting variable in educational studies, as the
workforce in schools is predominantly female—unlike most organizations in tradi-
tional diversity field studies. Gender diversity has generally been associated with
decreased group performance, though its effect is especially pronounced for males
(Williams & O’Reilly, 1998). While administrators are more likely than teachers to be
male, there is evidence that both teachers and school leadership personnel are be-
coming increasingly diverse in terms of both race and gender (Loeb & Reininger,
2004). A recent study by the RAND Corporation (RAND Education, 2004) found
that women make up an increasing proportion of school administrators, and racial
minorities are better represented in administrative ranks than among teachers.
Racial diversity has received less attention in organizational demography re-
search, possibly because such little racial and ethnic diversity exists in the organiza-
tions that have been studied (Williams & O’Reilly, 1998). Though several studies have
linked racial diversity to increased creativity (McLeod & Lobel, 1992; O’Reilly, Wil-
liams, & Barsade, 1998; Watson et al., 1993), others have found null to negative effects
on group performance (Pelled, Eisenhardt, & Xin, 1999) and individual commitment
(Tsui, Egan, & O’Reilly, 1992). Functional background diversity, in terms of educa-
tional attainment and work experience, is believed to increase the range of informa-
tion available to groups and improve their decision-making abilities (Jackson, 1992).
Homogeneity in tenure is believed to promote communication and cohesion (Pfef-
fer, 1985), and while tenure diversity has been associated with increased conflict, its
effect on performance is more complicated, albeit generally negative (Williams &
O’Reilly, 1998).
We consider the diversity of the formally designated leadership team, looking at sev-
eral measures of team diversity. For categorical variables such as gender and race, the
diversity index (also known as the entropy index or Shannon index) is appropriate to
measure diversity within a group (Teachman, 1980). The diversity index is equal to
Ϫ⌺ PklogPk where Pk is the proportion of the group in the kth category (Teachman,
1980). Higher diversity indexes reflect greater heterogeneity within the group on that
attribute. Using categories and self-reported data from the SSQ and PQ, diver-
sity indexes were computed based on the leadership teams’ gender (male or female),
race (Hispanic, African American, Caucasian, Asian/Pacific Islander, American In-
dian, biracial/multiethnic, or other), and graduate degree attainment (presence or
absence).
For continuous variables, the coefficient of variation is the appropriate measure of
group diversity. The coefficient of variation is calculated by dividing the standard
deviation by the mean. Like the diversity index, a higher coefficient of variation
⅐
15. indicates greater heterogeneity on the team regarding that attribute. The coefficient
of variation was calculated for the tenure measure and indicates variation in the
number of years of teaching experience held by staff members and the principal as
indicated on the SSQ or PQ, respectively.
Diversity indexes and coefficients of variation are displayed in Table 4. A Spear-
man rank correlation test is not significant, indicating that there is not a tendency for
schools that are more diverse in one index to be more diverse in another. While it is
not meaningful to compare the values of the various diversity measures with one
another, looking across schools we find considerable variation with respect to the
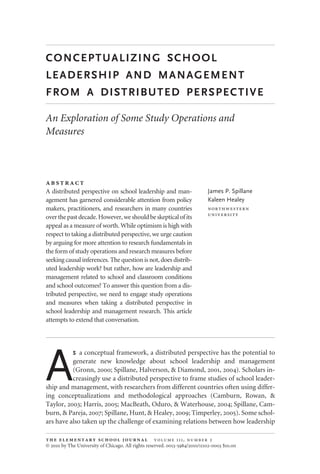
diversity of their leadership teams. Figure 1 compares the diversity of gender, race,
and teaching experience for the three case schools with that of the mean of each
measure across all schools. Taylor and Chase had coefficients of variation in teaching
experience of .63 and .69, respectively, indicating greater diversity in terms of years of
Table 4. Formally Designated Leadership Team Diversity by
School (n ϭ 30)
Variable Mean SD Min Max
Gender .11 .08 .00 .29
Race .36 .11 .09 .58
Education .17 .10 .00 .29
Teaching experience .52 .11 .33 .72
Experience in role at school .68 .22 .27 1.36
Experience in role in district .64 .16 .41 1.08
Figure 1. Diversity of formally designated leaders by school.
⅐
16. teaching experience than Hancock, which had a coefficient of variation of .40. The
mean coefficient of variation for teaching experience was .52 for the 30 schools in our
study. To put this in more concrete terms, Taylor and Chase had formally designated
leaders with between 3 and 34 years of teaching experience, with concentrations of
leaders at several points in the distribution. In contrast, 8 of the 12 formally desig-
nated leaders at Hancock had 24 or more years of teaching experience.
With regard to the racial diversity measures, the leadership team at Hancock was
more diverse in terms of race than Taylor or Chase’s leadership teams. Hancock had
a racial diversity index of .58, with three African American formal leaders, four Cau-
casian formal leaders, and three formal leaders who reported being multiethnic or
other. This contrasts with Chase, where there was one African American formal
leader and 11 Caucasian formal leaders, resulting in a racial diversity index of .28.
Taylor School had a racial diversity index of .43, which included 12 formally desig-
nated leaders who were Caucasian, two who were African American, one who was
Asian, and six who were multiethnic or other.
Of our three diversity indexes, there was less variation in terms of gender, though
at Chase, there was no gender diversity on the formally designated leadership team as
all of the leaders were women. The homogeneity of the leadership team at Chase with
respect to gender is captured by a diversity index of .0, whereas the diversity indexes
for gender at Taylor and Hancock were .22 and .13, respectively. Our cases and mean
values, however, disguise some interesting variation between schools. For example,
in eight schools, the formal leadership team was composed solely of females (as
reflected in their diversity index of .0). This might be expected considering that 94%
of elementary school staff in our sample were female.
Strengths and limitations. While our range of measures pick up variation across
the 30 elementary schools, we also have to consider the strengths of these measures
and identify limitations. As we stressed at the outset, our work is exploratory and our
dataset is limited with respect to allowing us to consider the validity and reliability of
our measures. Still, in this section we reflect on the strengths and limitations of our
particular study operations and measures of the formal school organization.
One check on our ratios of formally designated leaders to other school staff can be
determined by examining how these ratios are correlated with the school’s status as
a Title I school. The Title I Schoolwide Program is available to schools in which more
than 40% of the students receive free or reduced-price lunch (No Child Left Behind
Act of 2001, 2002), though funding is limited, so not all schools that meet the eligi-
bility requirements receive funding. Title I schools often use the funds to hire addi-
tional staff, such as a reading specialist, to support their students’ learning needs.
Therefore, we would expect Title I schools to have a smaller formally designated
leader to staff ratio, especially for full-time formally designated leaders. While the
number of formally designated leaders, full time or otherwise, is not related to a
school’s Title I status, the ratio of full-time formally designated leaders is significantly
lower in Title I schools (Title I schools ϭ .15, non–Title I schools ϭ .11, p Ͻ .05). On
average, the Title I schools in our sample were likely to have one full-time formally
designated leader for every six staff members, whereas non–Title I schools were likely
to have one full-time formally designated leader for every nine staff members.
One limitation of our ratios is that we rely on survey responses to calculate all
other staff rather than administrative records from the school district. Hence, our
measure is potentially influenced by response rates from particular schools. While
⅐
17. the overall response rate to the survey for elementary schools was 89%, this ranged
from a high of 98% to a low of 66% depending on the school. To check whether the
response rate had influenced our ratios, we examined the correlation between the
school response rate and the two ratios. We found no correlation between response
rate and the ratios of formally designated leaders to all other staff and full-time
formally designated leaders to all other staff. However, to avoid potentially mislead-
ing results, especially with response rates that are not as high as those obtained in the
study reported here, future work might combine administrative records with survey
data to calculate the formally designated school leader to staff ratios. Indeed, the
leader to staff ratio could be influenced tremendously by having one formally desig-
nated school leader not respond to the survey.
We acknowledge that the ratios we describe provide a basic measure of the level of
support available to school staff from formally designated school leaders. At the same
time, we believe that the amount of support available to staff in terms of people and
their time is important. Furthermore, combining these ratios with other measures
such as the knowledge or expertise of formally designated leaders and/or the level of
agreement among formally designated leaders vis-a`-vis the school’s instructional
program can provide a more accurate assessment of the level of support from for-
mally designated leaders.
Our indexes of diversity have at least two limitations that might be redressed in future
work. Much of the work on team diversity is based on research that examines the per-
formance of teams that work together on a project or decision-making task. Our data do
notallowustoidentifywhichoftheformallydesignatedleadersinaschoolactuallywork
togetherinperformingleadershipandmanagementtasks.Insomerespects,weassumea
team when a team may not exist in the strict sense of that term, that is, a group of people
working together on a particular task. For example, it may be that the reading/language
artscoordinator,coaches,andsomementorteachersinaparticularschoolendupwork-
ing together on teacher professional development while the principal and assistant prin-
cipalarenotintegrallyinvolvedinthatwork.Hence,therelevantdiversityindexesmight
be better measured based on different subgroups of the team of formally designated
leaders.Futureworkmightaskformallydesignatedschoolleaderswhomtheyworkwith
most in performing leadership and management tasks. Second, our measures incorpo-
rate only surface-level or social-category characteristics. In contrast, deep-level diversity
reflects the differences in attitudes, beliefs, and values held by group members (Harrison
et al., 1998). Over time, the effects of surface-level diversity on team outcomes weakens
while the effects of deep-level diversity are strengthened, suggesting that team members
who have worked together for extended periods of time may be affected more by differ-
ences in beliefs and values than by difference in race or gender (Harrison et al., 1998).
Heterogeneityinvalueshasbeenassociatedwithincreasedtaskconflict,processconflict,
and relationship conflict in work groups (Jehn, Northcraft, & Neale, 1999). Diversity in
perspectives about the group’s goal or mission has also been shown to decrease group
membersatisfactionandcommitment(Jehnetal.,1999)aswellasorganizationalperfor-
mance(Ostroff,1992).Withthesestudiesinmind,futureworkshouldconsidertheeffect
of deep-level diversity among school leaders.
Another limitation of our data set with respect to exploring aspects of the formally
designated leadership team in schools is that we have no direct measures of how
teachers rate members of the formally designated leadership team, aside from the
school principal. While some items on the SSQ ask about interactions with teacher
⅐
18. leaders, it is unclear if respondents considered only teacher leaders with formally
designated leadership positions. Nearly all of the other items on the SSQ that per-
tained to leadership and management asked about the school principal, ignoring
other formally designated leaders. Considering the numbers of other formally des-
ignated leaders (both part time and full time) in the schools in the current study,
future work should supplement survey questions that focus on the school principal
with questions that attempt to focus, from the perspective of school staff, on the work
of these other formally designated leaders. Such work would enable us to examine
various issues including the extent to which other formally designated leaders can
compensate for principals who are relatively weak on various measures thought
critical for school improvement. Indeed, such measures would also allow us to parse
out the value added by other formally designated leaders to the work of principals
who score high on various measures of leadership and management.
Factoring in the Informal Organization
As noted earlier, a distributed perspective presses us to attend to both the formal
and informal organization while considering the relationship between the two. An
exclusive reliance on formally designated leaders and their accounts is limiting (Spil-
lane, Camburn, Pustejovsky, Pareja, & Lewis, 2008; Spillane et al., 2009). Studies that
look beyond those individuals in formally designated leadership positions show that
teachers with no formal leadership designations also perform key leadership and
management functions (Heller & Firestone, 1995; Spillane, 2006; Spillane et al., 2007;
Spillane & Diamond, 2007). Defining leadership as a set of organizational functions
rather than tying leadership to a particular administrative position, Heller and Fire-
stone (1995) found in a study of eight elementary schools that multiple individuals
were taking responsibility for the work of leading and managing the schoolhouse. In
other words, in order to fully understand how the work of leadership and manage-
ment is arranged in schools, we have to take into account individuals who exercise
leadership or management but who do not have a formally designated leadership
position.
Perhaps more important than the number of individuals who perform leadership
functions without a formal leadership designation, we want to know something about
the relationship between formal and informal leaders in the schoolhouse and perhaps
something about the composition of the formal-informal leadership team. Hence, we
consider three ways to conceptualize and operationalize the relationship between the
formalandinformalorganization.First,weexaminetheratioofformal-informalleaders
to school staff. Second, we consider the diversity of the formal-informal leadership team
and the extent to which informal leaders may help compensate for or exacerbate the
lack of diversity in the formal leadership team. Third, we consider what we term the
congruence of the formal-informal organization in terms of who takes responsibility
for leading and managing in the schoolhouse. We take up the operationalization and
measurement of each of these perspectives separately, first justifying and motivating
each before defining measures and considering what sort of variation they pick up in
the schools in our study.
Leader to staff ratio reconsidered. Tapping into the informal organization and
examining relations between the formal and informal is essential when taking a
distributed perspective to the study of school leadership and management. Opera-
⅐
19. tionalizations that tap into the informal organization suggest that when studying the
distribution of responsibility for leadership and management, it is important to
attend to school staff with no formal leadership designations. Confining our focus to
leading and managing instruction in mathematics and reading/language arts—the
two subjects that consume the bulk of the elementary school curriculum—we get a
sense of the role of informal leaders in school leadership and management.
Two items on the 2005 SSQ ask teachers to name up to seven people in their school
to whom they go for advice about their mathematics and reading/language arts
instruction. For the purpose of this analysis, we consider individuals who are sought
out for advice by at least three of their colleagues to be key advice givers in their
school. We use the term informal leader to describe key advice givers who do not
have a formally designated leadership position but do have the opportunity to exer-
cise leadership by virtue of others seeking them out for advice. Using these criteria,
we identify a total of 92 informal leaders, including 53 informal math leaders and 59
informal reading/language arts leaders out of our sample of 1,240 people (some
individuals were informal leaders in both math and reading/language arts).
Table 5 shows that across the 30 schools, the mean number of informal leaders was
2.0 for reading/language arts and 1.8 for mathematics. On average, 4.4% of school
staffers were identified as informal leaders in reading/language arts and 3.9% were
identified as informal leaders in mathematics. The percentage of staff identified as
leaders ranged from 0% to 13% of the school staff in mathematics and from 0% to
14% in reading/language arts depending on the school.8
There was tremendous vari-
ation between schools, ranging from 0 to 10 informal leaders for reading/language
arts and from 0 to 9 informal leaders for mathematics. At Taylor, for example, two
informal leaders were identified, one in reading/language arts and one in math. At
Hancock, we identified six informal leaders, five in math and one in reading/lan-
guage arts. At Chase, three informal leaders were identified, including one each for
reading/language arts and math, and one individual who was an informal leader in
both reading/language arts and math.
The ratio of all leaders (both formal and informal) to all other staff also suggests
tremendous variation across schools, ranging from a low of 1 to 3.5 to a high of 1 to .9.
This indicates that at one school, there is one leader for roughly every 3.5 staff mem-
bers, while at another school there are actually more leaders than other staff. The
frequency distribution for the ratio of all leaders to other staff reveals that eight
schools (including Taylor and Hancock) have ratios of at least .80, indicating that
there is nearly one leader for every other staff member.
To develop a better understanding of these ratios, especially the situations in
which school leaders equal or even outnumber other staff, a closer look at the three
Table 5. Informal Leaders per School (n ϭ 30)
Variable Mean SD Min Max
Informal leaders 3.07 2.90 0 14.00
Percent of staff that are informal leaders 6.87 5.27 0 19.72
Informal math leaders 1.77 1.94 0 9.00
Percent of staff that are informal math leaders 3.89 3.71 0 13.16
Informal reading/language arts leaders 1.97 1.96 0 10.00
Percent of staff that are informal reading/language arts leaders 4.35 3.28 0 14.08
Ratio of formal and informal leaders to all other staff .64 .20 .29 1.10
⅐
20. case schools is helpful. Furthermore, the analytical distinction between organic and
mechanistic organizational arrangements may also be necessary (Rowan, 1990,
2002a, 2002b). Whereas mechanistic arrangements include centralized decision
making, clearly defined positions, and hierarchical relations, organic arrangements
involve staff in decision-making processes and cooperative relationships (Miller &
Rowan, 2006). While it is tempting to view schools where leaders almost equal or
even outnumber other staff as more organic and less mechanistic, our case schools
suggest that this may not always be the case. At Taylor the ratio of leaders to other
staff was 1:1.1, but much of this was accounted for by a relatively low ratio of formally
designated leaders to other staff. Indeed, only two informal leaders emerged at Tay-
lor. At Hancock Elementary School, which was near the median in the distribution of
formally designated leaders to other staff ratios, six informal leaders were identified
to produce an overall leader to other staff ratio of 1:1.1. Hancock had a similar ratio of
leaders to other staff as Taylor, but while Taylor’s leadership was primarily composed
of formally designated leaders, informal leaders made up one-third of Hancock’s
leadership team. Including Hancock, five schools in our sample had leadership teams
for which informal leaders made up one-third or more of the team. Only three
informal leaders were identified at Chase, whose formally designated leader to other
staff ratio was among the highest in the sample, with a 1:2.3 ratio of leaders to all other
staff.
Leadership team diversity: Compensation. It may be the case that a lack of di-
versity among formally designated leaders is offset by diversity among the informal
leaders. However, comparing the diversity measures for formally designated leaders
(see Table 4) with those for all leaders (see Table 6) reveals that including the infor-
mal leadership actually reduced the leadership team’s diversity. Comparing Figures 1
and 2 illustrates that the most dramatic changes at the case study schools occurred for
the gender and racial diversity measures, and, indeed, these measures are signifi-
cantly lower than those that considered only the formally designated leaders.
Whereas the mean gender diversity index was .11 for formally designated leaders, it
was just .06 for all leaders, a difference that is significant at p Ͼ .01. The racial
diversity index was also significantly lower; the mean for formally designated leaders
was .36, and dropped to .22 when we incorporated the informal leaders.
Formal and informal congruence. Another issue concerns the alignment or
match between the formal and informal organization, what we term the formal-
informal organizational congruence. A distributed perspective presses us to explore
Table 6. Formally Designated and Informal Leadership Team
Diversity by School (n ϭ 30)
Variable Mean SD Min Max
Gender .06** .10 0 .28
Race .22*** .14 0 .55
Education .18 .12 0 .30
Teaching experience .49 .19 .02 .98
Experience in role at school .58* .25 .08 1.19
Experience in role in district .63 .19 .17 1.05
* Difference from formally designated leaders is significant at p Ͻ .05.
** Difference from formally designated leaders is significant at p Ͻ .01.
*** Difference from formally designated leaders is significant at p Ͻ .001.
⅐
21. relations between formal and informal aspects of the organization (Spillane & Dia-
mond, 2007). Relations between the formal and informal can inform our under-
standing of school leadership and its influence on valued school conditions and
outcomes. Formal and informal congruence is one attempt at capturing these rela-
tions by examining the match between formally designated leadership positions and
actual advice seeking on the ground. In general, we might expect that the greater the
congruence between the formal and the informal, the better for valued school con-
ditions and outcomes, though we suspect that this relationship is neither simple nor
linear. A near perfect match between the formal and informal may squelch contrary
opinions and undermine the emergence of new and potentially innovative ideas
from the schoolhouse floor. Furthermore, in situations where the formal leadership
and management arrangements are dysfunctional, informal leaders may be key
sources for change and innovation.
Overall, our analysis suggests that the formal and informal organization were not
closely aligned, with many formally designated subject area leaders not figuring as
prominently as one might expect in the advice networks for their school subjects.
Our operationalization of informal leadership is restricted to those who are sought
out for advice by three or more of their colleagues but do not hold a formally desig-
nated leadership position. To examine the extent to which the formal organization
reflects the organization as lived, we must consider all individuals who are sought out
for instructional advice, regardless of their leadership designation. We consider these
individuals who are sought out by three or more of their colleagues to be key advice
givers. Using this definition, we identified 177 individuals who are key advice givers,
Figure 2. Diversity of all leaders (formal and informal) by school.
⅐
22. including 102 key advice givers in mathematics and 113 in reading/language arts.9
Of
those individuals identified by school staff as the key advice givers in either mathe-
matics or reading/language arts, 48% had a formally designated leadership position,
whereas 52% held no such position. In other words, roughly half of the key advice
givers for mathematics or reading/language arts had no formal leadership designa-
tion. For example, at Taylor, five of the seven key advice givers held a formally
designated leadership position, and at Chase, three of the six key advice givers did so.
In contrast, at Hancock just three of the nine identified key advice givers held a
formally designated leadership position. In other words, while only a third of the key
advice givers at Hancock were formally designated leaders, half of key advice givers at
Chase were formally designated leaders, and nearly three-quarters of the key advice
givers were formally designated leaders at Taylor. Table 7 reveals that, on average,
schools had 3.8 key advice givers for reading/language arts and 3.4 for mathematics,
but this ranged from zero in several schools to 12 in another school for math and from
one in several schools to 11 in another school for reading/language arts. According to
these study operations and measures, principals and assistant principals do not play
a large role in leading mathematics and reading/language arts instruction. Only one
principal emerged as a key advice giver in mathematics, with two principals emerging
as key reading/language arts advice givers. Assistant principals were slightly more
prominent, with eight being identified as key math advice givers and six being iden-
tified as key reading/language arts advice givers. More striking is that only 37% of the
reading/language arts coordinators and 43% of the mathematics coordinators in our
sample were identified by school staff as key advice givers for reading/language arts
and mathematics, respectively. The proportion of reading/language arts and math
coordinators who were identified as key advice givers varied by school, with any-
where from all of the reading/language arts and math coordinators also serving as key
advice givers to none of them doing so.
There is considerable variation across schools in the proportion of formally des-
ignated leaders who are identified as key advice givers in either reading/language arts
or math. None of the formally designated leaders were identified as key advice givers
in two schools, while over 30% of the formally designated leaders were also key advice
givers in seven schools. This suggests that the congruence between the formal and
informal organization varies greatly by school.
We also considered a second measure of the congruence of the formal and infor-
Table 7. Key Advice Givers per School (n ϭ 30)
Variable Mean SD Min Max
Key advice givers 5.90 3.16 1.00 17.00
Percent of formally designated leaders that are key advice givers 2.83 1.39 0 5.00
Key math advice givers 3.40 2.40 0 12.00
Percent of formally designated leaders that are key math advice
givers 1.63 1.10 0 4.00
Key reading/language arts advice givers 3.77 2.21 1.00 11.00
Percent of formally designated leaders that are key reading/
language arts advice givers 1.80 1.16 0 5.00
Math advice seeking ties directed toward formally designated
leaders 44.37 18.43 8.82 90.00
Reading/language arts advice seeking ties directed toward
formally designated leaders 46.97 18.93 3.23 90.32
⅐
23. mal organization. Specifically, we examined what percentage of advice-seeking rela-
tions about mathematics and reading/language arts involved formally designated
leaders. This analysis avoids the arbitrary nature of our cutoff point of three people
seeking out an individual for advice. On average, 44% of all mathematics advice-
seeking relationships and 47% of all reading/language arts advice-seeking relation-
ships are directed toward formally designated leaders in any position. Full-time for-
mally designated leaders accounted for 24% of all reading/language arts ties and 14%
of all math ties. School principals accounted for 2% of all reading/language arts ties
and 3% of all math ties. One might expect that mathematics coordinators would play
a large role in the mathematics networks, but they account for only 15% of all advice
relationships. Similarly, reading/language arts coordinators account for only 17% of
advice relationships in the reading/language arts networks.
Our analysis suggests considerable variation across schools, with formally desig-
nated leaders figuring much more prominently in some schools than others in the
advice network as experienced by school staff. Formally designated leaders account
for between 9% and 90% of mathematics advice relations and from 3% to 90% of
reading/language arts advice relationships. For example, 60% of the reading/lan-
guage arts advice-seeking relations were directed toward formally designated leaders
at Taylor. In contrast, at Hancock, just 24% of the advice-seeking relations about
reading/language arts were directed to formally designated leaders. At Taylor, then,
the formal and informal organization were more closely aligned, or there was greater
formal-informal congruence, at least with respect to reading/language arts instruc-
tion, compared with Hancock.
We find a positive and significant correlation between our two measures of
formal-informal congruence: the proportion of formally designated leaders who are
also key advice givers and the proportion of advice-seeking ties directed toward
formally designated leaders. The correlation for reading/language arts is .55 (p Ͻ .01)
and the correlation for mathematics is .50 (p Ͻ .01). This suggests that while our
measures are related, they are capturing different aspects of the congruence between
the formal and informal organization. We also find that there is a strong correlation
between the proportion of reading/language arts ties and mathematics ties directed
toward formally designated leaders in a school (Pearson’s correlation ϭ .828, p Ͻ
.001). In other words, in schools in which formally designated leaders feature prom-
inently in reading/language arts advice relationships, formally designated leaders
also tend to feature prominently in mathematics advice relationships, and vice versa.
This suggests that there may be school norms regarding appropriate sources of ad-
vice or that relations between formal and informal aspects of the organization are
managed differently.
Strengths and limitations. Our measures of the informal organization and its
relation to the formal organization pick up considerable variation across the 30
elementary schools in our study. While our dataset has numerous restrictions with
respect to examining the goodness of our measures, we consider some issues with
respect to the strengths and weaknesses of our study operations and measures below.
To begin, the ratio of key advice givers to all other staff is positively associated with
deprivatized teacher practice (Pearson’s correlation ϭ .404, p Ͻ .05; see App. A for
items). This correlation is very interesting and sensible, suggesting that the more advice
available to staff, the more frequently teachers observe and provide feedback on each
others’instruction.Whilethecorrelationisnotlarge,itissignificant,andwesuspectthat
⅐
24. multiple factors, such as trust among teachers and a climate that is supportive of inno-
vation, influence the deprivatization of teaching practice in a school.
We also find a significant relationship between the ratio of all leaders—both for-
mal and informal—to other staff and the frequency of interactions around instruc-
tion that occur with the principal (Pearson’s correlation ϭ .586, p Ͻ .01; see App. A
for items). This is especially interesting and suggests that principals in schools with
more leaders available to each staff member engage in more frequent classroom
observations. Additional measures will be required to determine if the availability of
leaders frees up the principal’s time for instructional observation or if the more
frequent interaction with the principal drives teachers to seek out advice from their
colleagues more frequently, thereby potentially creating more informal leaders.
Again, future work might improve these study operations and measures of infor-
mal leadership and management arrangements and their relations to the formal
organization. To begin with, including some measures that allow for advice seeking
that goes beyond mathematics and reading/language arts to teaching and learning
more broadly, as well as other aspects of school life, will provide a more complete
picture of the informal organization. It may be the case in some schools that informal
leaders emerge in areas not directly tied to instruction, such as parent or community
involvement.
With its focus on instructional advice seeking, our data also limit the extent to
which we can consider formal-informal congruence, as it may be the case that the
position of some formally designated leaders is not intended to provide instructional
advice. For example, some formally designated leaders may provide administrative
support to classroom instruction by ordering materials or scheduling professional
development, but their position is not intended to serve as a source of instructional
expertise. A formally designated leader who serves as a key instructional advice
giver—even though that leader’s position is intended to serve other functions—
would actually be evidence of low formal-informal congruence, in that the organi-
zation as lived does not match the organization as designed. We also cannot speak to
the motivations or school conditions that drive informal leadership. Future work
should consider the extent to which informal leadership is a supplement to or a
rejection of the formal organization, as well as how the formal-informal congruence
relates to teacher perceptions of trust and support from their colleagues.
Discussion and Conclusion
A key challenge in using a distributed perspective to study leadership and manage-
ment involves developing study operations and measures that allow the framework
to be applied in research on school leadership and management. In taking a distrib-
uted perspective we have to develop study operations that allow us to describe and
examine constructs in our analytical framework. Study operations are important
because they influence the validity of the inferences we can make based on the data
we gather and analyze. For example, our operationalization of an aspect of a distrib-
uted framework (e.g., ratio of formally designated leaders to school staff) can fail to
adequately explicate that aspect, or can confound two or more aspects, and thereby
pose a threat to construct validity. Further, relying on a single operationalization
(i.e., mono-operational bias) or relying on a single method to gather data on a
particular study operation of a construct (i.e., mono-method bias) can similarly
⅐
25. threaten construct validity and call into question any inferences we can draw. We
have argued in this article for attention to the development of study operations and
measures when using a distributed perspective to frame investigations of school
leadership and management. Such attention is critical so as to minimize threats to
validity and reliability that might endanger any inferences we can make from the
data. A dialogue about study operations and measures is critical if a distributed
perspective is to have any chance of realizing its potential in scholarship on school
leadership and management.
Takingadistributedperspectiveinthisarticle,wehavefocusedinonstudyoperations
and measures related to the formal and informal dimensions of the school organization
andrelationsamongthem.Inarticulatingthesestudyoperationsweargueformorework
on study operations and measurement that will lay the groundwork for future empirical
work that can examine causal relations between these measures, school and classroom
conditions, and school outcomes. Some scholars bemoan the weak empirical knowledge
base on distributed leadership as they want solid empirical evidence with respect to
whether distributed leadership works or not. We argue that they are either asking the
wrongquestionorhaveoversimplifiedtheresearchquestion.Thisistobeexpectedinthe
current climate as we seek causal inferences and evidence of effectiveness, forgetting that
strong causal inferences depend in important part on solid study operations and reliable
and valid measures of the phenomena under investigation. Randomization or sophisti-
cated statistical techniques, though clearly crucial, do not compensate for poor study
operations or invalid and unreliable measures.
As any savvy researcher understands, it is troublesome and foolhardy to design
research to gauge the effectiveness of something that is weakly operationalized and
poorly measured, let alone to make strong causal inferences based on the data gen-
erated from the research. The research question is not whether distributed leadership
works—that is, whether it makes a difference with respect to valued school out-
comes—but rather, when taking a distributed perspective, do the research questions
center on how different school leadership and management arrangements or con-
figurations relate to valued school outcomes. To investigate these research questions
we have to start with serious work on study operations and measures of school
leadership and management when it is conceptualized from a distributed perspec-
tive. There is no escaping this essential step. Moreover, we have to be open as scholars
to engaging with our peers in the strengths and weaknesses of our study operations
and measures. Maybe then and over time we can amass a body of research that will
identify those dimensions of leadership and management that make a difference with
respect to school outcomes.
While we have focused our article on study operations and measures, we should
continue to be mindful of the challenge with respect to developing research instruments.
Furthermore,notexplicitlydiscussedinourtreatmentofstudyoperationsandmeasures
is the question of whom to ask about leadership and management arrangements. Our
study operations and measures focus chiefly, though not exclusively, on position and
behaviors. We asked school staff if they have a formally designated leadership position,
abouttheirresponsibilities,andabouttheiradvice-seekingbehaviorswithrespecttocore
school subjects. A key question in all of this concerns whom and what one asks about
leadership and management arrangements in schools in order to measure these arrange-
ments. While we think behaviors are critical, we also think that tapping into norms and
beliefs is equally important. Furthermore, we believe that triangulating data sources by
⅐
26. asking individuals in different positions (e.g., classroom teacher, formally designated
school leader) about school leadership and management is essential if we are to develop
reliable and valid measures.
Future theorizing about school leadership and management from a distributed
perspective would benefit greatly from careful attention to the development of study
operations and measures that could inform empirical research. Indeed, it might add
some discipline to the endeavor. We contend that an important step in theory build-
ing using a distributed perspective is the development of study operations grounded
in empirical work, both qualitative and quantitative, in real schools. The fruits of this
work will depend in large part on scholars’ willingness to have a frank dialogue about
one another’s study operations and measures.
Appendix A
Instructional Interaction Measures
Deprivatized Practice (␣ ϭ .836)
Number of cases ϭ 1,133
Number of items ϭ 4
(1 ϭ never; 2 ϭ a few times per year; 3 ϭ a few times per month; 4 ϭ 1–2 days per
week; 5 ϭ more than 2 days per week)
This school year, how often did you observe any of the following teach?—Another
classroom teacher
This school year, how often did the following observe you teach?—Another class-
room teacher
This school year, how often did the following give you feedback after observing you
teach?—Another classroom teacher
This school year, how often did any of the following review your students’ work?—
Another classroom teacher
Interaction with principal around instruction (␣ ϭ .720)
Number of cases ϭ 1,130
Number of items ϭ 5
(1 ϭ never; 2 ϭ a few times per year; 3 ϭ a few times per month; 4 ϭ 1–2 days per
week; 5 ϭ more than 2 days per week)
This school year, how often did you observe any of the following teach?—The
principal
This school year, how often did the following observe you teach?—The principal
This school year, how often did the following give you feedback after observing you
teach?—The principal
This school year, how often did you have in depth discussions about your teaching
with any of the following?—The principal
This school year, how often did any of the following review your students’ work?—
The principal
⅐
27. Notes
1. Although one principal in our sample did not respond to the questionnaire, he or she is
included in the analyses involving the number of formally designated leaders in that school.
2. This includes the school principal as a formally designated leader. Approximately 28% (336 of
1,210) of respondents who were not a school principal reported holding a formally designated
leadership position.
3. All other school staff includes all individuals who responded to the survey but did not indicate
that they held a formally designated leadership position. Not included in the SSQ sample are art,
music, and computer teachers; paraprofessionals; administrative secretaries and clerks; social
workers; psychologists; and food-service workers.
4. Response rates for the sample schools were 92% for Taylor, 97% for Hancock, and 92% for
Chase.
5. All school names are pseudonyms.
6. Three individuals did not respond to the item regarding the formally designated leadership
positions they held.
7. Principals are assumed to have just one leadership position.
8. We need to point out two limitations with respect to operationalizing leadership using social
network data. First, we define leadership for mathematics and language arts as a social influence
interaction specifically related to advice and information giving. While our validity work on the
instrument suggests that school staff do see advice and information giving as leadership (Pitts &
Spillane, 2009; Spillane & Zuberi, 2009), it is not the only form, as leadership may also occur
through noninteractional means such as modeling behavior or providing resources. Second, as
noted earlier, the social network questions in the SSQ focused exclusively on mathematics and
reading and therefore are unlikely to pick up on social influence interactions that are subject-
matter neutral or generic (e.g., classroom management, student discipline). Hence, we urge cau-
tion in interpreting these findings as they are premised on a number of assumptions.
9. Some individuals were key advice givers in both reading/language arts and math.
References
Bidwell, C. E., & Yasumoto, J. Y. (1999). The collegial focus: Teaching fields, collegial relationships,
and instructional practice in American high schools. Sociology of Education, 72(4), 234–256.
Brewer, M. B. (1979). In-group bias in the minimal intergroup situation: A cognitive-motivational
analysis. Psychological Bulletin, 86(2), 307–324.
Bryk, A. S., Easton, J. Q., Kerbow, D., Rollow, S., & Sebring, P. (1993). A view from the elementary
schools: The state of reform in Chicago. Chicago: Consortium on Chicago School Research.
Camburn, E., Rowan, B., & Taylor, J. E. (2003). Distributed leadership in schools: The case of
elementary schools adopting comprehensive school reform models. Educational Evaluation and
Policy Analysis, 25(4), 347–373.
Camburn, E., Spillane, J. P., & Sebastian, J. (2010). Investigating the validity of a daily log and its
utility for assessing the impact of programs on principals. Manuscript submitted for publication.
Dalton, M. (1959). Men who manage: Fusions of feeling and theory in administration. New York:
Wiley.
De Dreu, C. K. W., & Weingart, L. R. (2003). Task versus relationship conflict: A meta-analysis.
Journal of Applied Psychology, 88, 741–749.
Downs, A. (1967). Inside bureaucracy. Boston: Little, Brown.
Gronn, P. (2000). Distributed properties: A new architecture for leadership. Educational Manage-
ment Administration Leadership, 28(3), 317–338.
Gronn, P. (2002). Distributed leadership as a unit of analysis. Leadership Quarterly, 13(4), 423–451.
Gronn, P. (2003). Leadership: Who needs it? School Leadership and Management, 23(3), 267–290.
Harris, A. (2005). Leading or misleading? Distributed leadership and school improvement. Journal
of Curriculum Studies, 37(3), 255–265.
⅐
28. Harrison, D. A., Price, K. H., & Bell, M. P. (1998). Beyond relational demography: Time and the
effects of surface- and deep-level diversity on work group cohesion. Academy of Management
Journal, 41(1), 96–107.
Heck, R. H., & Hallinger, P. (2009). Assessing the contribution of distributed leadership to school
improvement and growth in math achievement. American Educational Research Journal, 46(3),
659–689.
Heifetz, R. A. (1994). Leadership without easy answers. Cambridge, MA: Belknap Press of Harvard
University Press.
Heller, M. F., & Firestone, W. A. (1995). Who’s in charge here? Sources of leadership for change in
eight schools. Elementary School Journal, 96(1), 65–86.
Homans, G. C. (1950). The human group. New York: Harcourt.
Jackson, S. E. (1992). Team composition in organizational settings: Issues in managing an increas-
ingly diverse workforce. In S. Wochel, W. Wood, & J. A. Simpson (Eds.), Group process and
productivity (pp. 138–173). Newbury Park, CA: Sage.
Jehn, K. A. (1995). A multimethod examination of the benefits and detriments of intragroup con-
flict. Administrative Science Quarterly, 40, 256–282.
Jehn, K. A., Northcraft, G. B., & Neale, M. A. (1999). Why differences make a difference: A field
study of diversity, conflict, and performance in workgroups. Administrative Science Quarterly,
44, 741–763.
Leithwood, K., Mascall, B., Strauss, T., Sacks, R., Memon, N., & Yashkina, A. (2007). Distributing
leadership to make schools smarter: Taking the ego out of the system. Leadership and Policy in
Schools, 6(1), 37–67.
Leithwood, K., Seashore Louis, K., Anderson, S., & Wahlstrom, K. (2004). How leadership influ-
ences student learning: A review of research for the Learning from Leadership Project. New York:
Wallace Foundation.
Loeb, S., & Reininger, M. (2004). Public policy and teacher labor markets: What we know and why it
matters. East Lansing: Education Policy Center at Michigan State University.
MacBeath, J., Oduro, G. K. T., & Waterhouse, J. (2004). Distributed leadership in action: A study of
current practice in schools. Nottingham: National College for School Leadership.
McLaughlin, M. W., & Talbert, J. E. (1993). Contexts that matter for teaching and learning: Strategic
opportunities for meeting the nation’s education goals. Stanford, CA: Center for Research on the
Context of Secondary School Teaching.
McLeod, P. L., & Lobel, S. A. (1992, August). The effects of ethnic diversity on idea generation in small
groups. Paper presented at the Academy of Management Annual Meeting, Las Vegas, NV.
Meyer, J. W., & Rowan, B. (1977). Institutionalized organizations: Formal structure as myth and
ceremony. American Journal of Sociology, 83(2), 340–363.
Miller, R. J., & Rowan, B. (2006). Effects of organic management on student achievement. Amer-
ican Educational Research Journal, 43(2), 219–253.
No Child Left Behind Act of 2001, 20 U.S.C. § 9101 C.F.R. (2002).
O’Reilly, C., Williams, K., & Barsade, S. (1998). Group demography and innovation: Does diversity
help? In E. A. Mannix & M. A. Neale (Eds.), Research on managing groups and teams (Vol. 1, pp.
183–207). Greenwich, CT: JAI.
Ostroff, C. (1992). The relationship between satisfaction, attitudes, and performance: An organi-
zational level analysis. Journal of Applied Psychology, 77(6), 963–974.
Pelled, L. H. (1996). Demographic diversity, conflict, and work group outcomes: An intervening
process theory. Organization Science, 7(6), 615–631.
Pelled, L. H., Eisenhardt, K. M., & Xin, K. R. (1999). Exploring the black box: An analysis of work
group diversity, conflict and performance. Administrative Science Quarterly, 44, 1–28.
Pfeffer, J. (1985). Organizational demography: Implications for management. California Manage-
ment Review, 28(1), 67–81.
Pitts, V., & Spillane, J. P. (2009). Using social network methods to study school leadership. Inter-
national Journal of Research and Method in Education, 32(2), 185–207.
Pustejovsky, J., Spillane, J. P., Heaton, R. M., & Lewis, W. J. (2009). Understanding teacher lead-
ership in middle school mathematics: A collaborative research effort. Journal of Mathematics
and Science: Collaborative Explorations, 11, 19–40.
⅐