
More Related Content
More from Erdi Karaçal
More from Erdi Karaçal (20)
Recently uploaded
Recently uploaded (20)
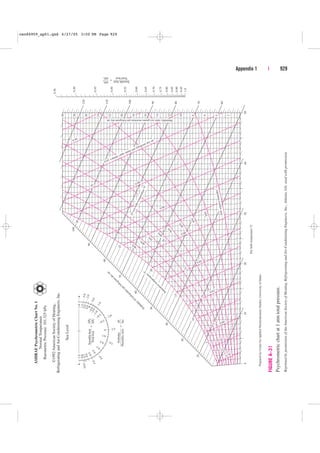
Psychrometric chart Erdi Karaçal Mechanical Engineer University of Gaziantep
- 1. Appendix 1 | 929 • 5.0 1.0 1.5 0.8 0.7 Prepared by Center for Applied Thermodynamic Studies, University of Idaho. 0.36 0.40 0.45 0.50 0.55 0.60 0.65 0.70 0.75 0.80 0.85 0.90 0.95 1.0 Enthalpy —————— Humidity ratio Δh —— Δ = ΔHS —— ΔHT = —Se—nsi—bl—e h—ea–t Total heat 120 110 100 90 80 60 25 wet bulb temperature °C 20 30 40 50 Dry bulb temperature °C 0 10 70 —Se—nsi—bl—e h—ea–t Total heat ΔHS —— ΔHT = 1.0 –• –5.0 –2.0 0.0 2.0 4.0 –1.0 – 0.5 1.0 2.5 2.0 0.1 0.2 0.3 0.4 0.5 0.6 3.0 4.0 10.0 –0.2 • –4.0 –2.0 0 Enthalpy (h) kilojoules per kilogram dry air 20 30 40 50 60 70 80 90 100 Saturation temperature °C 5 10 15 20 25 30 30 0.94 30 20 15 10 5 0 0.90 0.88 0.86 0.84 0.82 0.80 0.78 28 90% 80% 70% 60% 50% 40% 30% 20% 26 24 22 20 18 16 14 12 10 8 10% relative humidity 0.92 volume cubic meter per kilogram dry air Humidity ratio () grams moisture per kilogram dry air 6 4 2 ASHRAE Psychrometric Chart No. 1 Normal Temperature Barometric Pressure: 101.325 kPa ©1992 American Society of Heating, Refrigerating and Air-Conditioning Engineers, Inc. Sea Level FIGURE A–31 Psychrometric chart at 1 atm total pressure. Reprinted by permission of the American Society of Heating, Refrigerating and Air-Conditioning Engineers, Inc., Atlanta, GA; used with permission. cen84959_ap01.qxd 4/27/05 3:00 PM Page 929