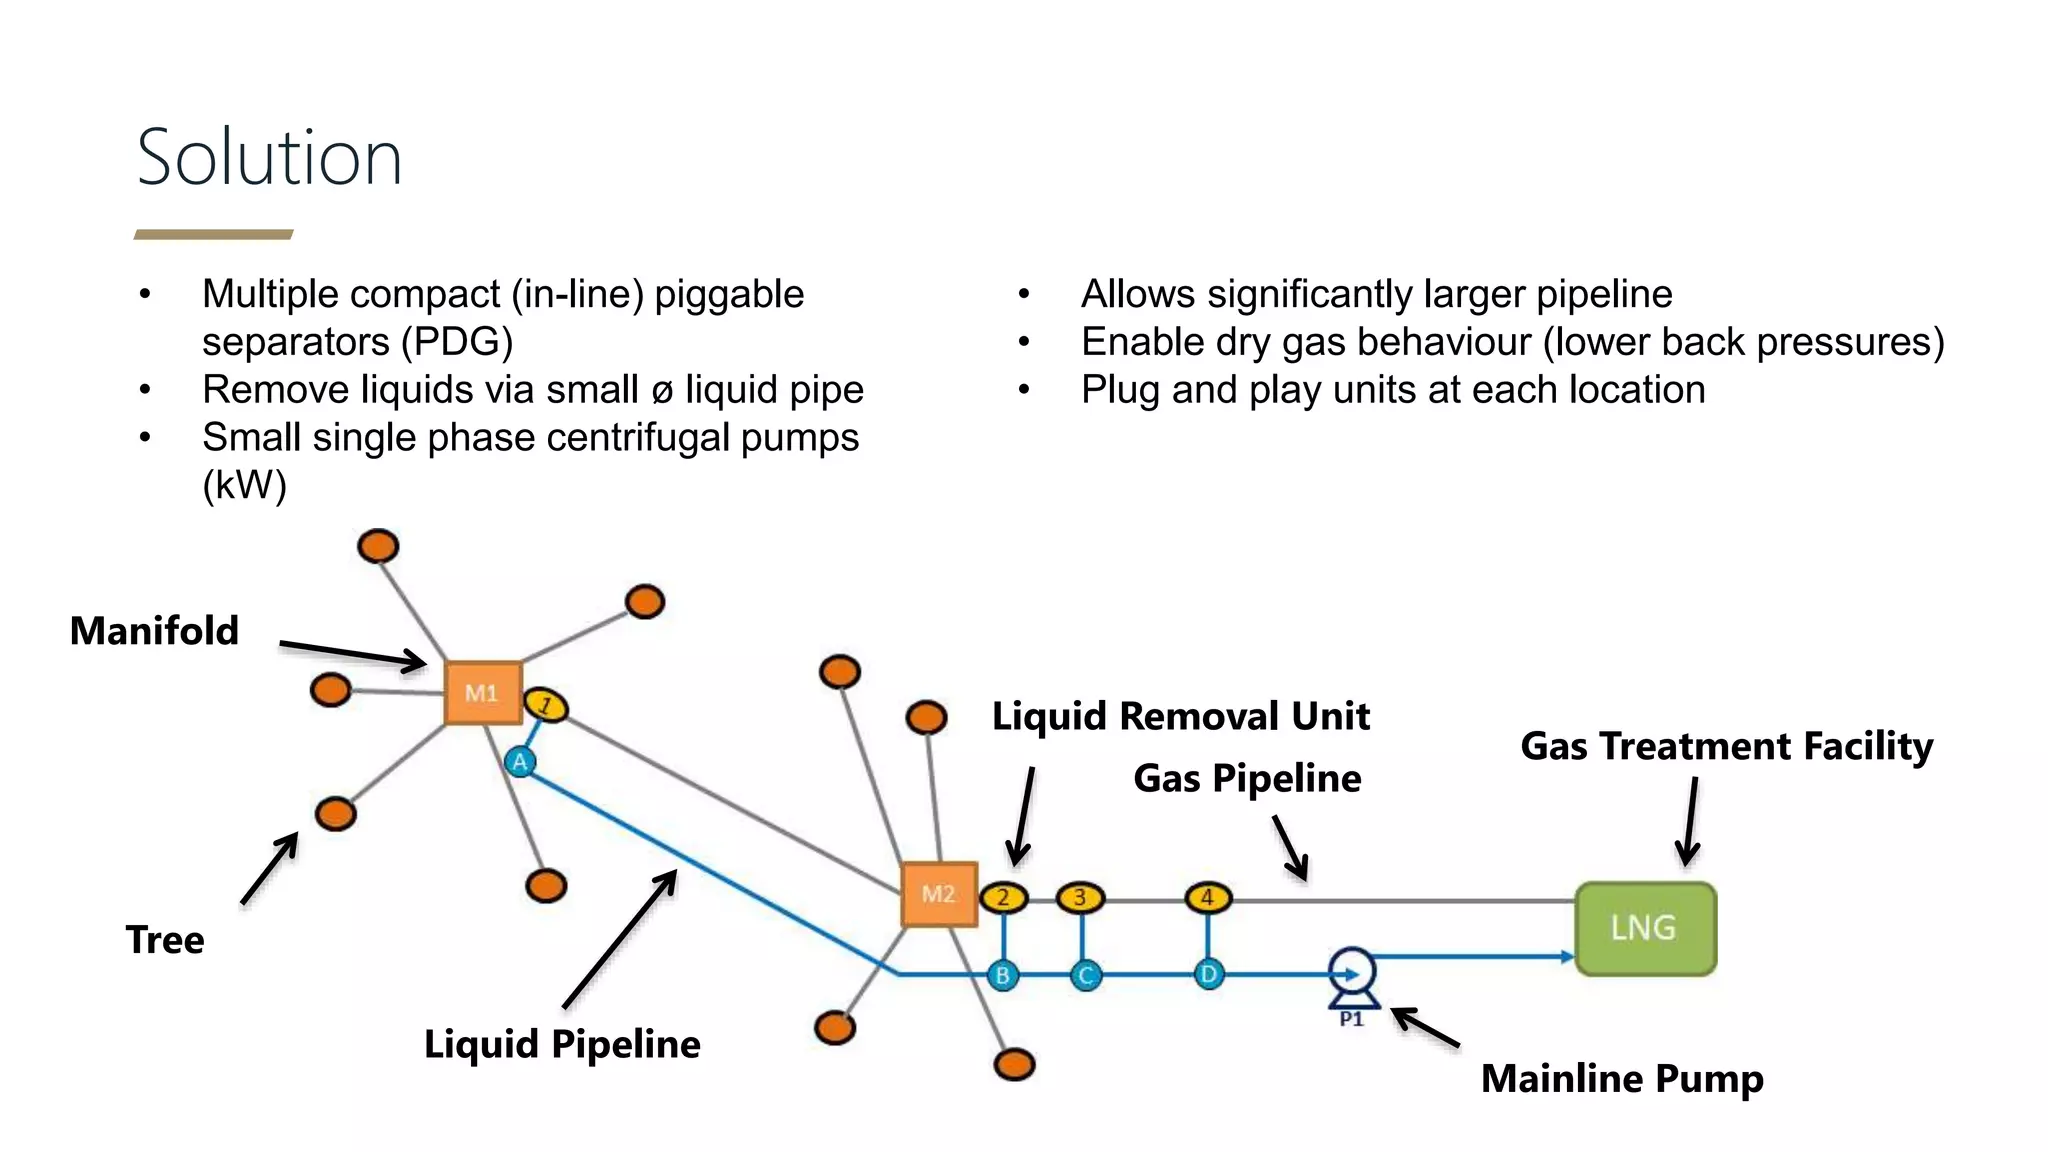
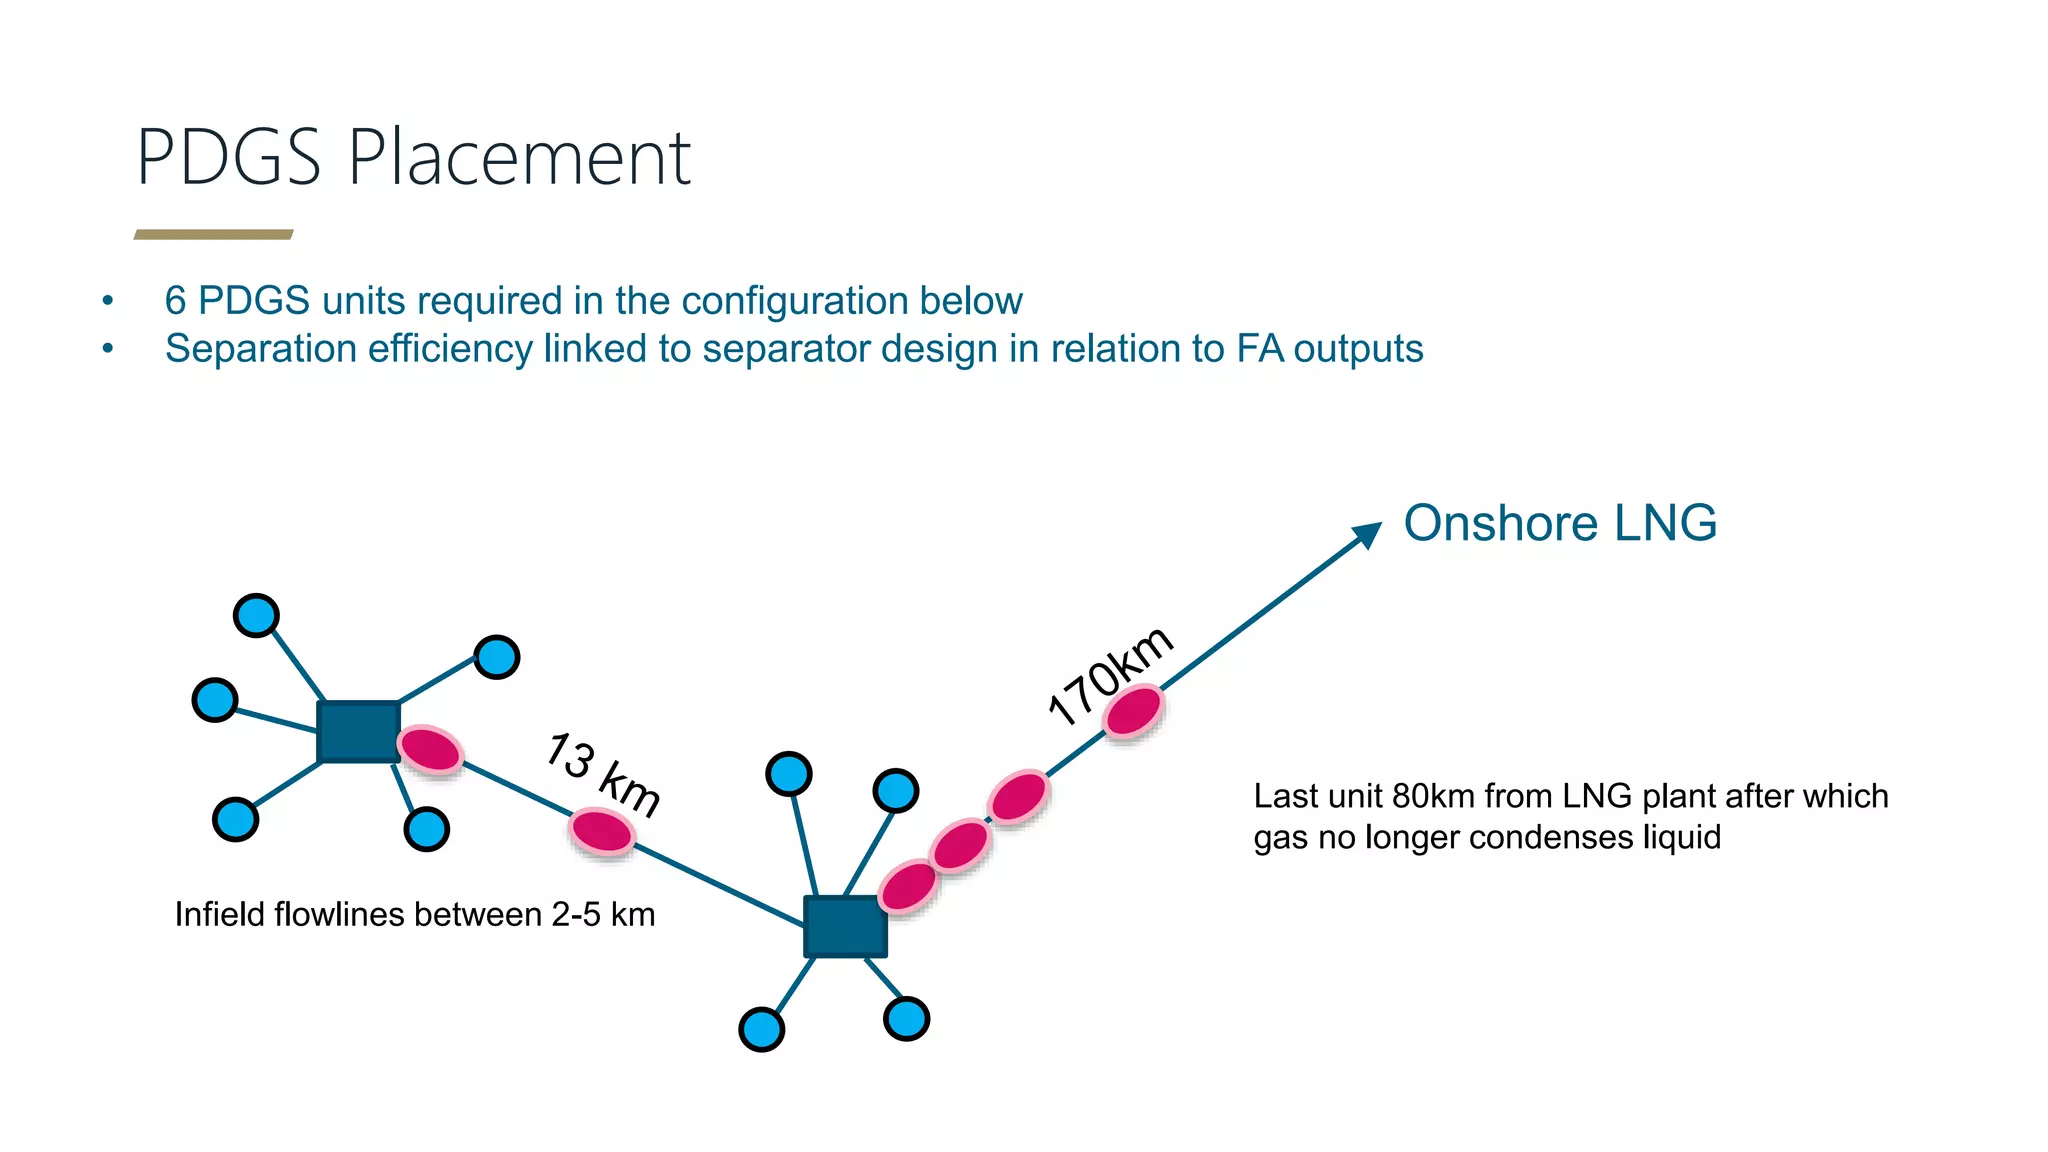
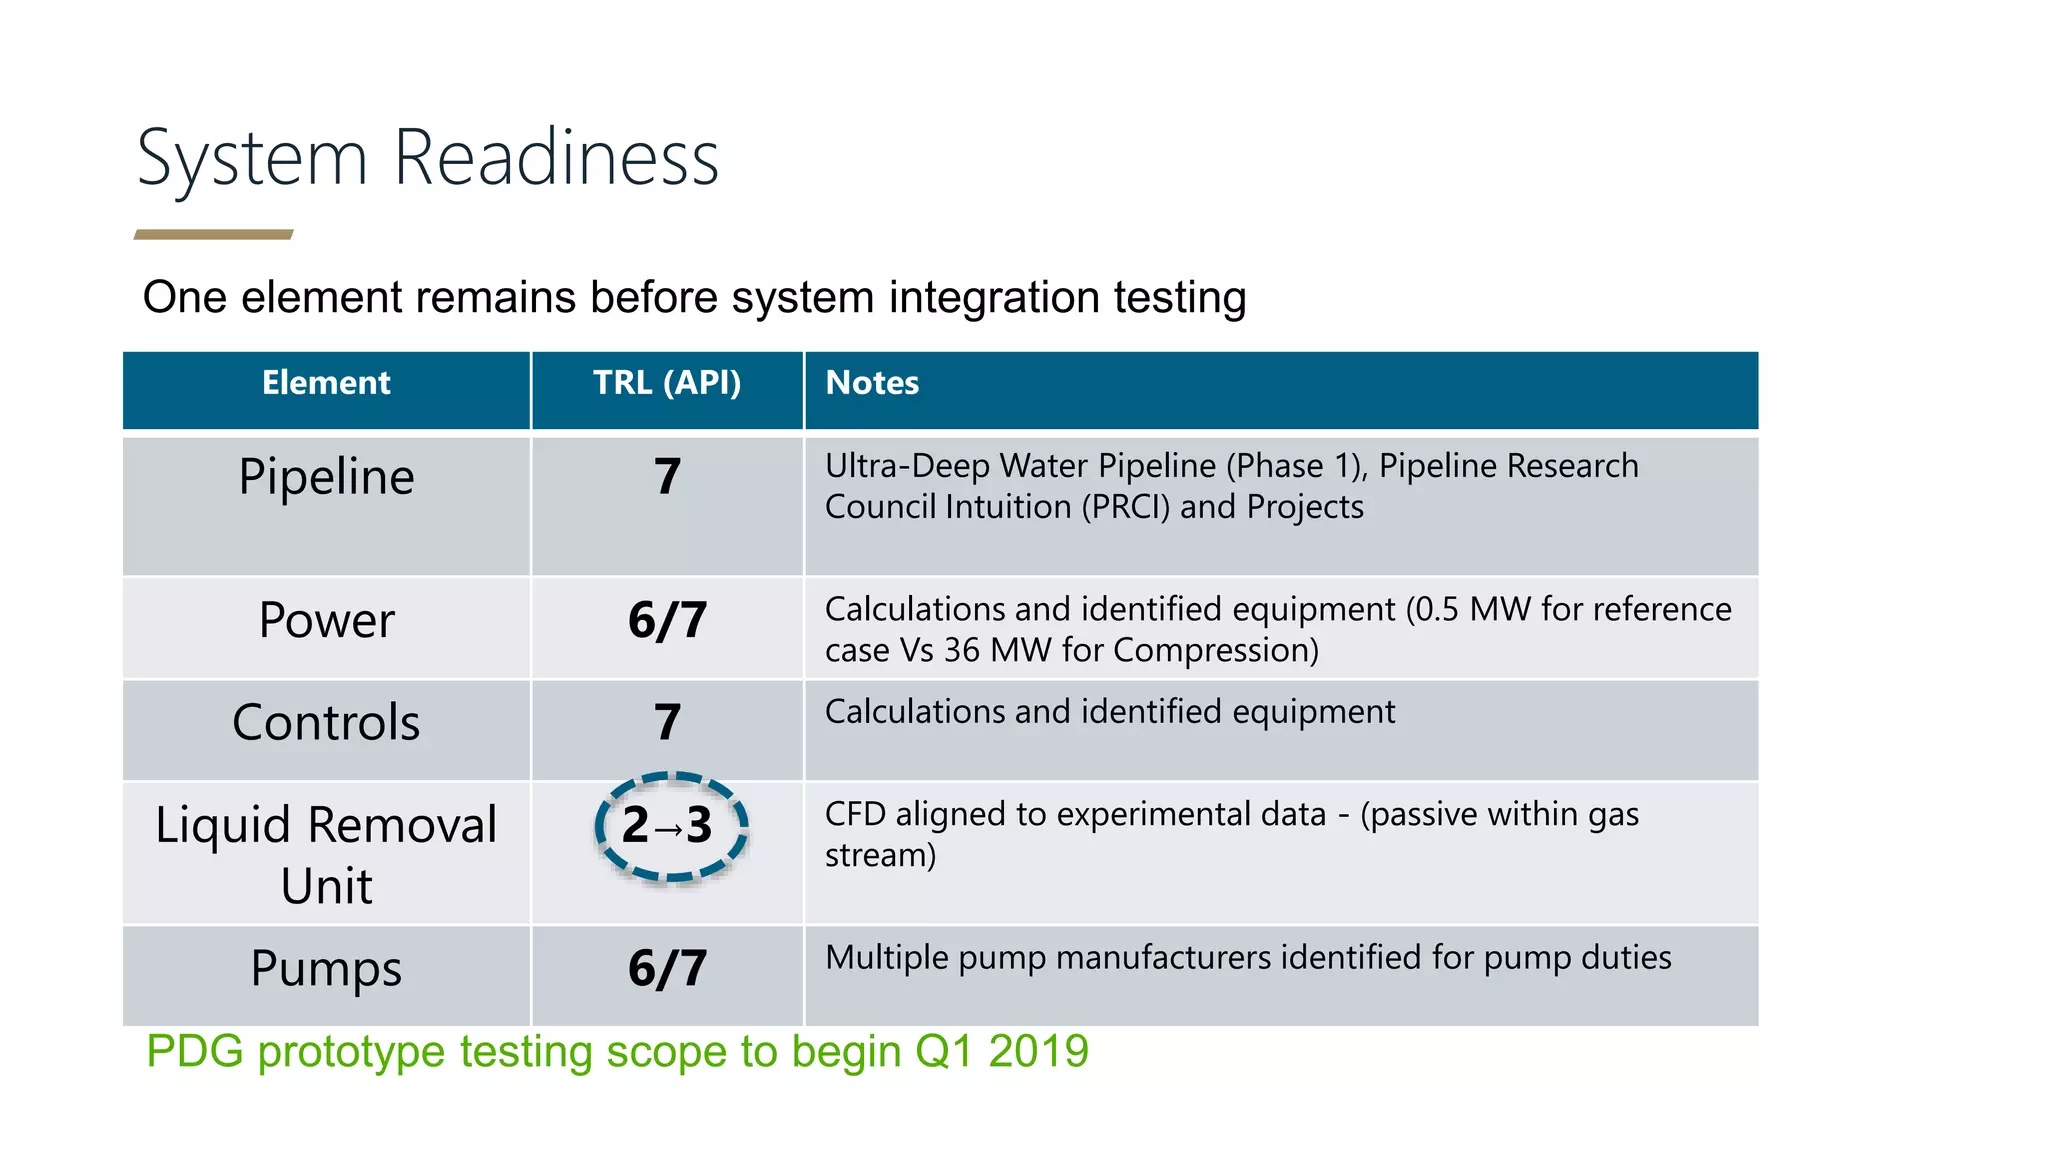
www.advisian.com
Pseudo Dry Gas System
An enabling technology for remote gas fields
www.intecsea.com
20th June 2018
Perceptions of a Problem
Quotation from Henry Ford
“If I’d asked my customers what they wanted, they’d have
said a faster horse”
Objective
• Present an innovative Pseudo Dry Gas (PDG) separation technology to demonstrate
that tie backs far in excess of the current threshold distance can be achieved.
0
500
1000
1500
2000
2500
3000
0 20 40 60 80 100 120 140 160
WaterDepth(m)
Tie Back Distance (Km)
Single Pipeline Dual Pipelines Subsea Existing / Planned Compression
Limit on dual pipeline
design envelope
Limit on single pipeline
design envelope
Underlying Problem
ΔP
Less ← Flowrate → More
ΔP
Smaller ← Diameter → Larger
• Gas pipelines diameter
choice is a compromise
between lowest well back
pressure Vs operability
driven by liquids
• More distance =
Greater Compromise =
Greater Back Pressure =
Less Revenue =
Lower NPV =
Stranded Gas Reserves
Fixed Flowrate
Gravitational
(Slugging)
Gravitational
(slugging)Frictional Frictional
Fixed Diameter
Solution
• Multiple compact (in-line) piggable
separators (PDG)
• Remove liquids via small ø liquid pipe
• Small single phase centrifugal pumps
(kW)
• Allows significantly larger pipeline
• Enable dry gas behaviour (lower back pressures)
• Plug and play units at each location
Gas Treatment Facility
Gas Pipeline
Manifold
Tree
Liquid Removal Unit
Liquid Pipeline
Mainline Pump
Coal Seam Gas - Overview
• Drain points are a proven solution for Coal Seam Gas gathering networks in
Queensland Australia
Coal Seam Gas - Overview
Pressure (KPa) Wet Gas Dry Gas Wet Gas
(LPDs)
P drop 133 18 22
Increased pressure drop is caused by water
Separators added to
simulate Drains
Case Study - Context
• Trunkline; 170km long
• WD 0-1800m, no escarpment
• Two manifolds and 9 satellite wells
DESIGN REQUIREMENTS
Design Flow Rate = 880 MMscfd
Turndown Rate = 380 MMscfd
Arrival Pressure Early Life = 60 bara
Arrival Pressure Late Life = 30 bara
LGR = 12 bbl/MMscf
Infield flowlines between 2-5 km
Onshore LNG
Case Study - Pipeline Sizing
0
5,000
10,000
15,000
20,000
25,000
30,000
35,000
50
70
90
110
130
150
170
190
210
230
24 26 28 30 32 34 36
SurgeVolume(m3)
TrunklineInletPressure(bara)
Trunkline Size ("NPS)
Line Size Selection (LGR = 12 bbld/MMscf) - Shore P=60bara
Trunkline Inlet P at 880 MMscfd Trunkline Inlet P at 380 MMscfd Ramp-up Volume from 380 to 880 MMscfd
Turndown driving selection
Production Impact
0
160
320
480
640
800
960
0
50
100
150
200
250
300
0 1 2 3 4 5 6 7 8 9 10 11 12 13 14 15 16
GasFlowrate(MMscfd)
WellheadPressure(bara)
Time (Years)
Flow Rate
Accumulative
lost Production
Lost revenue at
US$10 billion
≈ US$6/MMbtu
End of production 60
bar arrival pressure
End of production 30
bar arrival pressure
PDG System Design Methodology
Standard subsea tieback approach:
• Liquid holdup dictates sizing
• Shortened plateau period
The solution is to mitigate the liquid phase
• Pipeline sizing no longer constrained by fluid management (30” + selected)
• Flow assurance used to determine optimal placement of PDG separators.
The design considers: - Temperature profiles (design and turndown)
- Terrain, liquid hold up and flow regime
- Transient cases, i.e. shutdowns and start-ups
- Installation constraints
PDGS Placement
• 6 PDGS units required in the configuration below
• Separation efficiency linked to separator design in relation to FA outputs
Infield flowlines between 2-5 km
Onshore LNG
Last unit 80km from LNG plant after which
gas no longer condenses liquid
PDGS Enabled Tie-back Hydraulics
0
20
40
60
80
100
120
140
160
60 bara, 880 MMScfd 60 bara, Turndown 30 bara, 880 MMScfd 30 bara, Turndown
RequiredPipelineInputPressure
Standard FA (30") PDG System (36") Dry Gas (36")
• 55 to 80 bar reduction in wellhead back pressure across design cases
70-120+ bar in
actual studies 1
Bcf/d
PDGS Enabled Tie-back – Production Impact
0
160
320
480
640
800
960
0
50
100
150
200
250
300
0 1 2 3 4 5 6 7 8 9 10 11 12 13 14 15 16
GasFlowrate(MMscfd)
WellheadPressure(bara)
Time (Years)
Accumulative
increase in
Production
Increase of revenue
at US$6/MMbtu ≈
US$10 billion
Flow Rate
End of production 60
bar arrival pressure
End of production 30
bar arrival pressure
PDGS Enabled Tie-back Hydraulics
0.001
0.010
0.100
1.000
10.000
100.000
0 20 40 60 80 100 120 140 160 180
TrunklineLiquidHoldup(%)
Horizontal Distance (km)
Std FA - 880MMscfd - 30in TL PDGS - 880MMScfd - 36in TL
% on log scale
Effective
Dehydration
No membranes
No consumables
No pressure loss
Suppression of
hydrocarbon phase
Economic Advantage
With PDG system implementation, CAPEX intensive structures can be removed without impacting
recoverable reserves and significantly reducing upfront cost, which improves the overall NPV / IRR of
the potential project
0
500
1000
1500
2000
2500
3000
3500
Development Options
CAPEX(US$'0000')
Standard Tie Back
PDG Tie Back
Floating Vessel and Tie
back
1.5bn
1.9bn
3.2bn
Liquid Removal Unit as an In-line Structure
• Installed as a pipeline in-line structure – low CAPEX
• Liquid Removal Unit performance meets requirements from ‘case study’
• Based on experimental data and CFD
• Gravity based with venturi aided flow separator
• No moving parts (passive) or consumables
• Piggable
System Readiness
Element TRL (API) Notes
Pipeline 7 Ultra-Deep Water Pipeline (Phase 1), Pipeline Research
Council Intuition (PRCI) and Projects
Power 6/7 Calculations and identified equipment (0.5 MW for reference
case Vs 36 MW for Compression)
Controls 7 Calculations and identified equipment
Liquid Removal
Unit
2→3 CFD aligned to experimental data - (passive within gas
stream)
Pumps 6/7 Multiple pump manufacturers identified for pump duties
PDG prototype testing scope to begin Q1 2019
One element remains before system integration testing
Conclusions - Increase in Tie back Distances
0
500
1000
1500
2000
2500
3000
3500
0 20 40 60 80 100 120 140 160 180 200
WaterDepth(m)
Tie Back Distance (Km)
Single Pipeline Dual Pipelines Subsea Existing / Planned Compression PDG System
Conclusions – Applications – North Sea
Acreage that can be
developed at 50% less
CAPEX – (without floating
vessels) or loss of
production in reserves
Thank you – any questions?
lee.thomas@intecsea.com
terry.wood@intecsea.com

Pseudo Dry Gas System

  • 1.
    www.advisian.com Pseudo Dry GasSystem An enabling technology for remote gas fields www.intecsea.com 20th June 2018
  • 2.
    Perceptions of aProblem Quotation from Henry Ford “If I’d asked my customers what they wanted, they’d have said a faster horse”
  • 3.
    Objective • Present aninnovative Pseudo Dry Gas (PDG) separation technology to demonstrate that tie backs far in excess of the current threshold distance can be achieved. 0 500 1000 1500 2000 2500 3000 0 20 40 60 80 100 120 140 160 WaterDepth(m) Tie Back Distance (Km) Single Pipeline Dual Pipelines Subsea Existing / Planned Compression Limit on dual pipeline design envelope Limit on single pipeline design envelope
  • 4.
    Underlying Problem ΔP Less ←Flowrate → More ΔP Smaller ← Diameter → Larger • Gas pipelines diameter choice is a compromise between lowest well back pressure Vs operability driven by liquids • More distance = Greater Compromise = Greater Back Pressure = Less Revenue = Lower NPV = Stranded Gas Reserves Fixed Flowrate Gravitational (Slugging) Gravitational (slugging)Frictional Frictional Fixed Diameter
  • 5.
    Solution • Multiple compact(in-line) piggable separators (PDG) • Remove liquids via small ø liquid pipe • Small single phase centrifugal pumps (kW) • Allows significantly larger pipeline • Enable dry gas behaviour (lower back pressures) • Plug and play units at each location Gas Treatment Facility Gas Pipeline Manifold Tree Liquid Removal Unit Liquid Pipeline Mainline Pump
  • 6.
    Coal Seam Gas- Overview • Drain points are a proven solution for Coal Seam Gas gathering networks in Queensland Australia
  • 7.
    Coal Seam Gas- Overview Pressure (KPa) Wet Gas Dry Gas Wet Gas (LPDs) P drop 133 18 22 Increased pressure drop is caused by water Separators added to simulate Drains
  • 8.
    Case Study -Context • Trunkline; 170km long • WD 0-1800m, no escarpment • Two manifolds and 9 satellite wells DESIGN REQUIREMENTS Design Flow Rate = 880 MMscfd Turndown Rate = 380 MMscfd Arrival Pressure Early Life = 60 bara Arrival Pressure Late Life = 30 bara LGR = 12 bbl/MMscf Infield flowlines between 2-5 km Onshore LNG
  • 9.
    Case Study -Pipeline Sizing 0 5,000 10,000 15,000 20,000 25,000 30,000 35,000 50 70 90 110 130 150 170 190 210 230 24 26 28 30 32 34 36 SurgeVolume(m3) TrunklineInletPressure(bara) Trunkline Size ("NPS) Line Size Selection (LGR = 12 bbld/MMscf) - Shore P=60bara Trunkline Inlet P at 880 MMscfd Trunkline Inlet P at 380 MMscfd Ramp-up Volume from 380 to 880 MMscfd Turndown driving selection
  • 10.
    Production Impact 0 160 320 480 640 800 960 0 50 100 150 200 250 300 0 12 3 4 5 6 7 8 9 10 11 12 13 14 15 16 GasFlowrate(MMscfd) WellheadPressure(bara) Time (Years) Flow Rate Accumulative lost Production Lost revenue at US$10 billion ≈ US$6/MMbtu End of production 60 bar arrival pressure End of production 30 bar arrival pressure
  • 11.
    PDG System DesignMethodology Standard subsea tieback approach: • Liquid holdup dictates sizing • Shortened plateau period The solution is to mitigate the liquid phase • Pipeline sizing no longer constrained by fluid management (30” + selected) • Flow assurance used to determine optimal placement of PDG separators. The design considers: - Temperature profiles (design and turndown) - Terrain, liquid hold up and flow regime - Transient cases, i.e. shutdowns and start-ups - Installation constraints
  • 12.
    PDGS Placement • 6PDGS units required in the configuration below • Separation efficiency linked to separator design in relation to FA outputs Infield flowlines between 2-5 km Onshore LNG Last unit 80km from LNG plant after which gas no longer condenses liquid
  • 13.
    PDGS Enabled Tie-backHydraulics 0 20 40 60 80 100 120 140 160 60 bara, 880 MMScfd 60 bara, Turndown 30 bara, 880 MMScfd 30 bara, Turndown RequiredPipelineInputPressure Standard FA (30") PDG System (36") Dry Gas (36") • 55 to 80 bar reduction in wellhead back pressure across design cases 70-120+ bar in actual studies 1 Bcf/d
  • 14.
    PDGS Enabled Tie-back– Production Impact 0 160 320 480 640 800 960 0 50 100 150 200 250 300 0 1 2 3 4 5 6 7 8 9 10 11 12 13 14 15 16 GasFlowrate(MMscfd) WellheadPressure(bara) Time (Years) Accumulative increase in Production Increase of revenue at US$6/MMbtu ≈ US$10 billion Flow Rate End of production 60 bar arrival pressure End of production 30 bar arrival pressure
  • 15.
    PDGS Enabled Tie-backHydraulics 0.001 0.010 0.100 1.000 10.000 100.000 0 20 40 60 80 100 120 140 160 180 TrunklineLiquidHoldup(%) Horizontal Distance (km) Std FA - 880MMscfd - 30in TL PDGS - 880MMScfd - 36in TL % on log scale Effective Dehydration No membranes No consumables No pressure loss Suppression of hydrocarbon phase
  • 16.
    Economic Advantage With PDGsystem implementation, CAPEX intensive structures can be removed without impacting recoverable reserves and significantly reducing upfront cost, which improves the overall NPV / IRR of the potential project 0 500 1000 1500 2000 2500 3000 3500 Development Options CAPEX(US$'0000') Standard Tie Back PDG Tie Back Floating Vessel and Tie back 1.5bn 1.9bn 3.2bn
  • 17.
    Liquid Removal Unitas an In-line Structure • Installed as a pipeline in-line structure – low CAPEX • Liquid Removal Unit performance meets requirements from ‘case study’ • Based on experimental data and CFD • Gravity based with venturi aided flow separator • No moving parts (passive) or consumables • Piggable
  • 18.
    System Readiness Element TRL(API) Notes Pipeline 7 Ultra-Deep Water Pipeline (Phase 1), Pipeline Research Council Intuition (PRCI) and Projects Power 6/7 Calculations and identified equipment (0.5 MW for reference case Vs 36 MW for Compression) Controls 7 Calculations and identified equipment Liquid Removal Unit 2→3 CFD aligned to experimental data - (passive within gas stream) Pumps 6/7 Multiple pump manufacturers identified for pump duties PDG prototype testing scope to begin Q1 2019 One element remains before system integration testing
  • 19.
    Conclusions - Increasein Tie back Distances 0 500 1000 1500 2000 2500 3000 3500 0 20 40 60 80 100 120 140 160 180 200 WaterDepth(m) Tie Back Distance (Km) Single Pipeline Dual Pipelines Subsea Existing / Planned Compression PDG System
  • 20.
    Conclusions – Applications– North Sea Acreage that can be developed at 50% less CAPEX – (without floating vessels) or loss of production in reserves
  • 21.
    Thank you –any questions? lee.thomas@intecsea.com terry.wood@intecsea.com