Download as PDF, PPTX
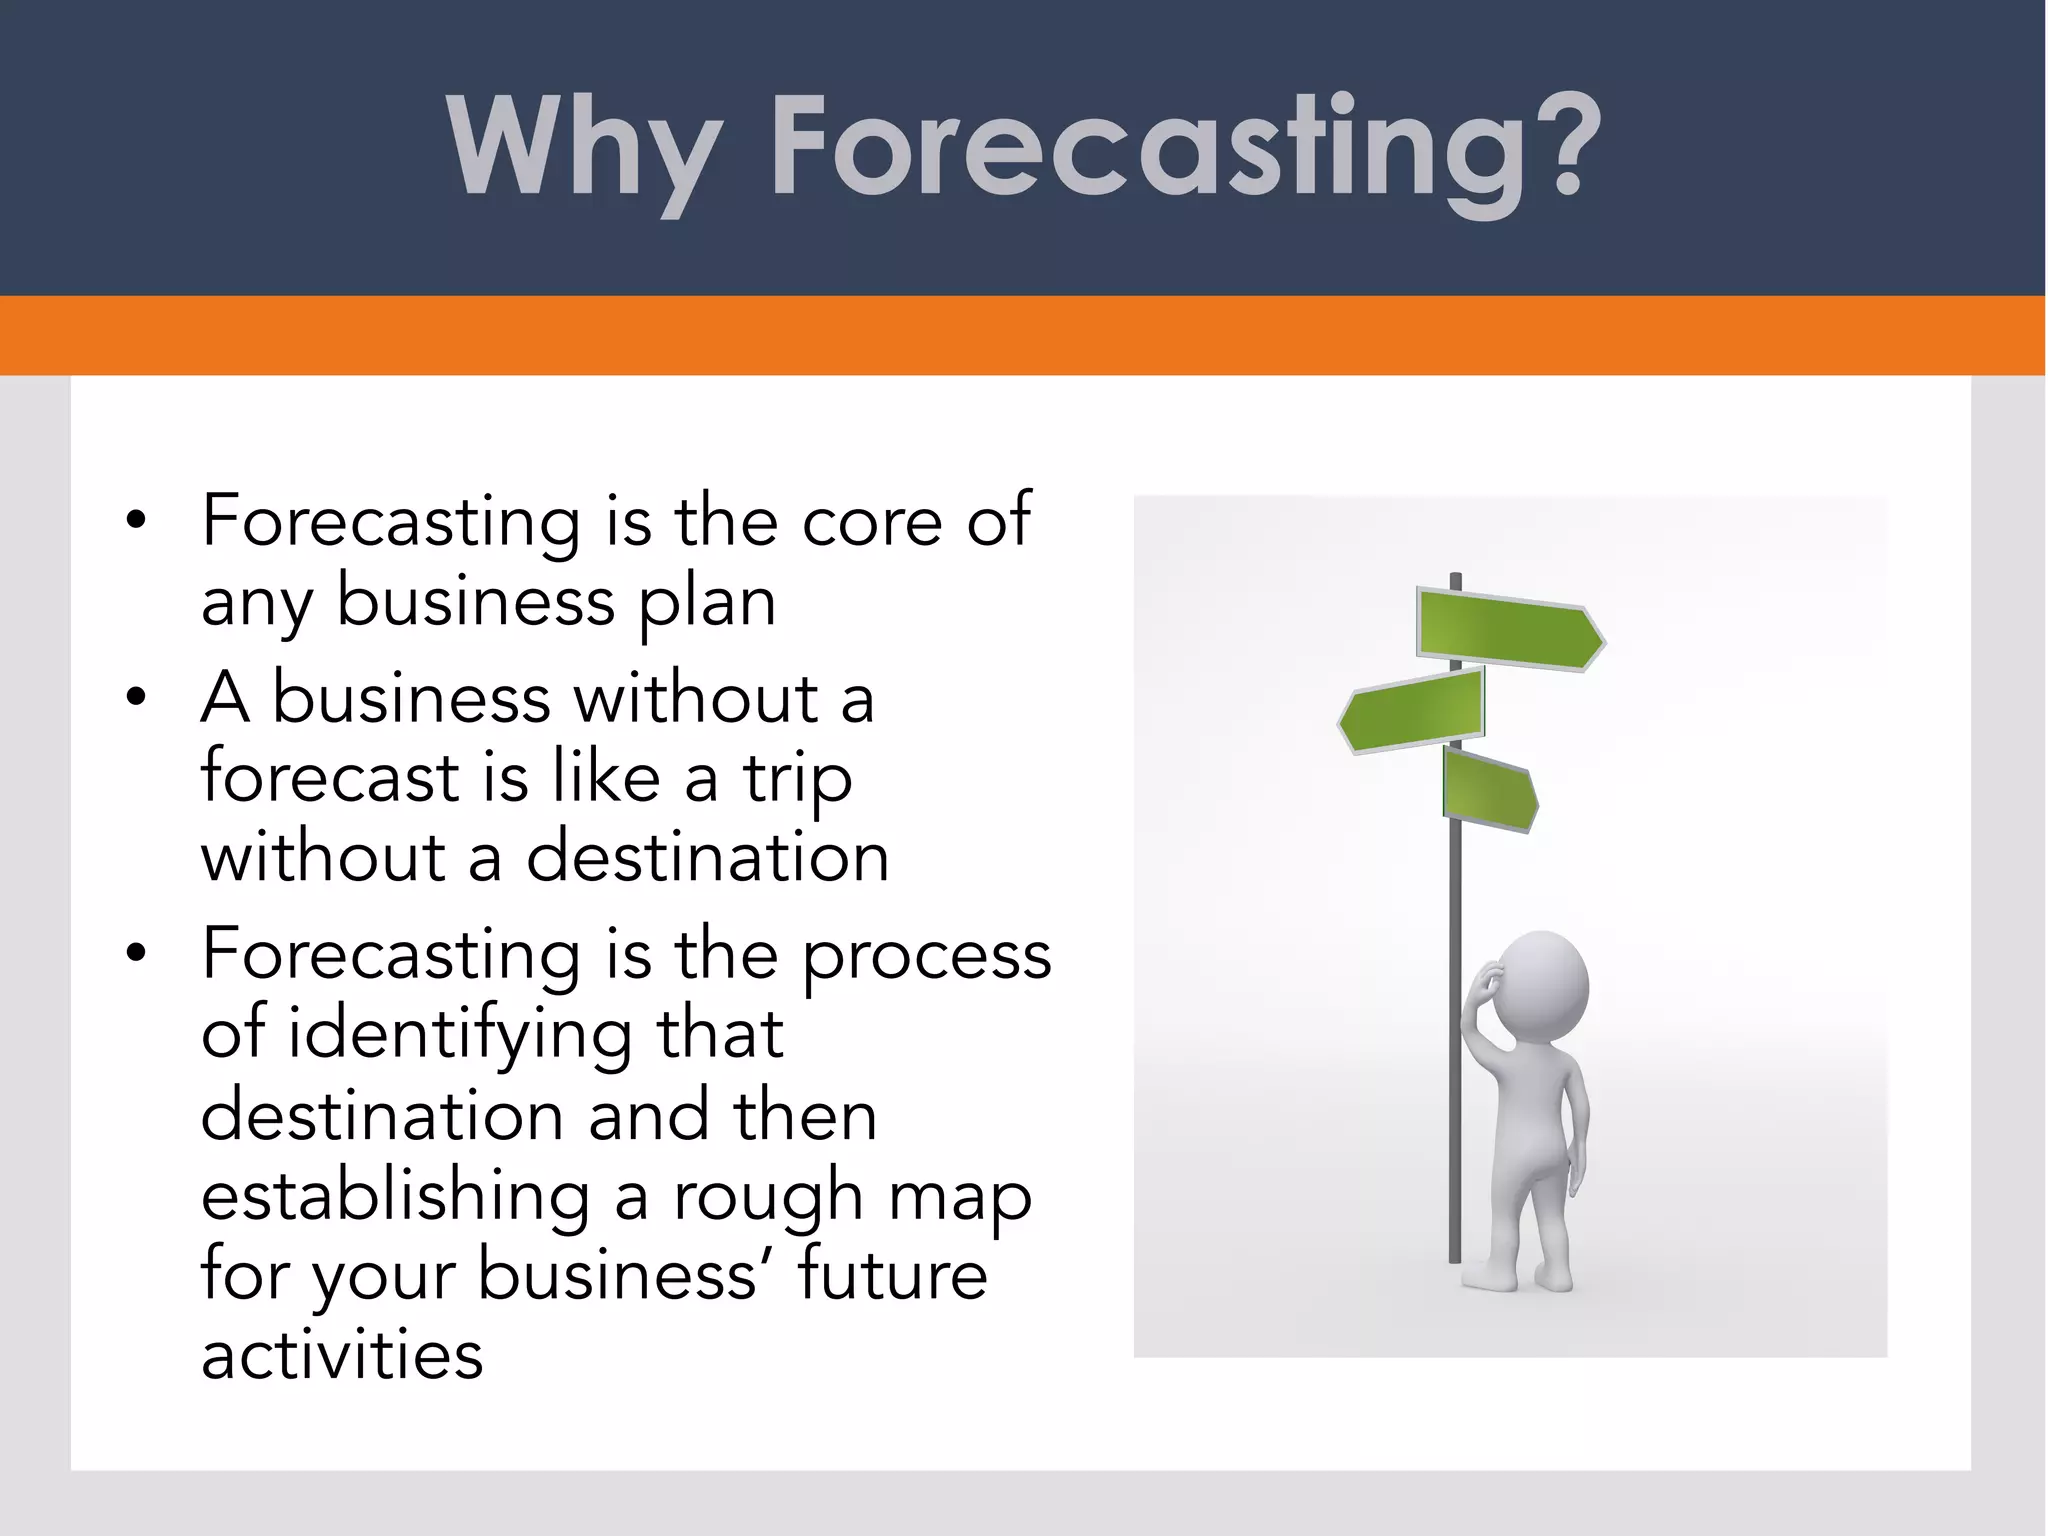
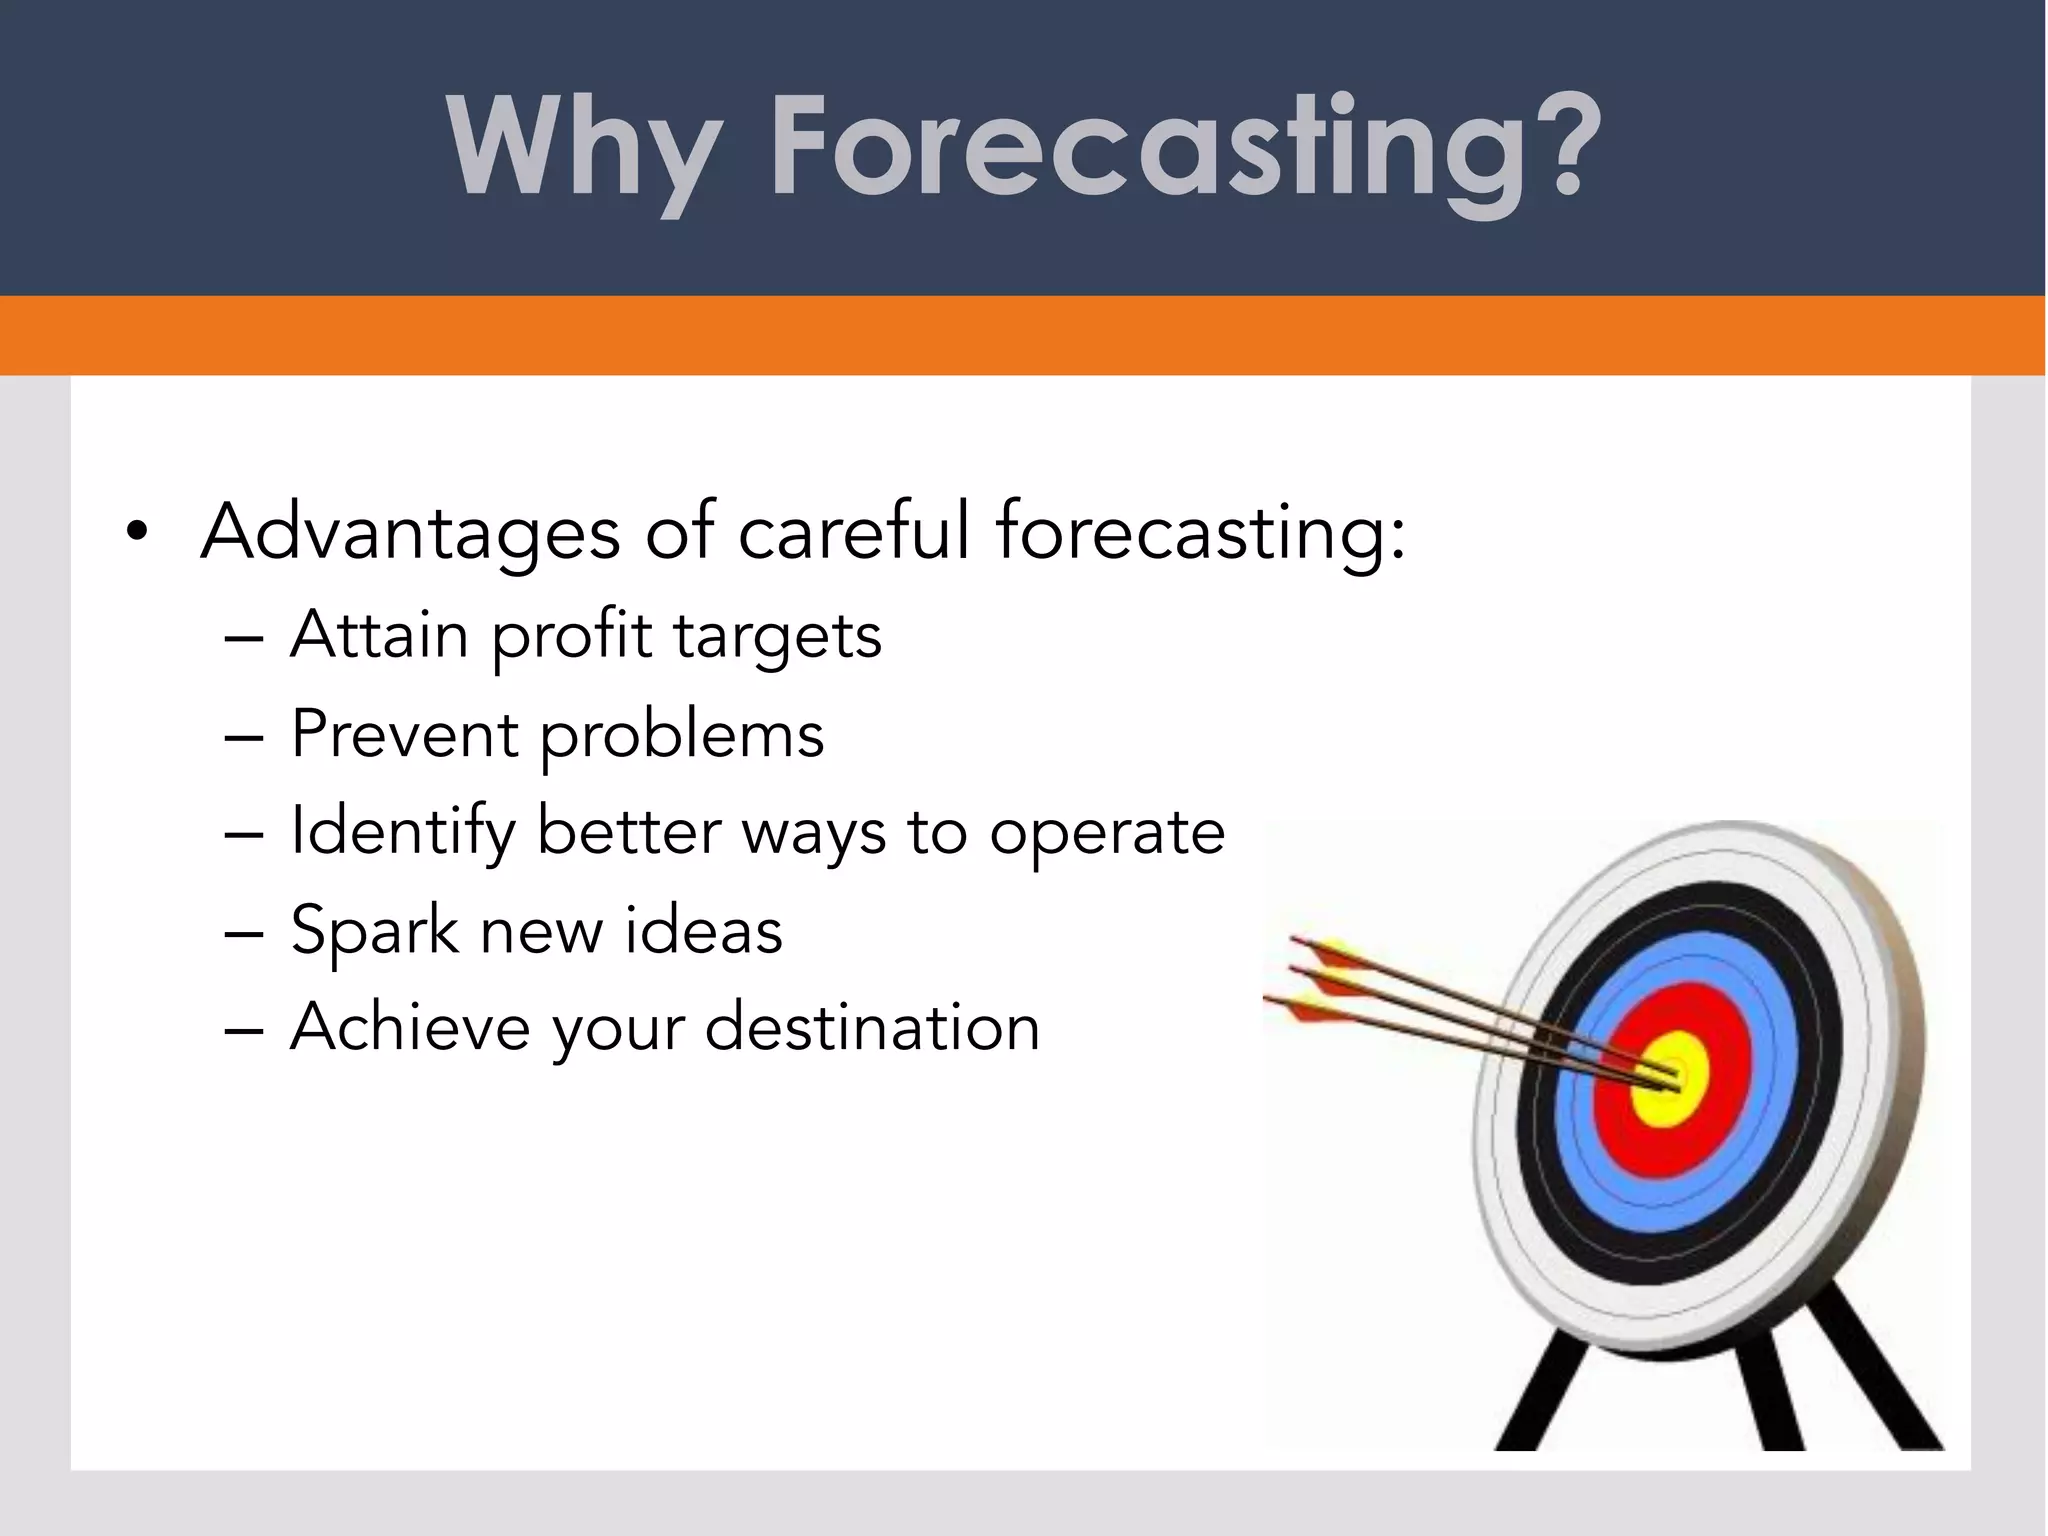
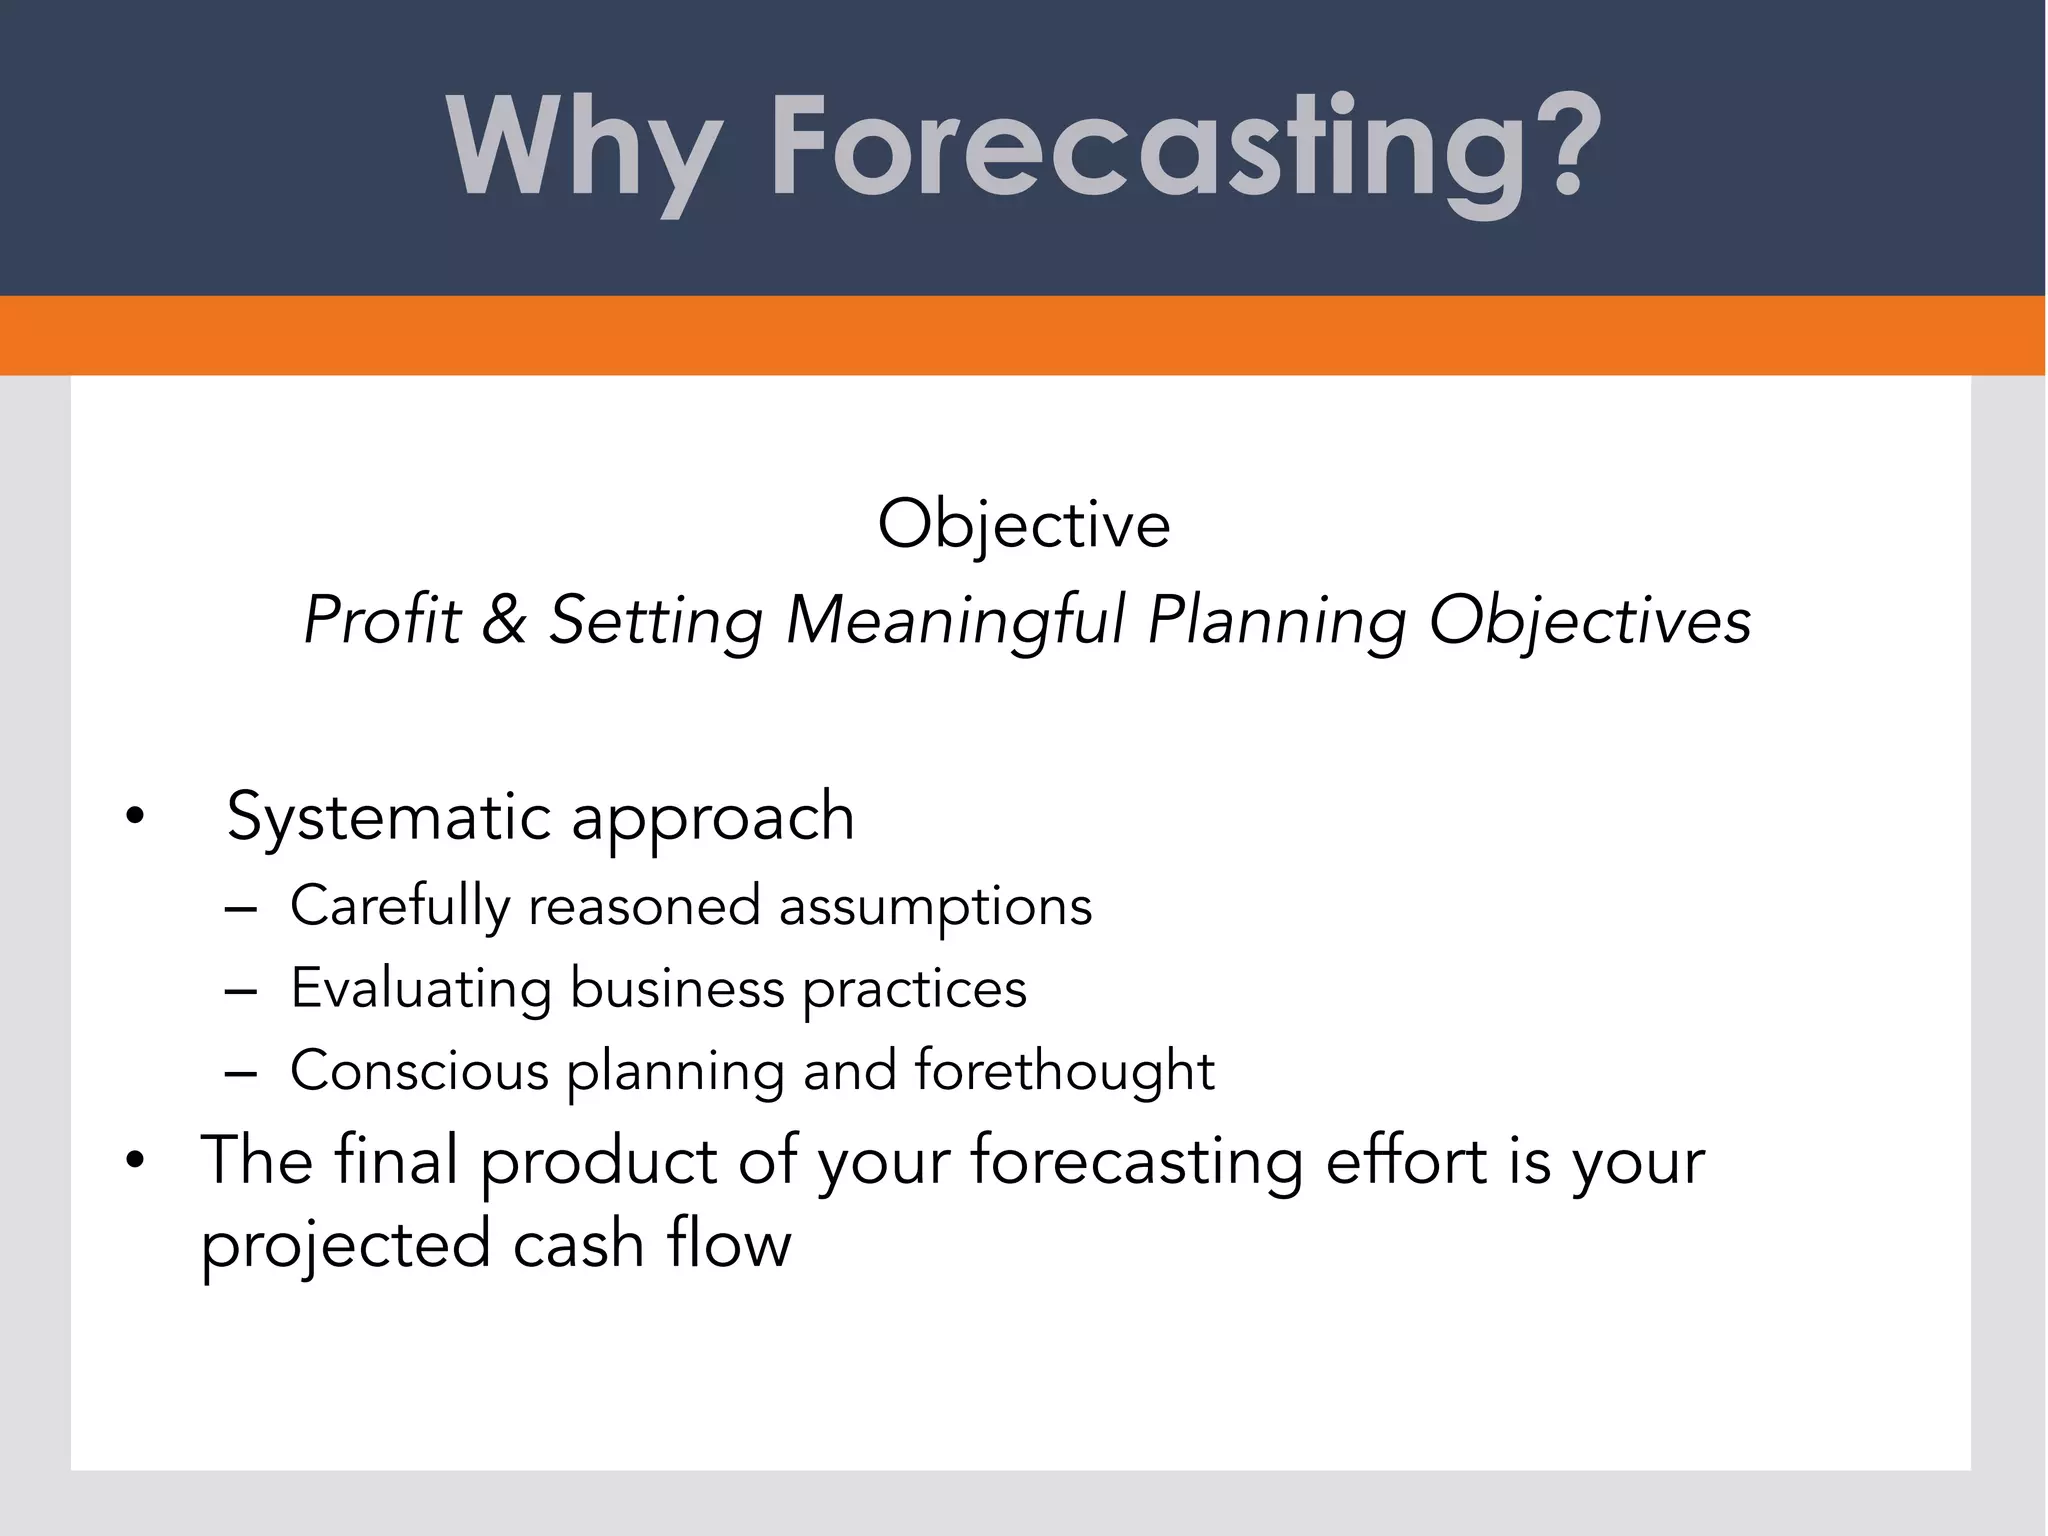
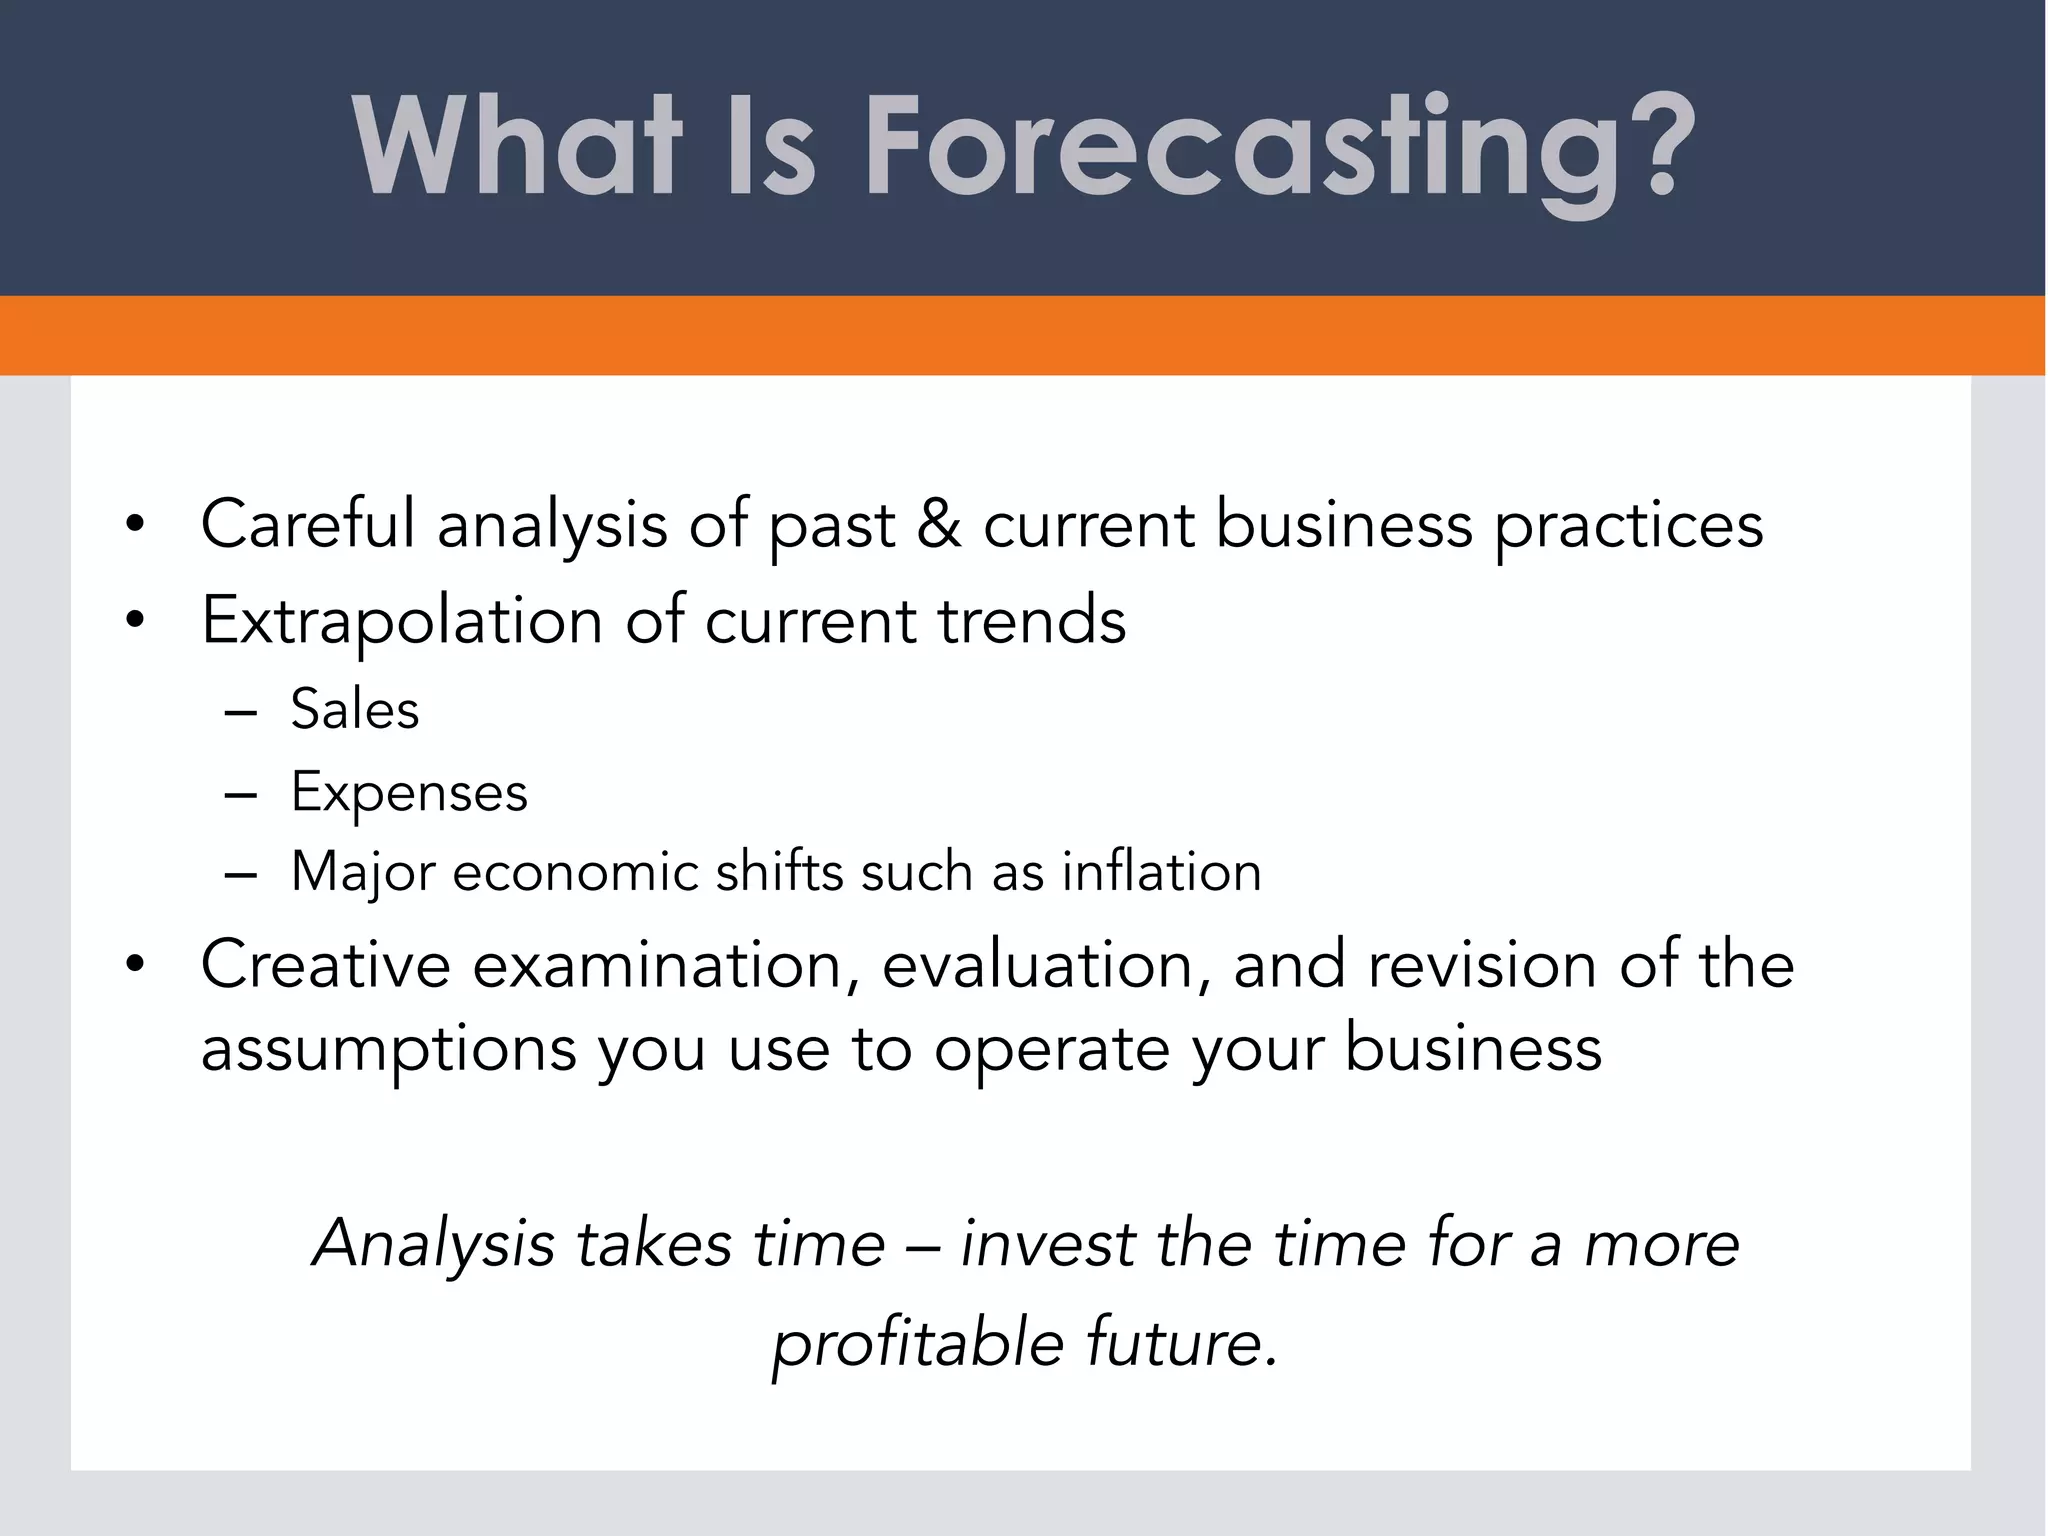
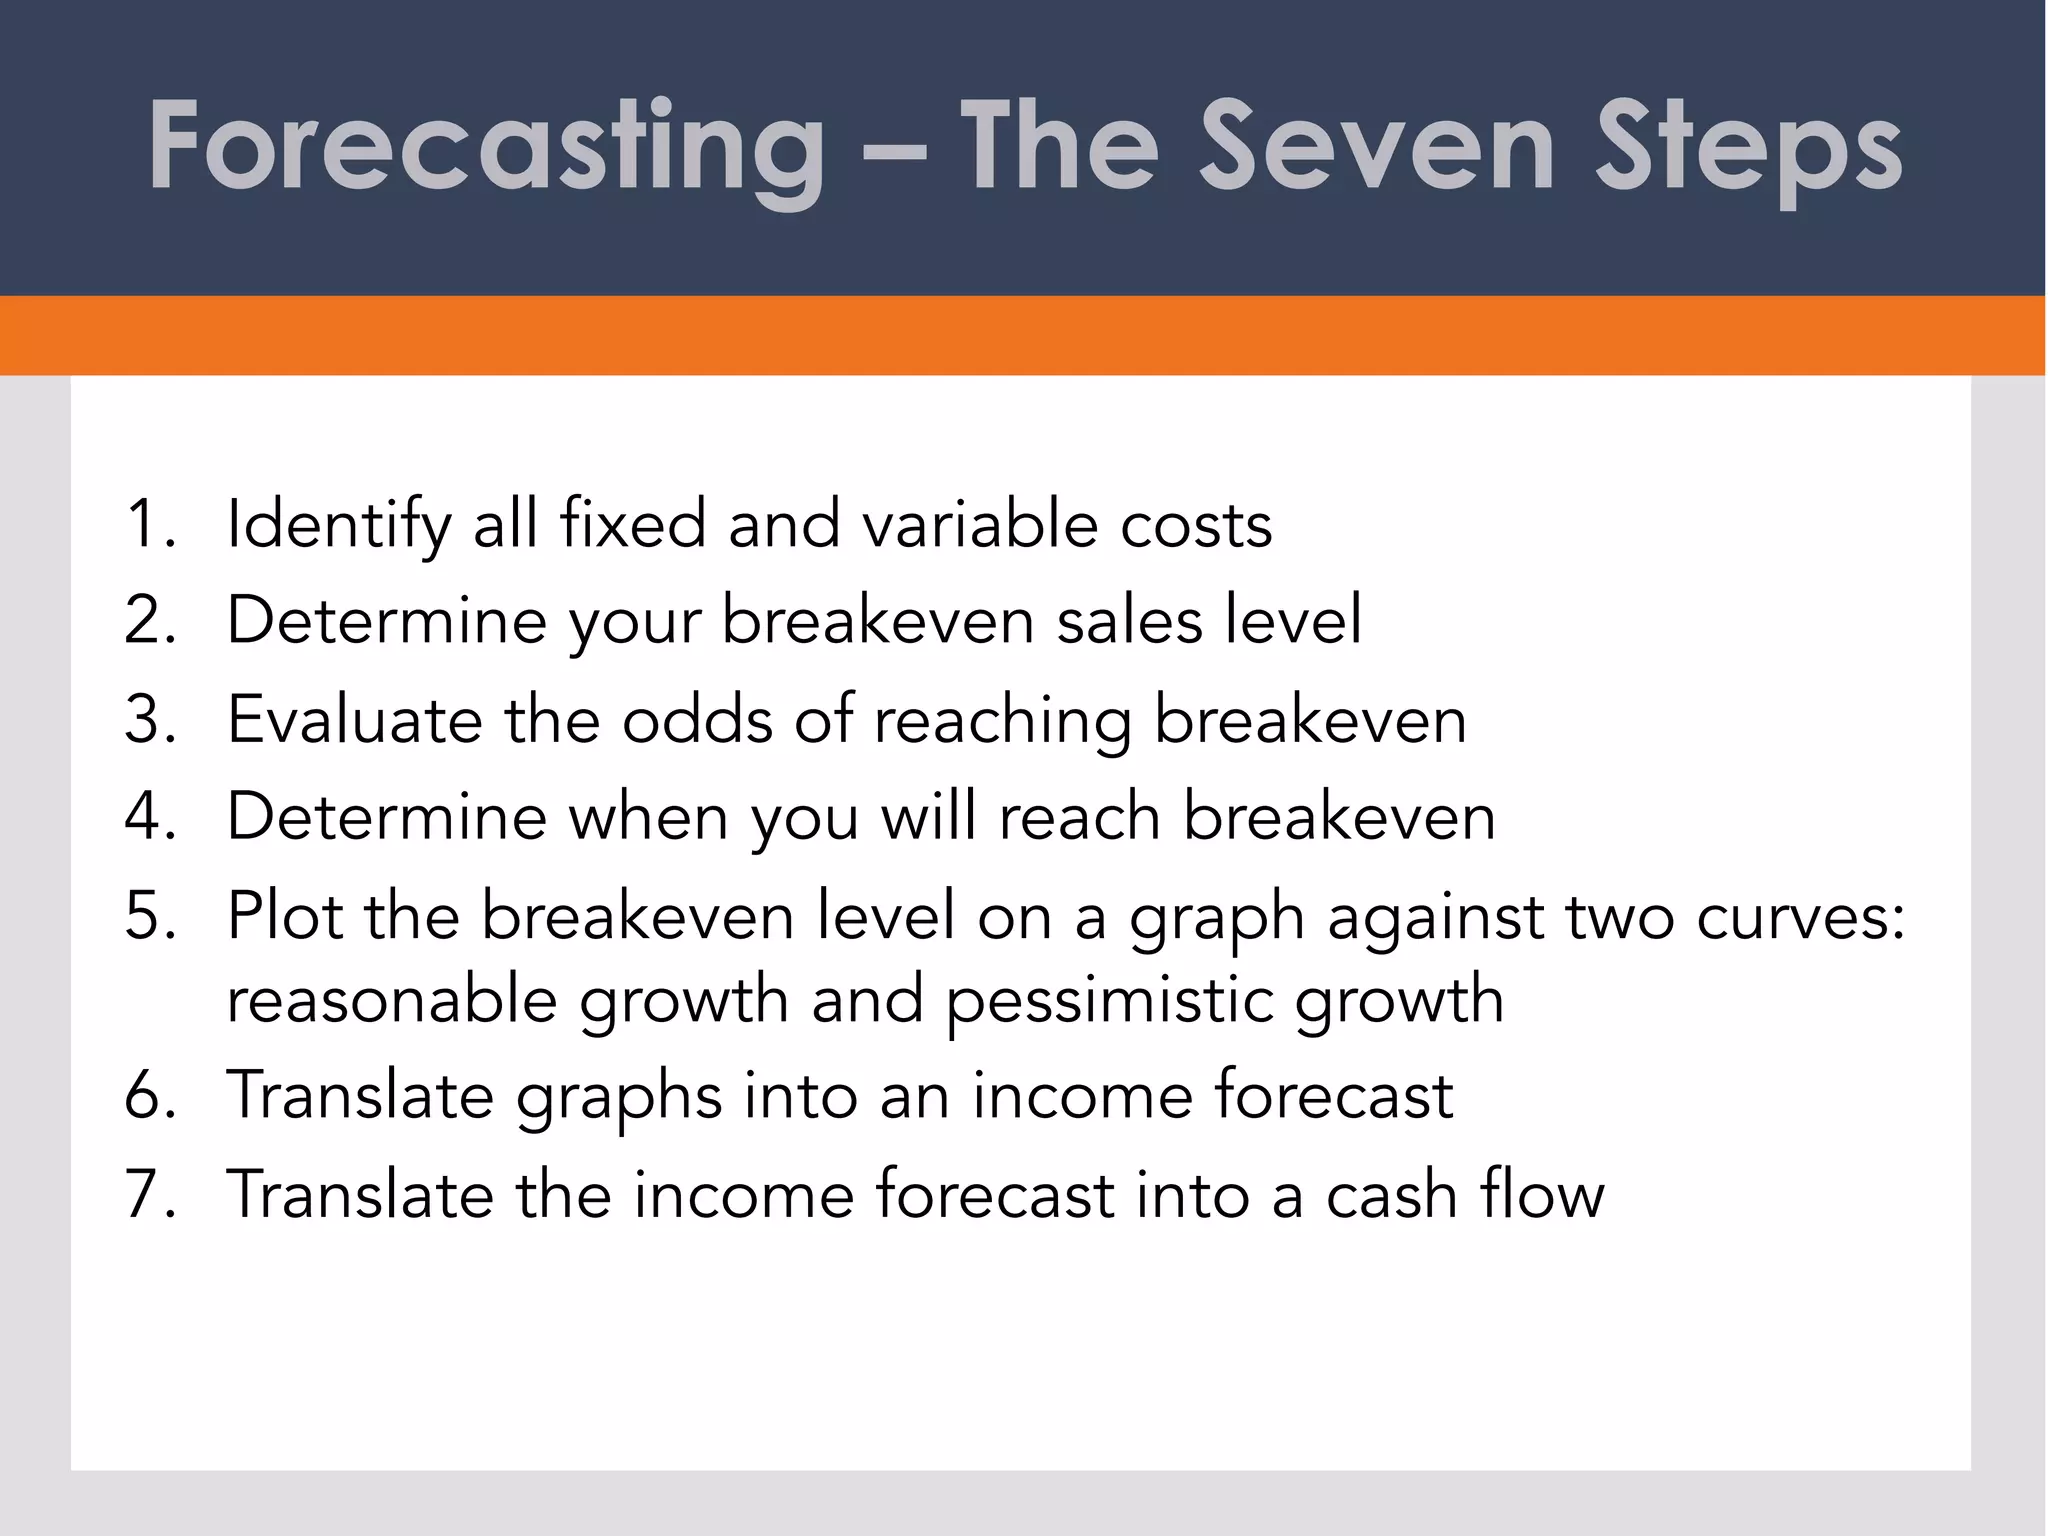
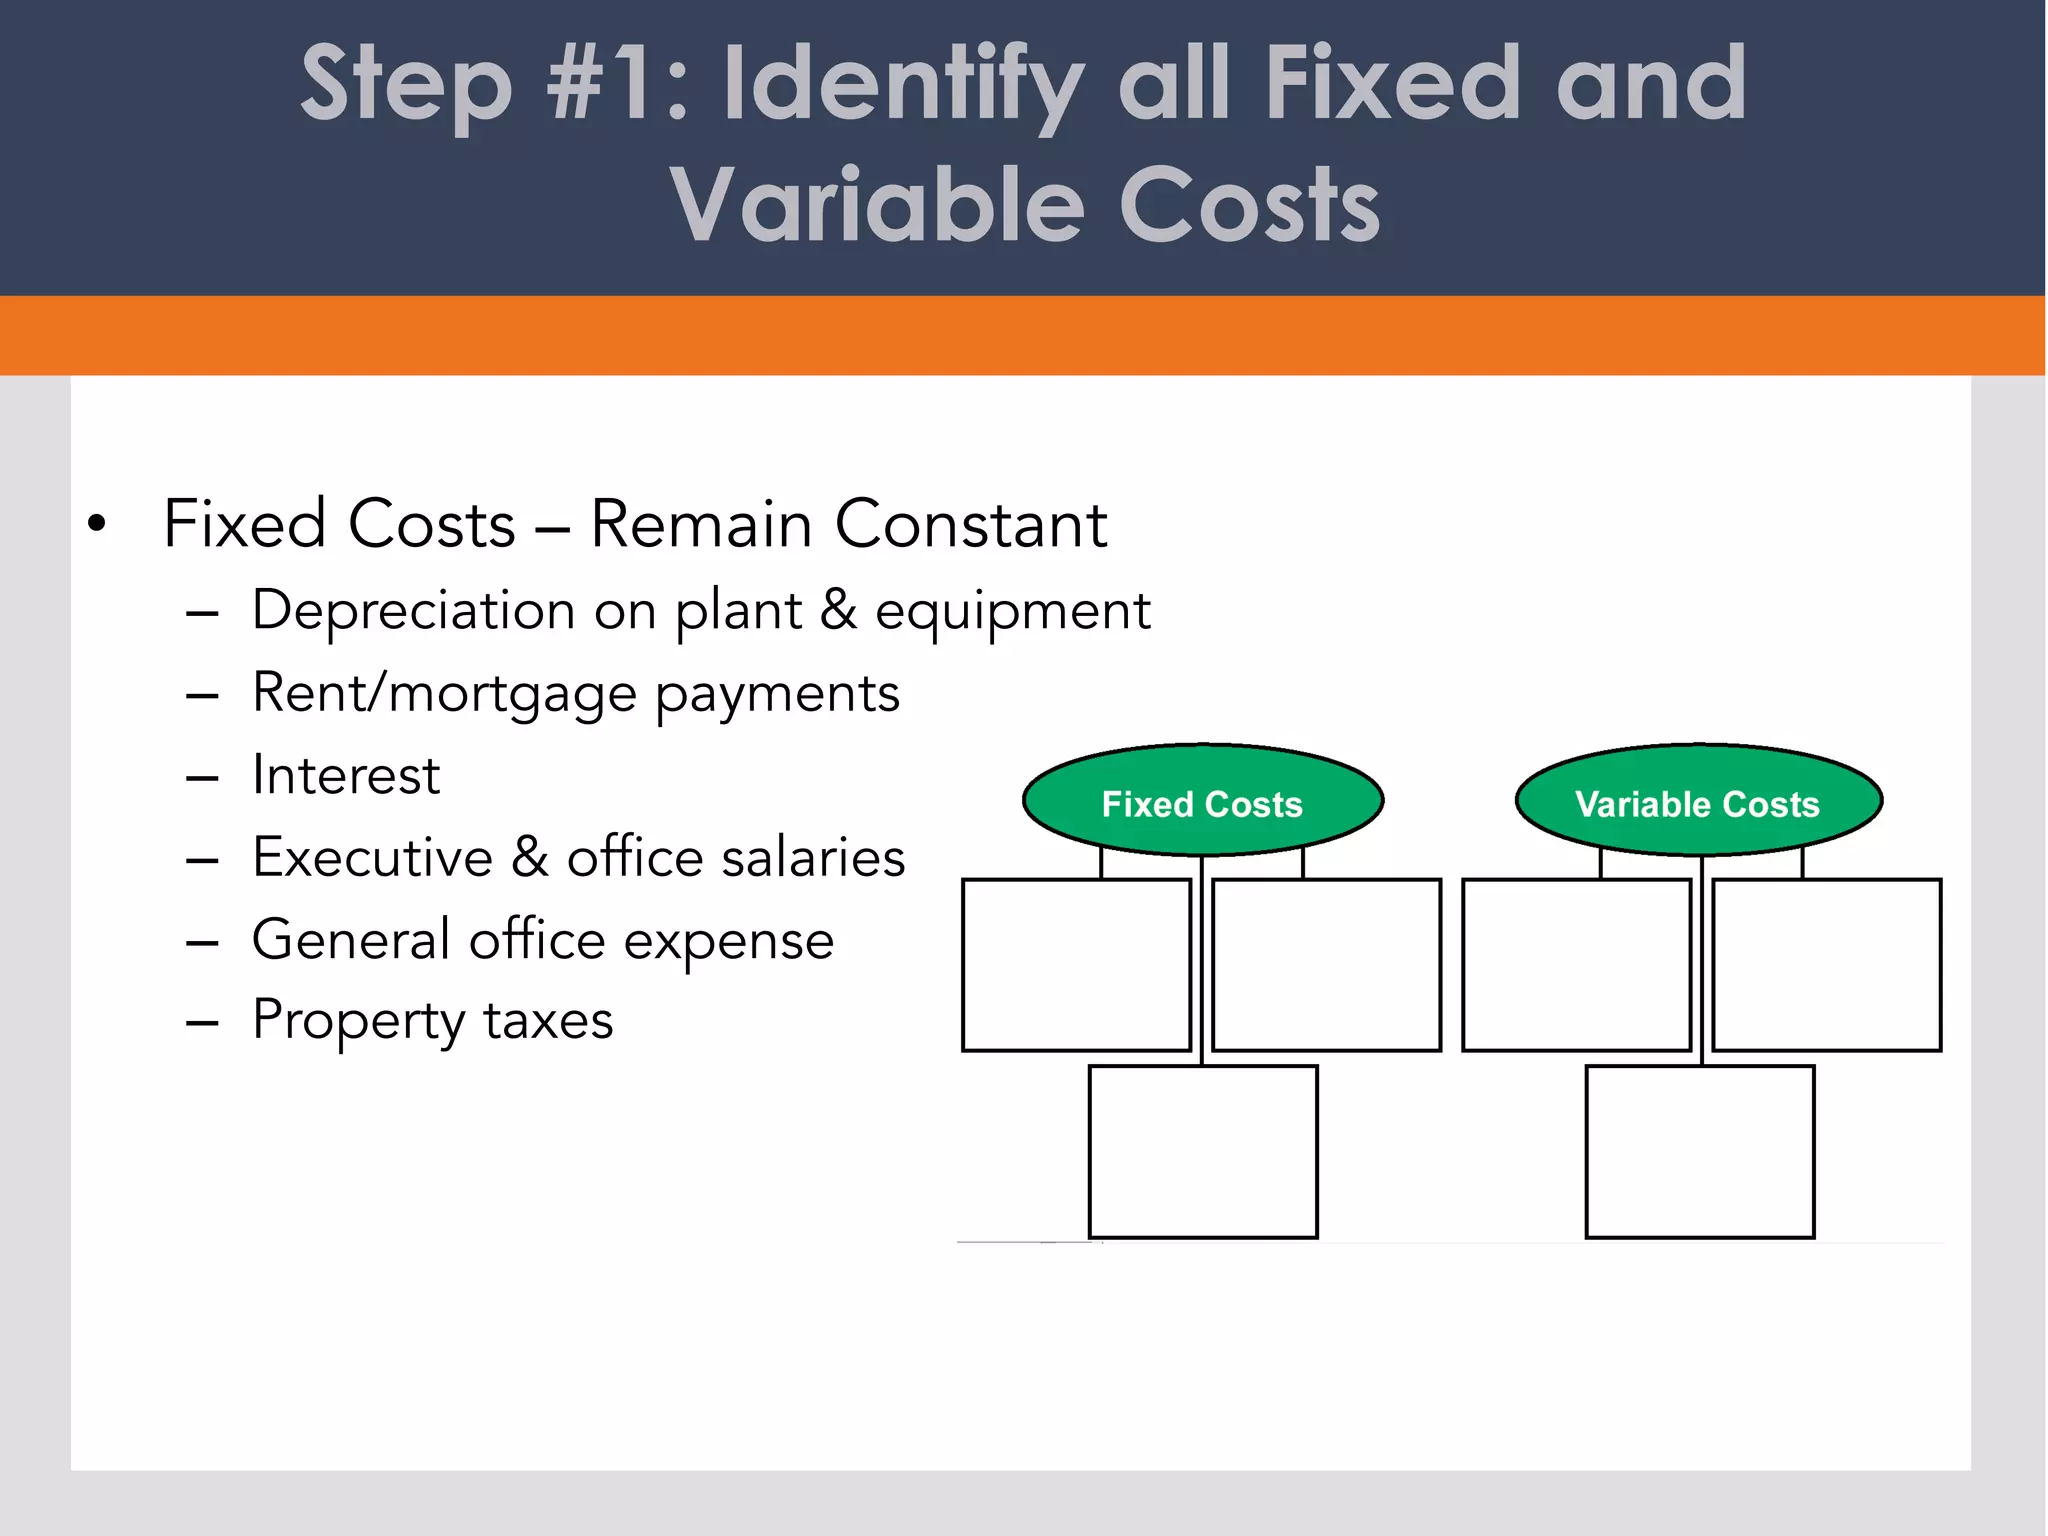
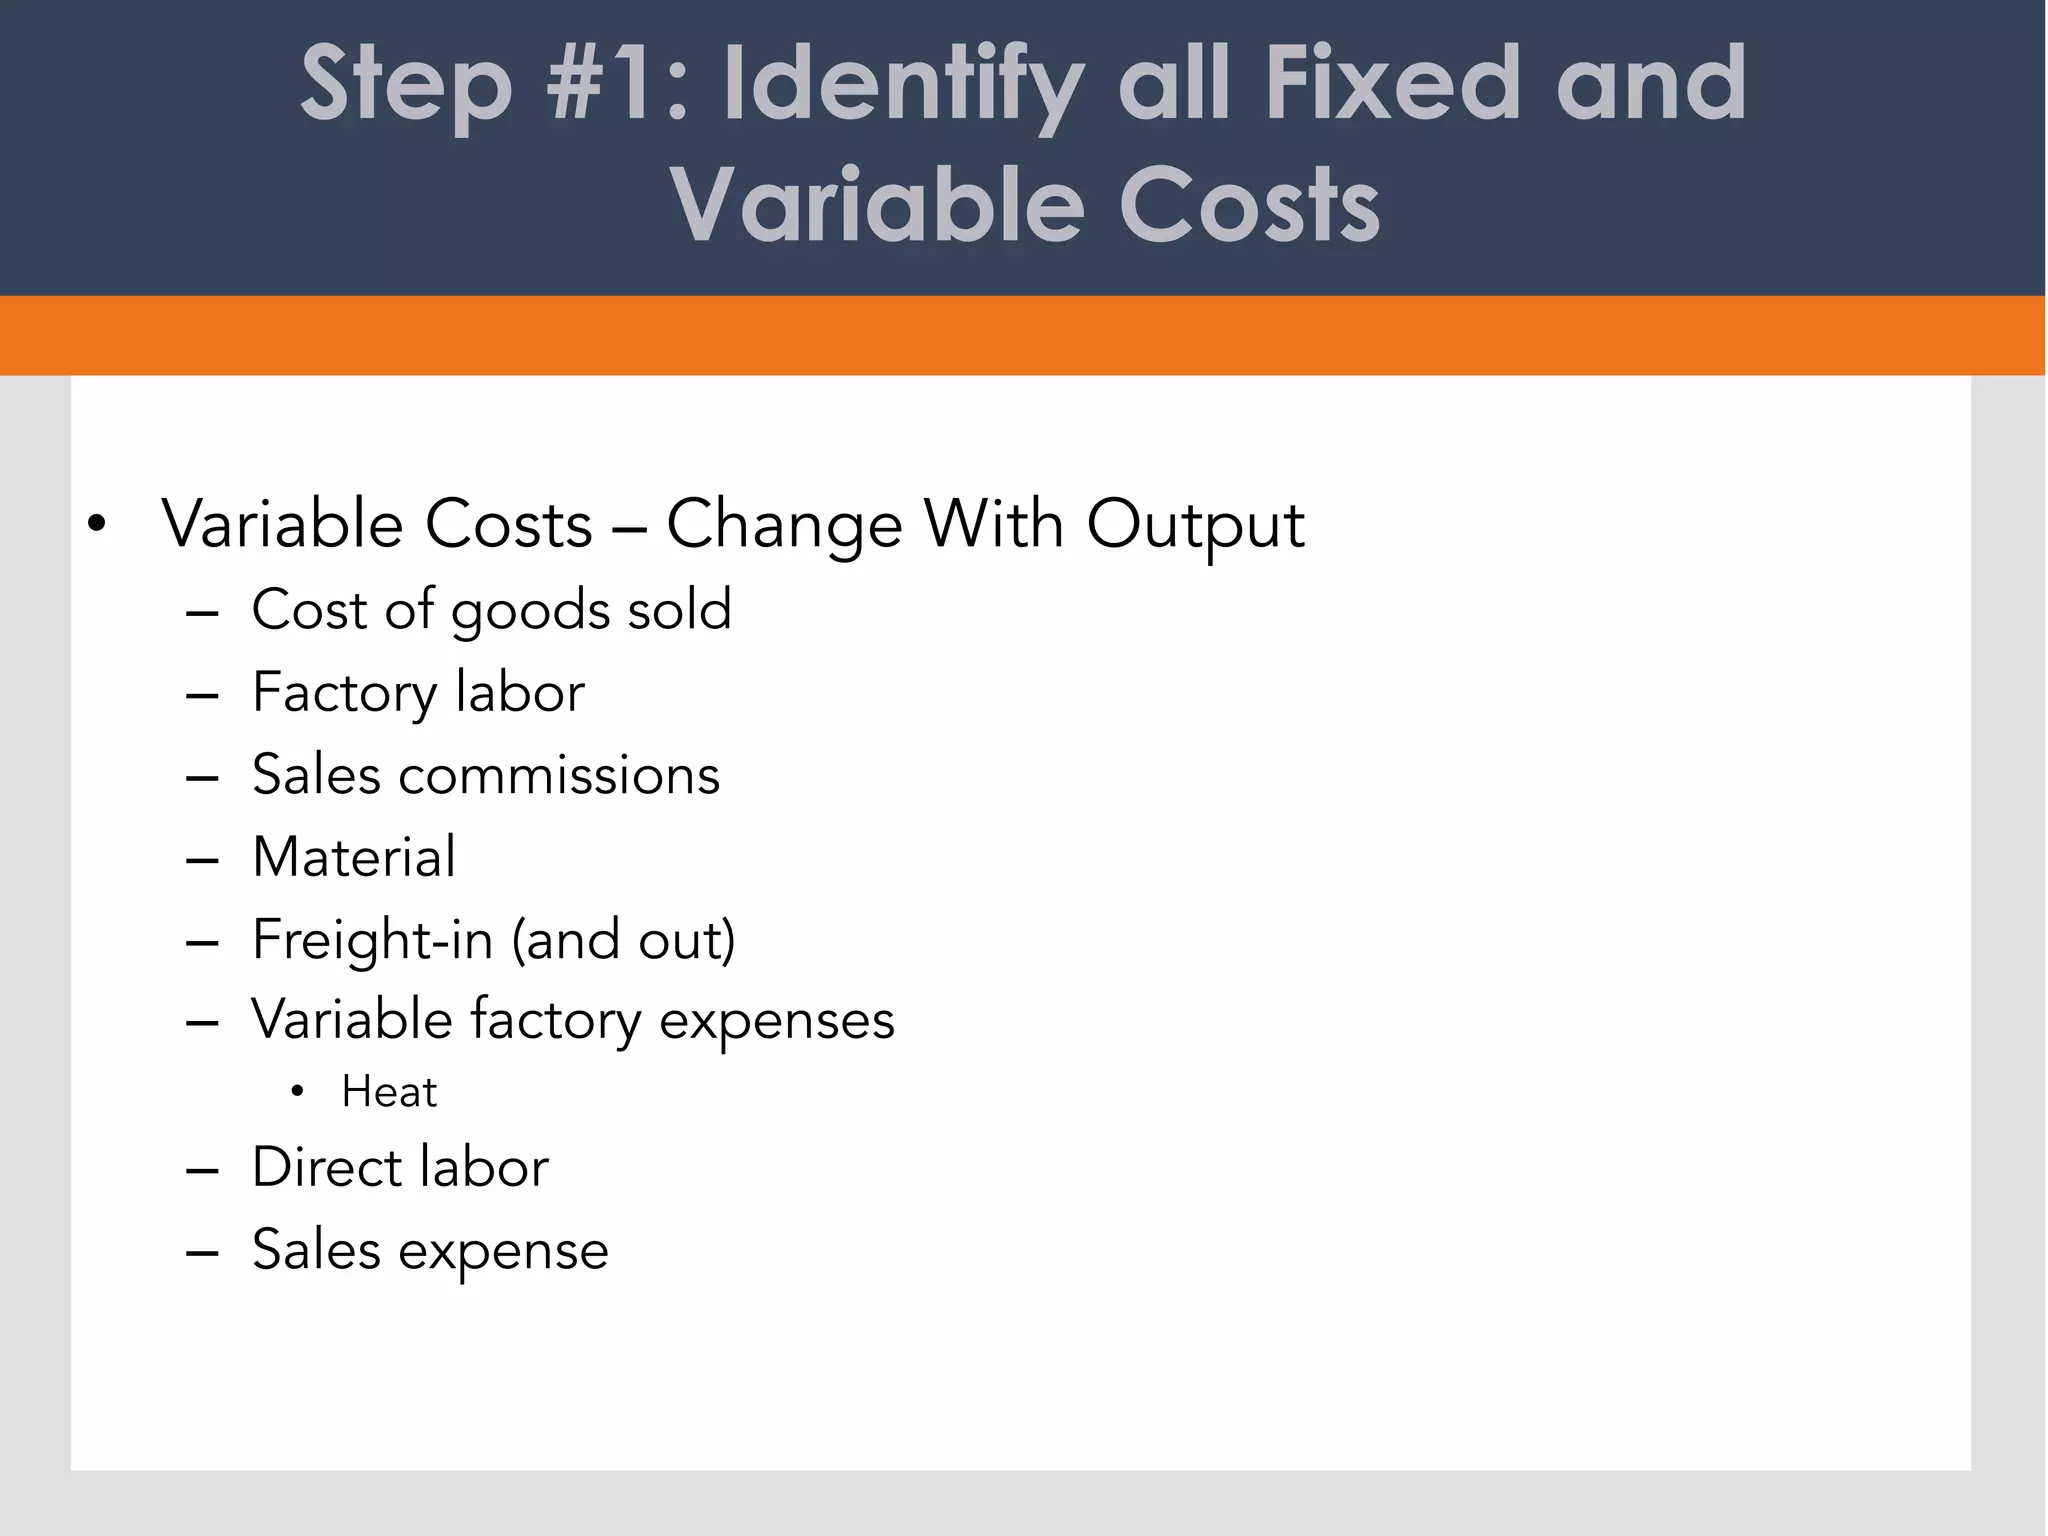
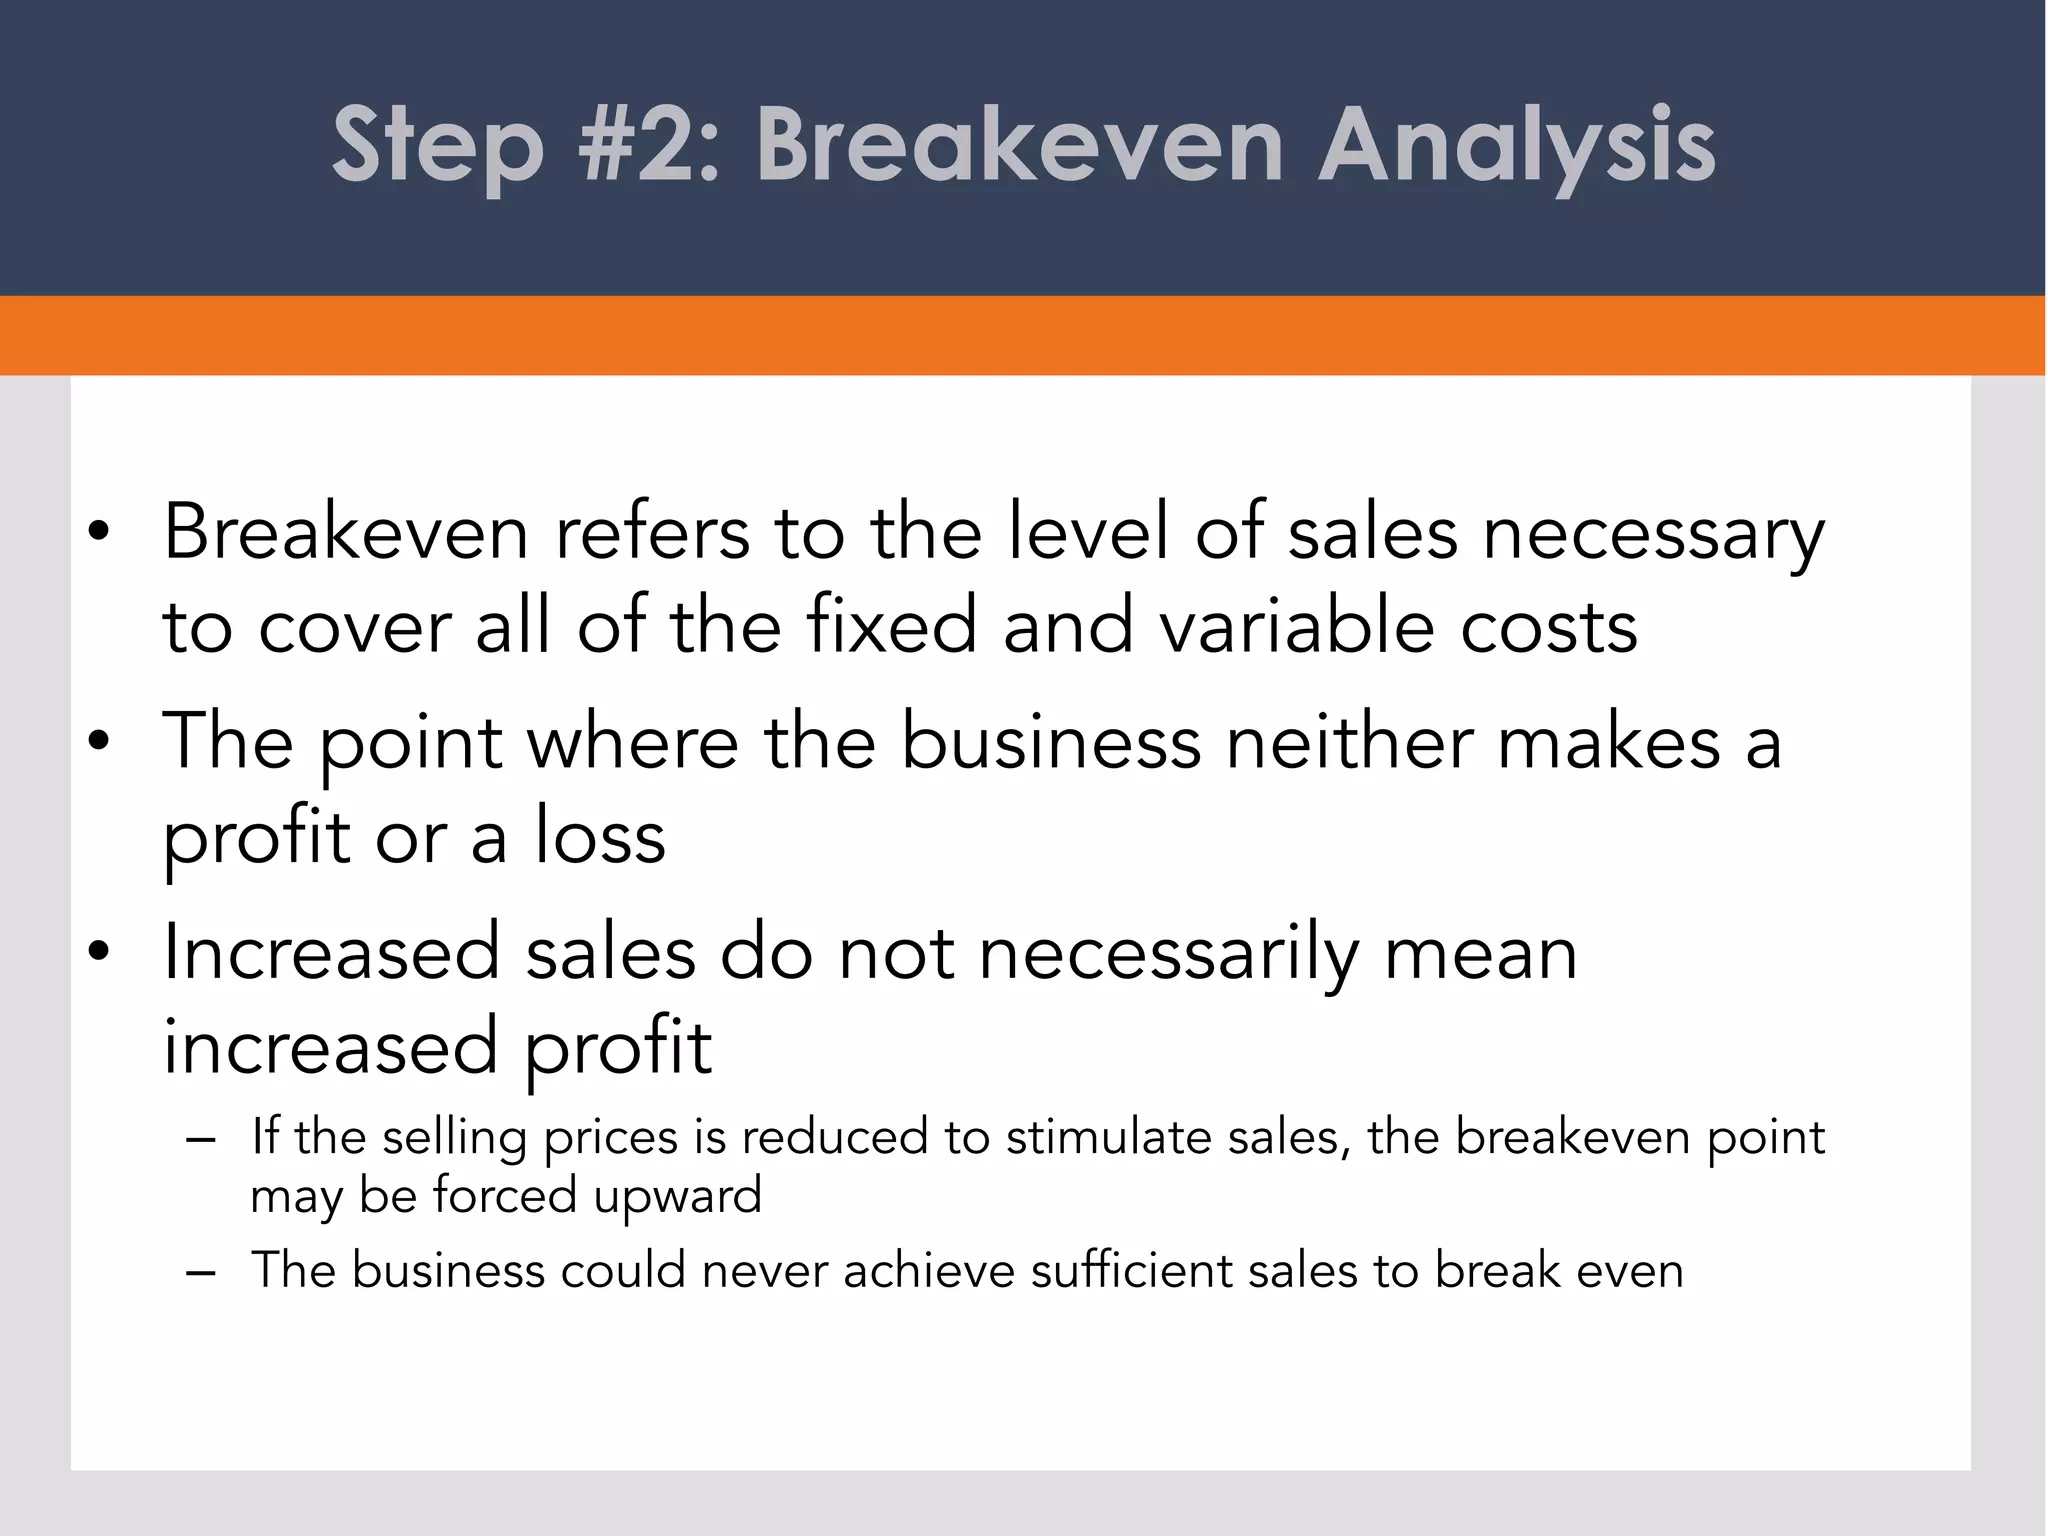
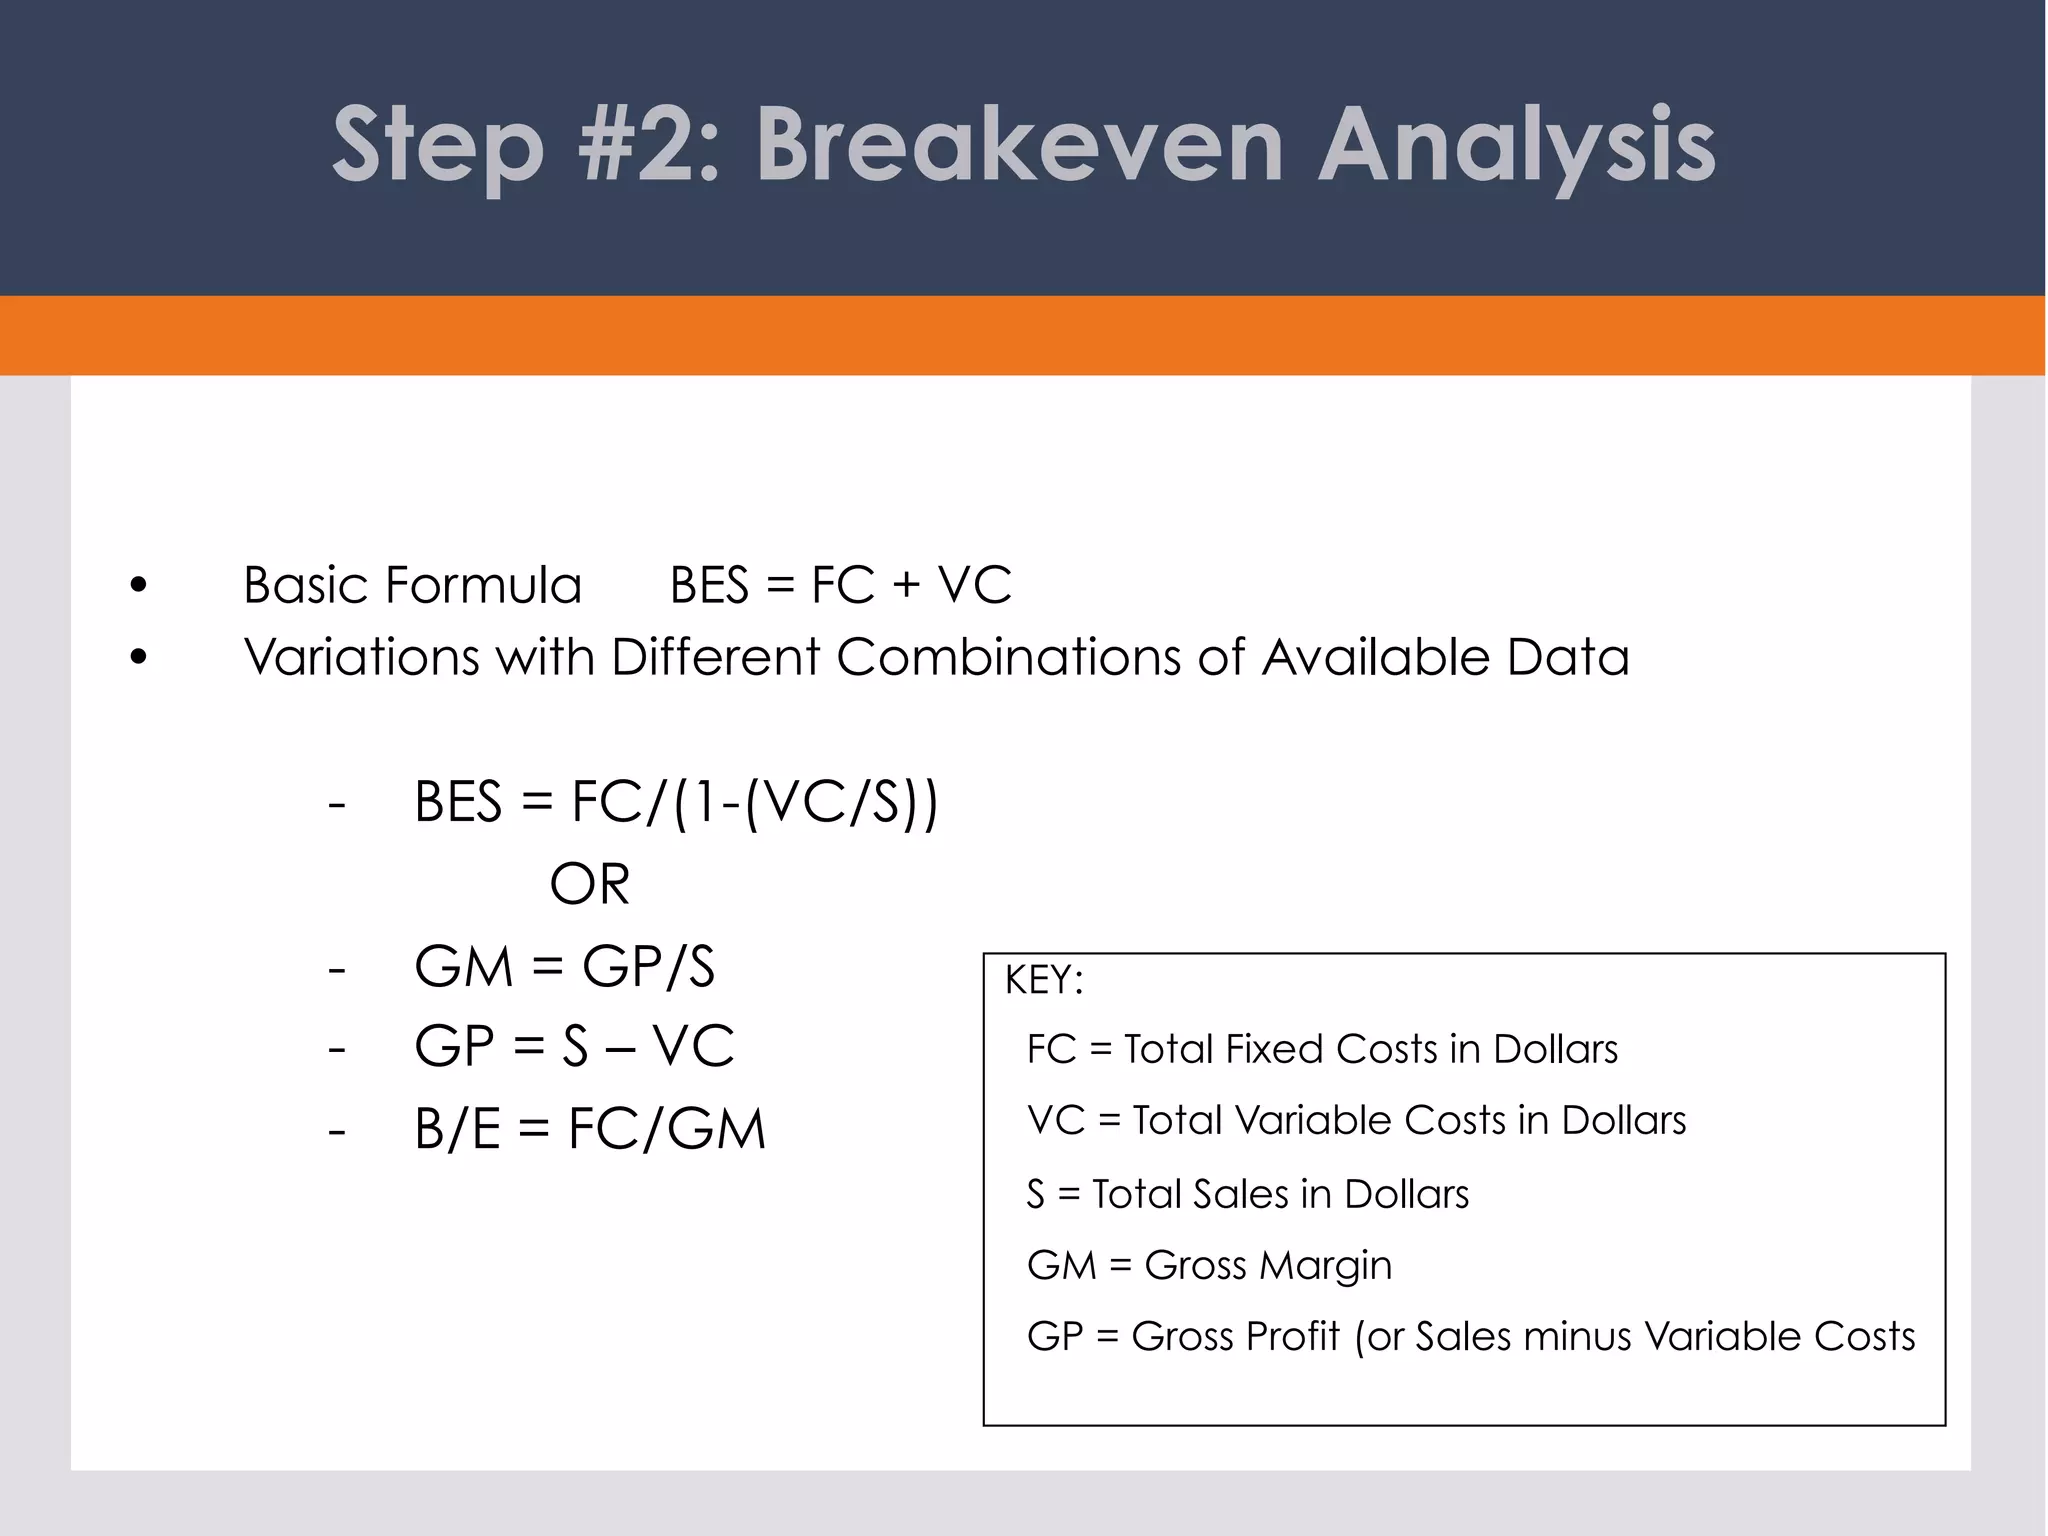
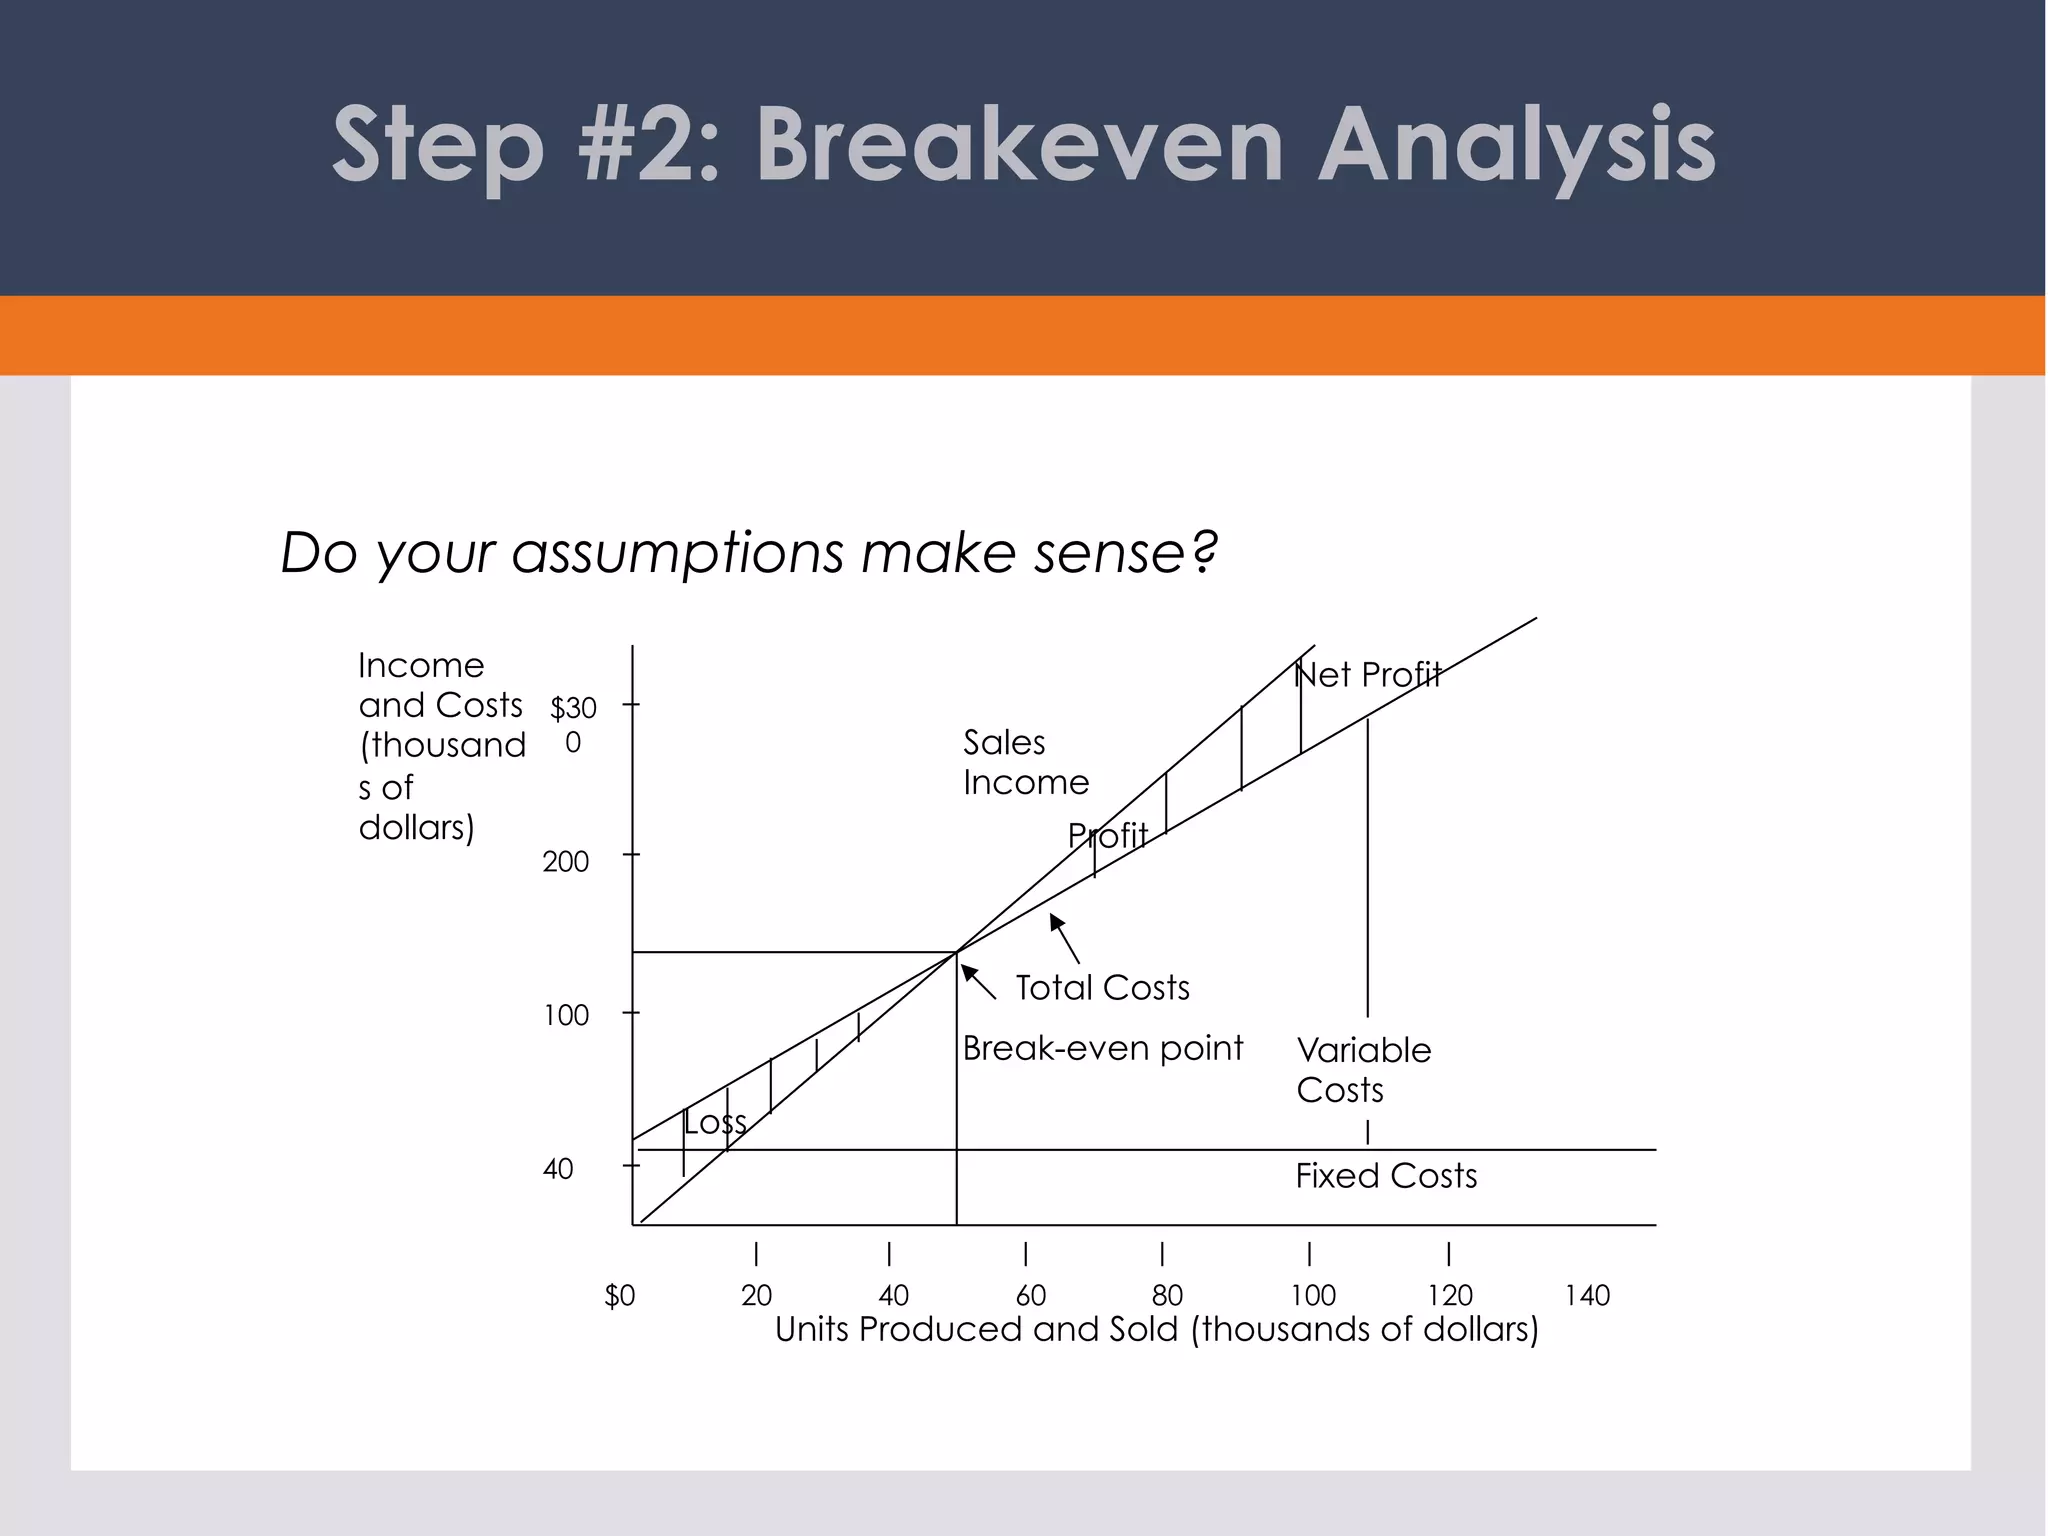
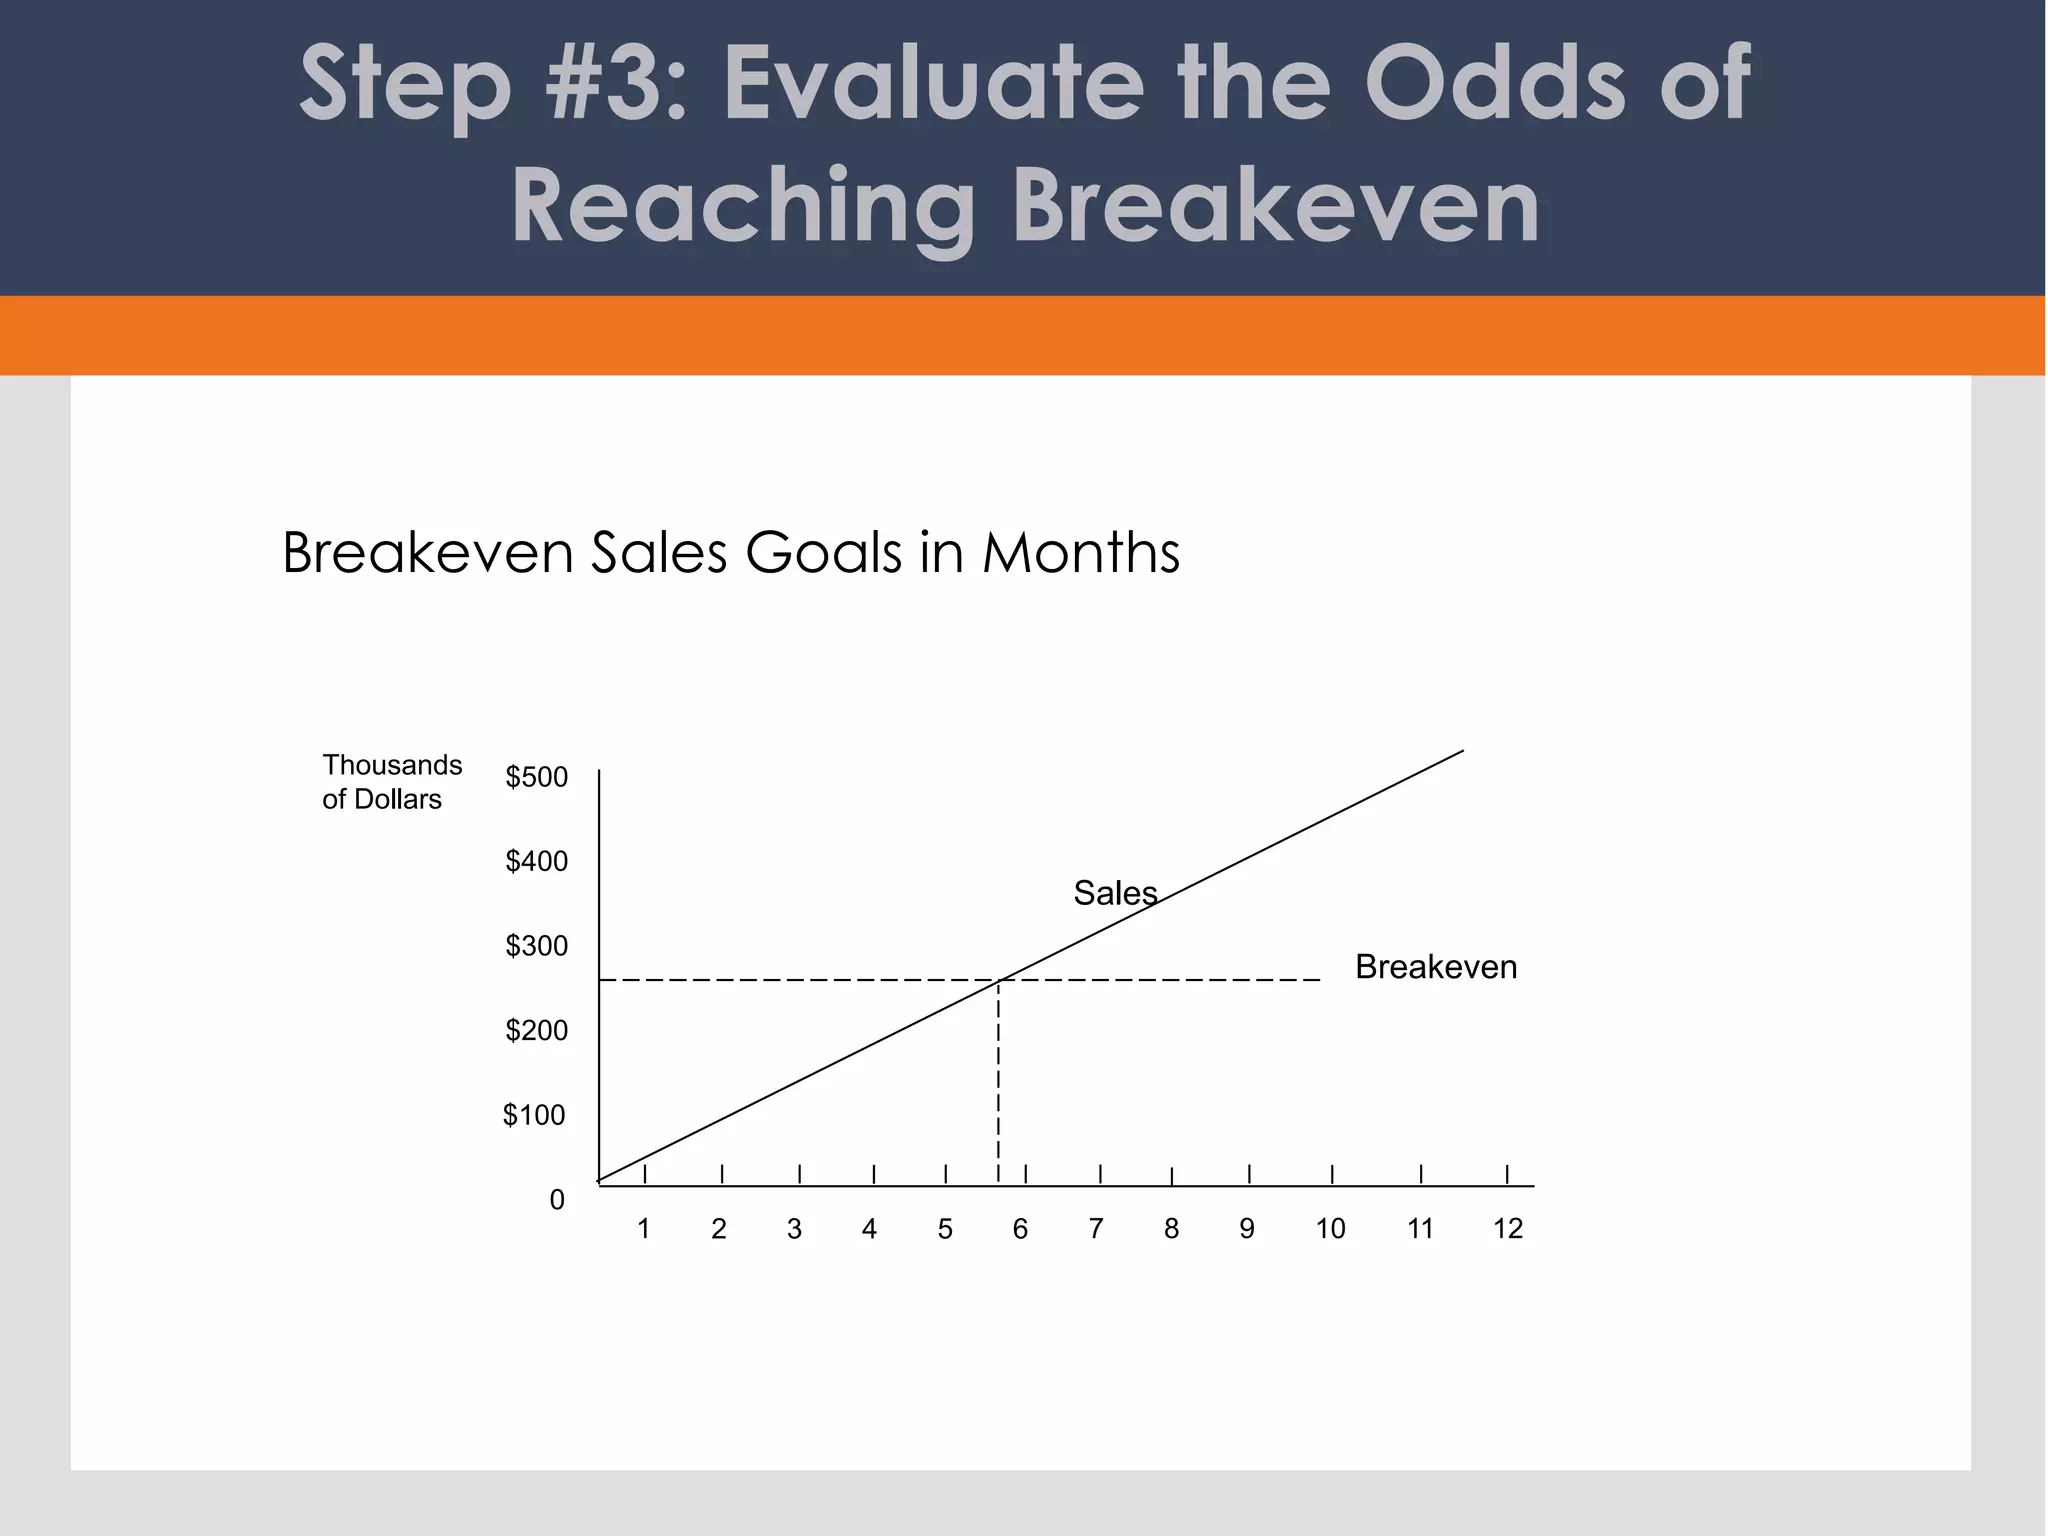
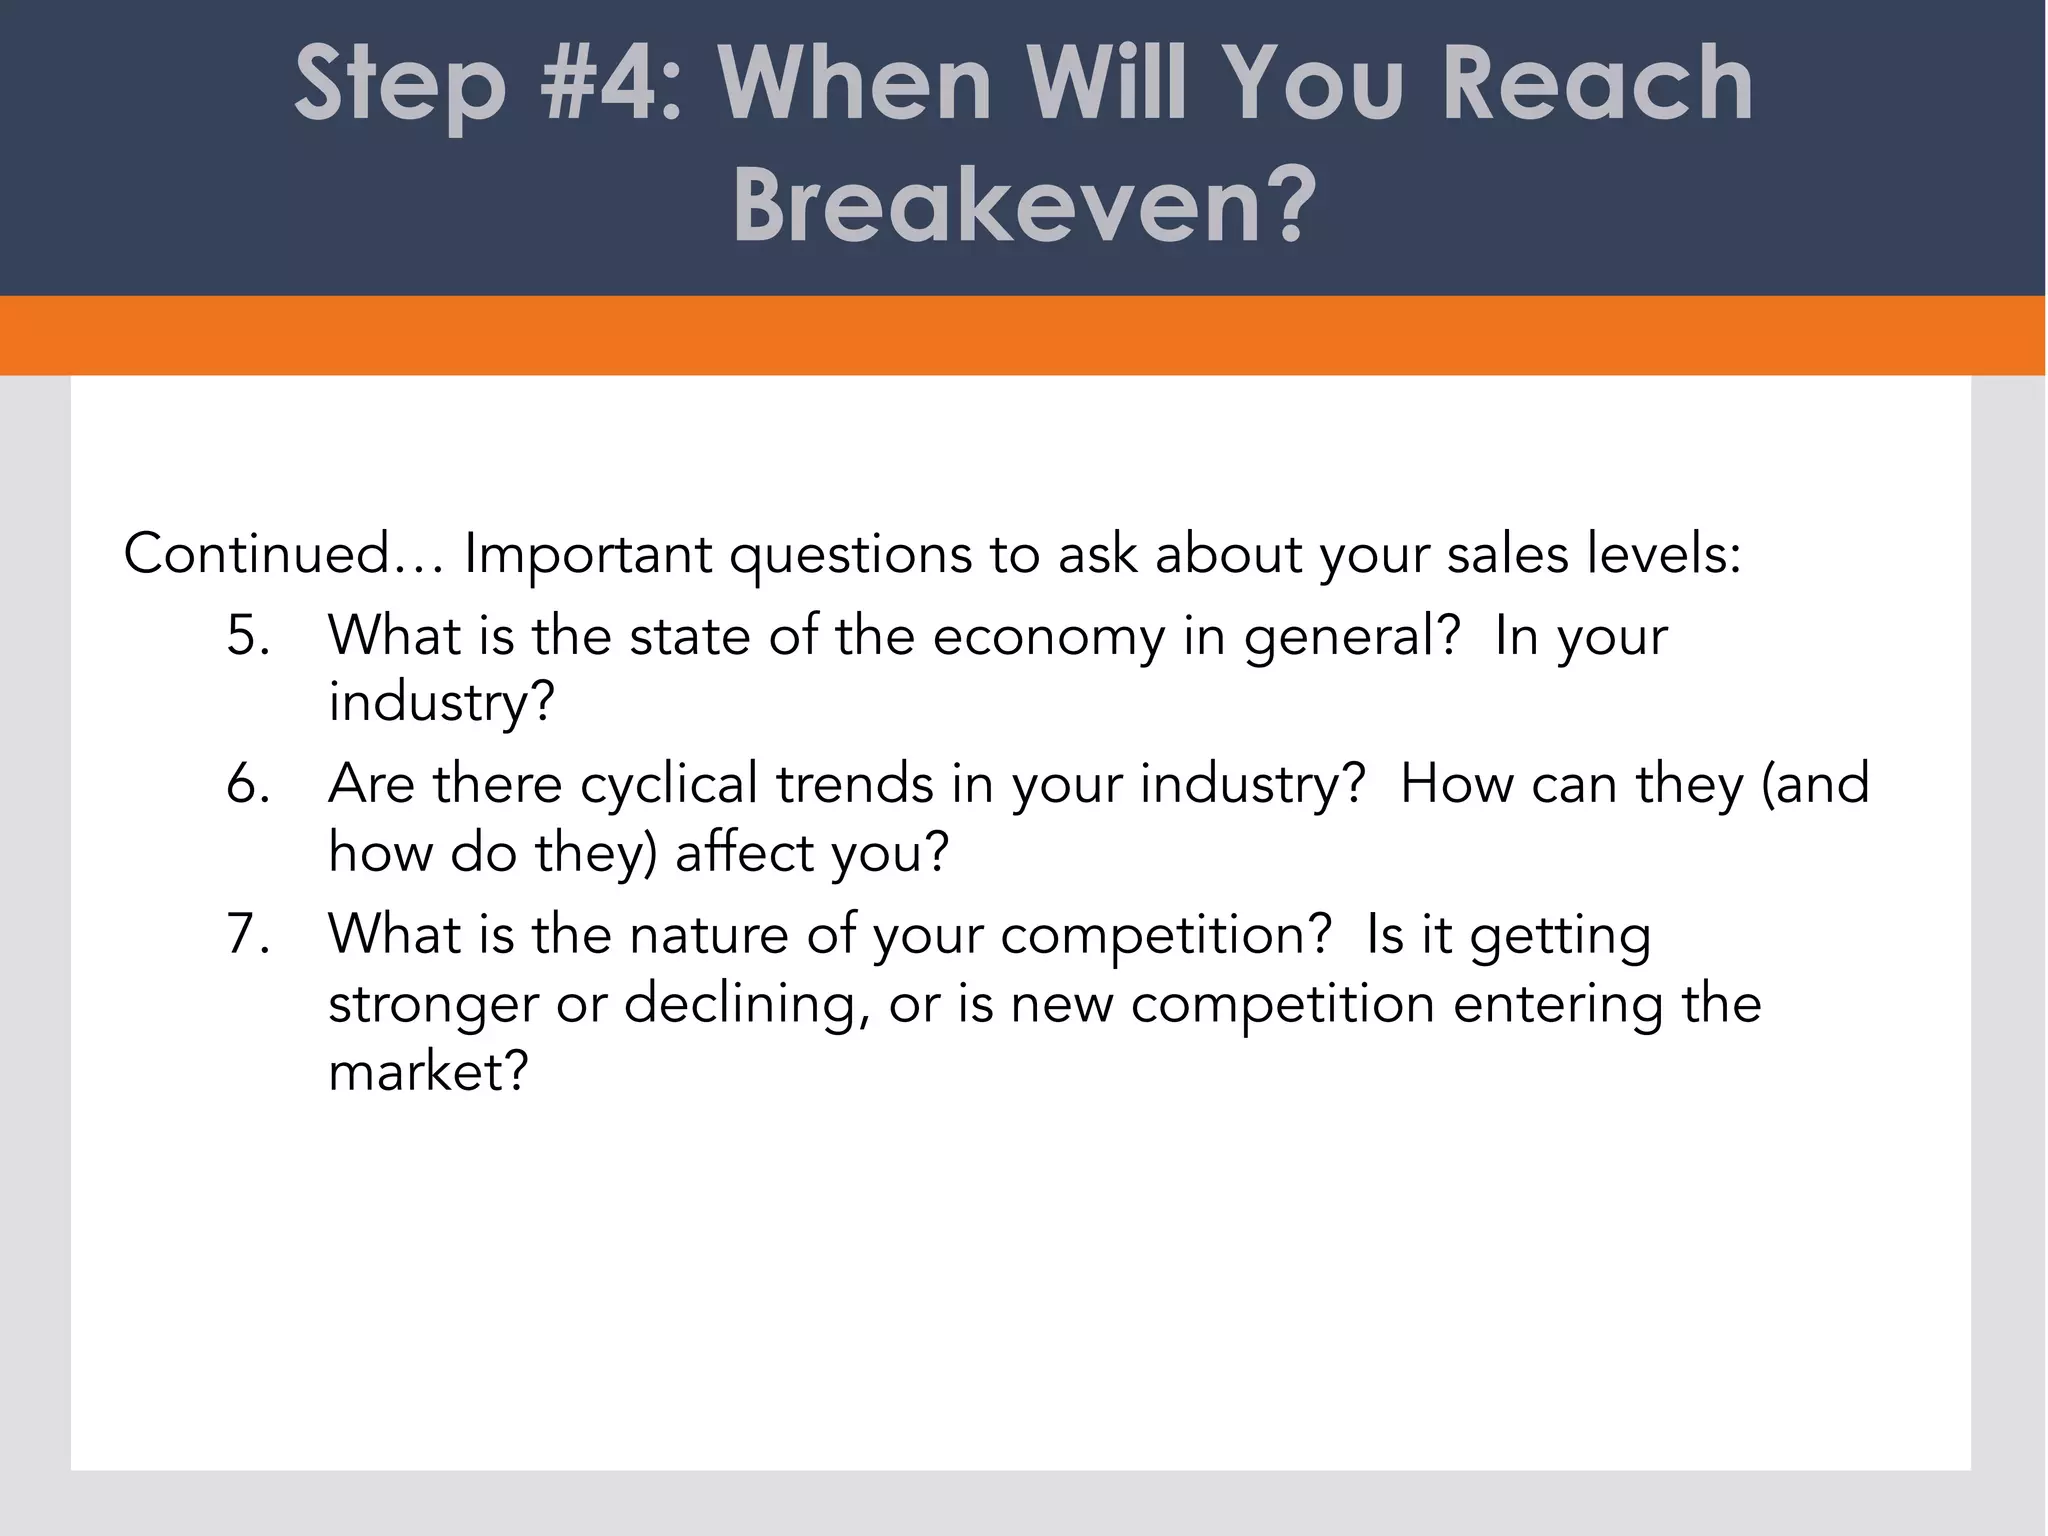
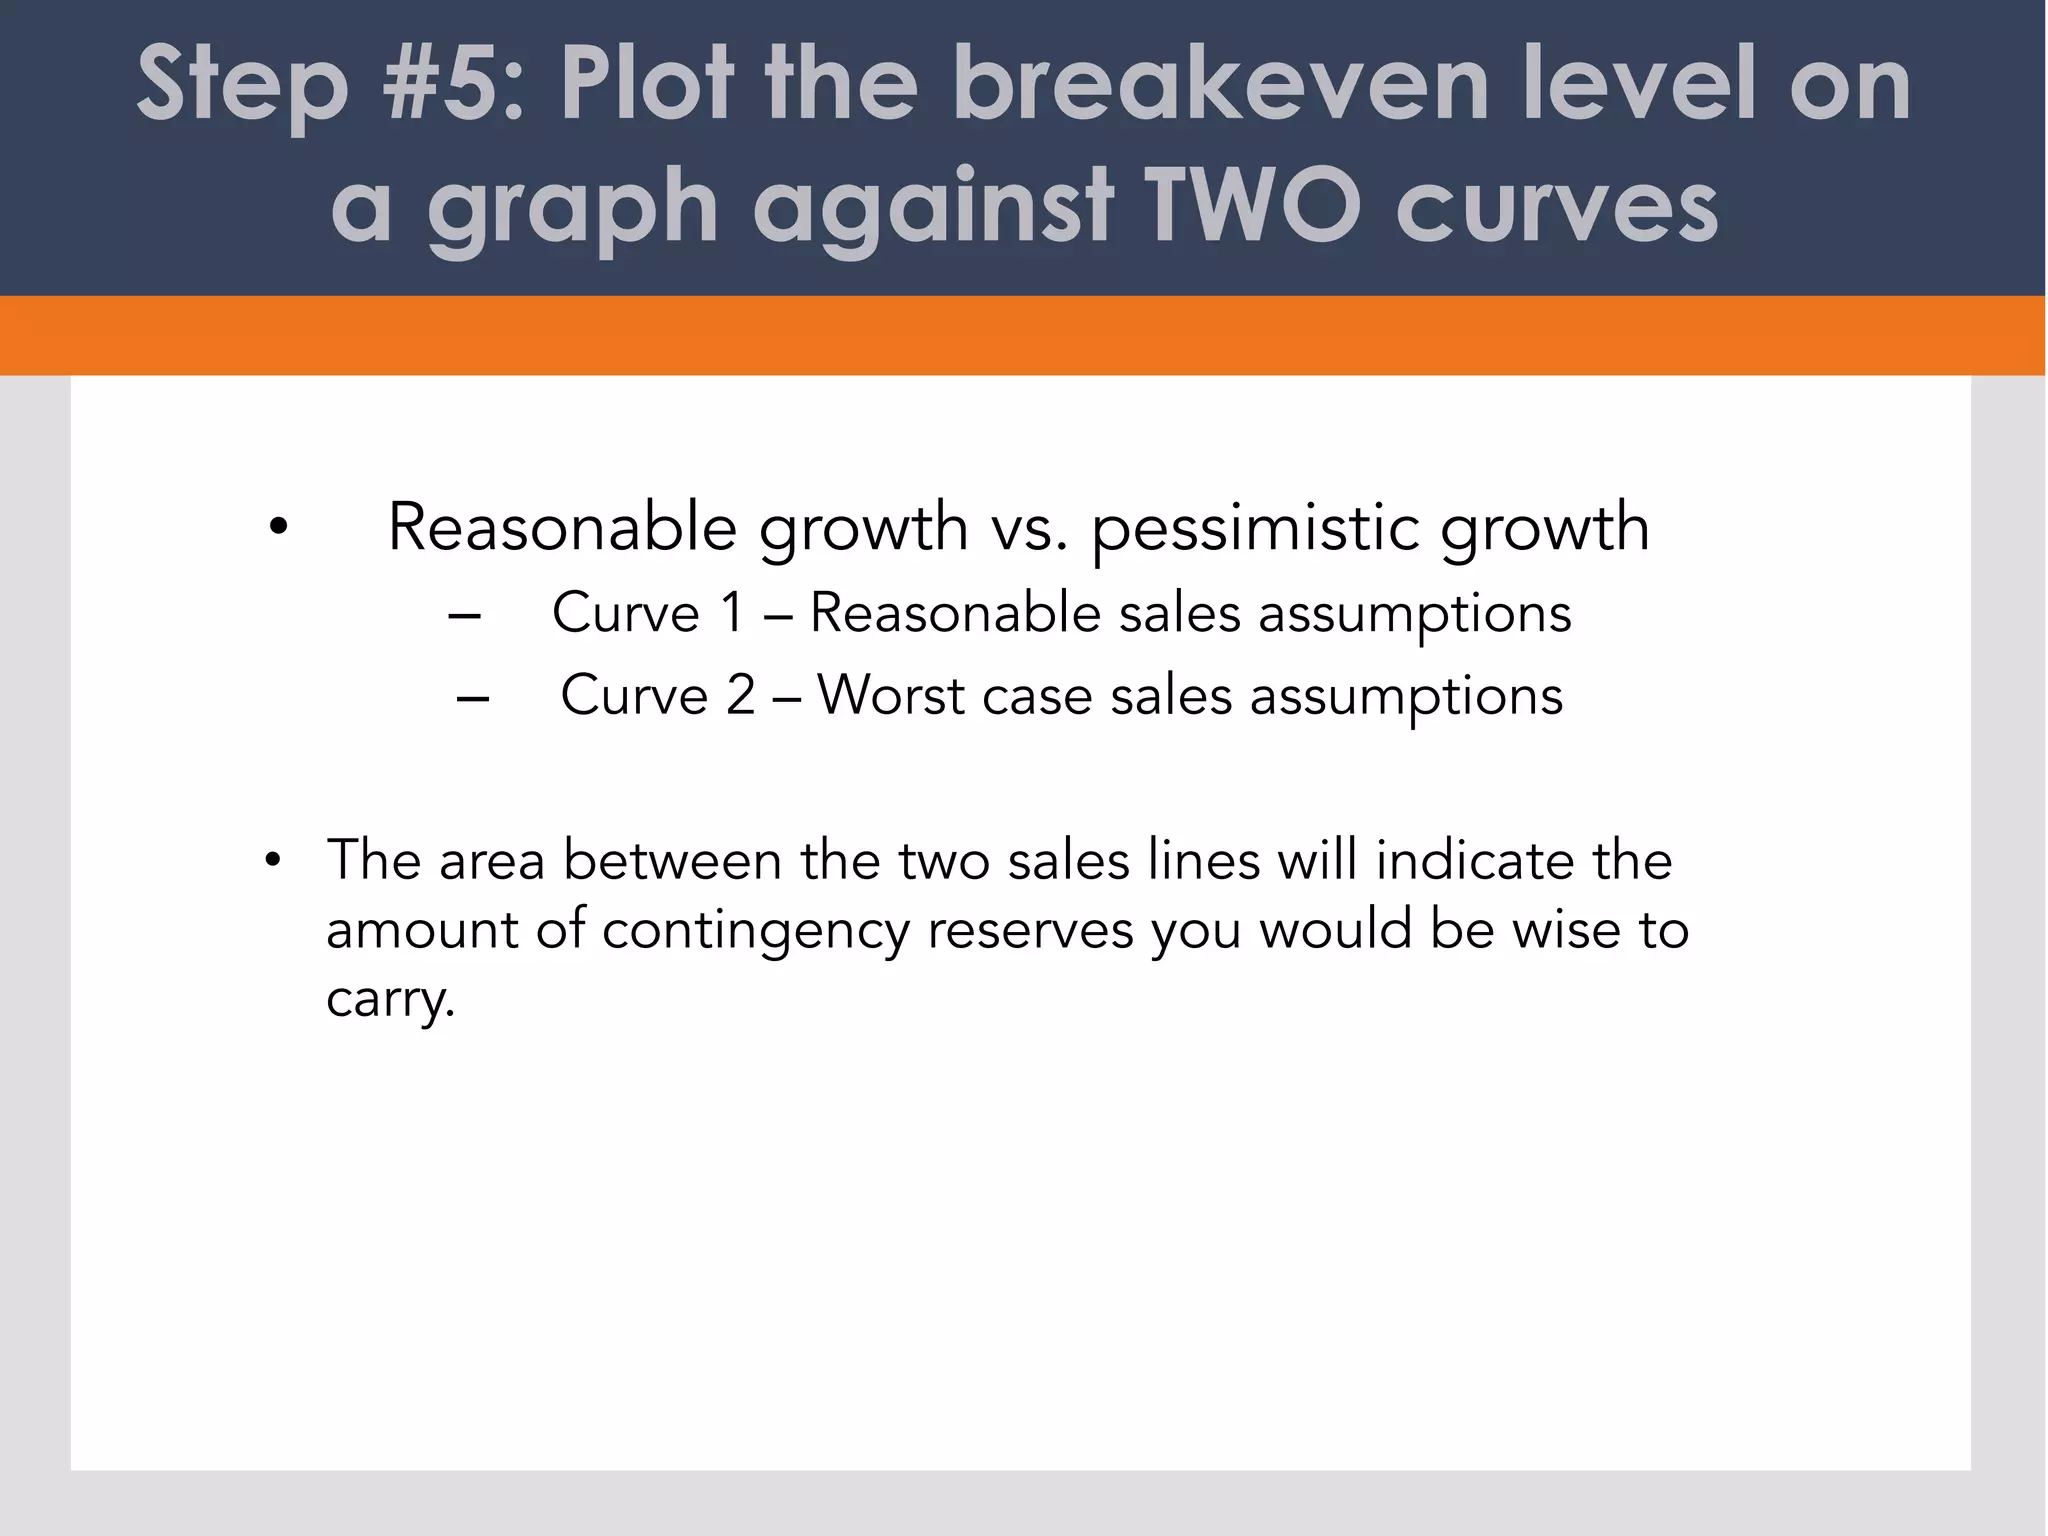
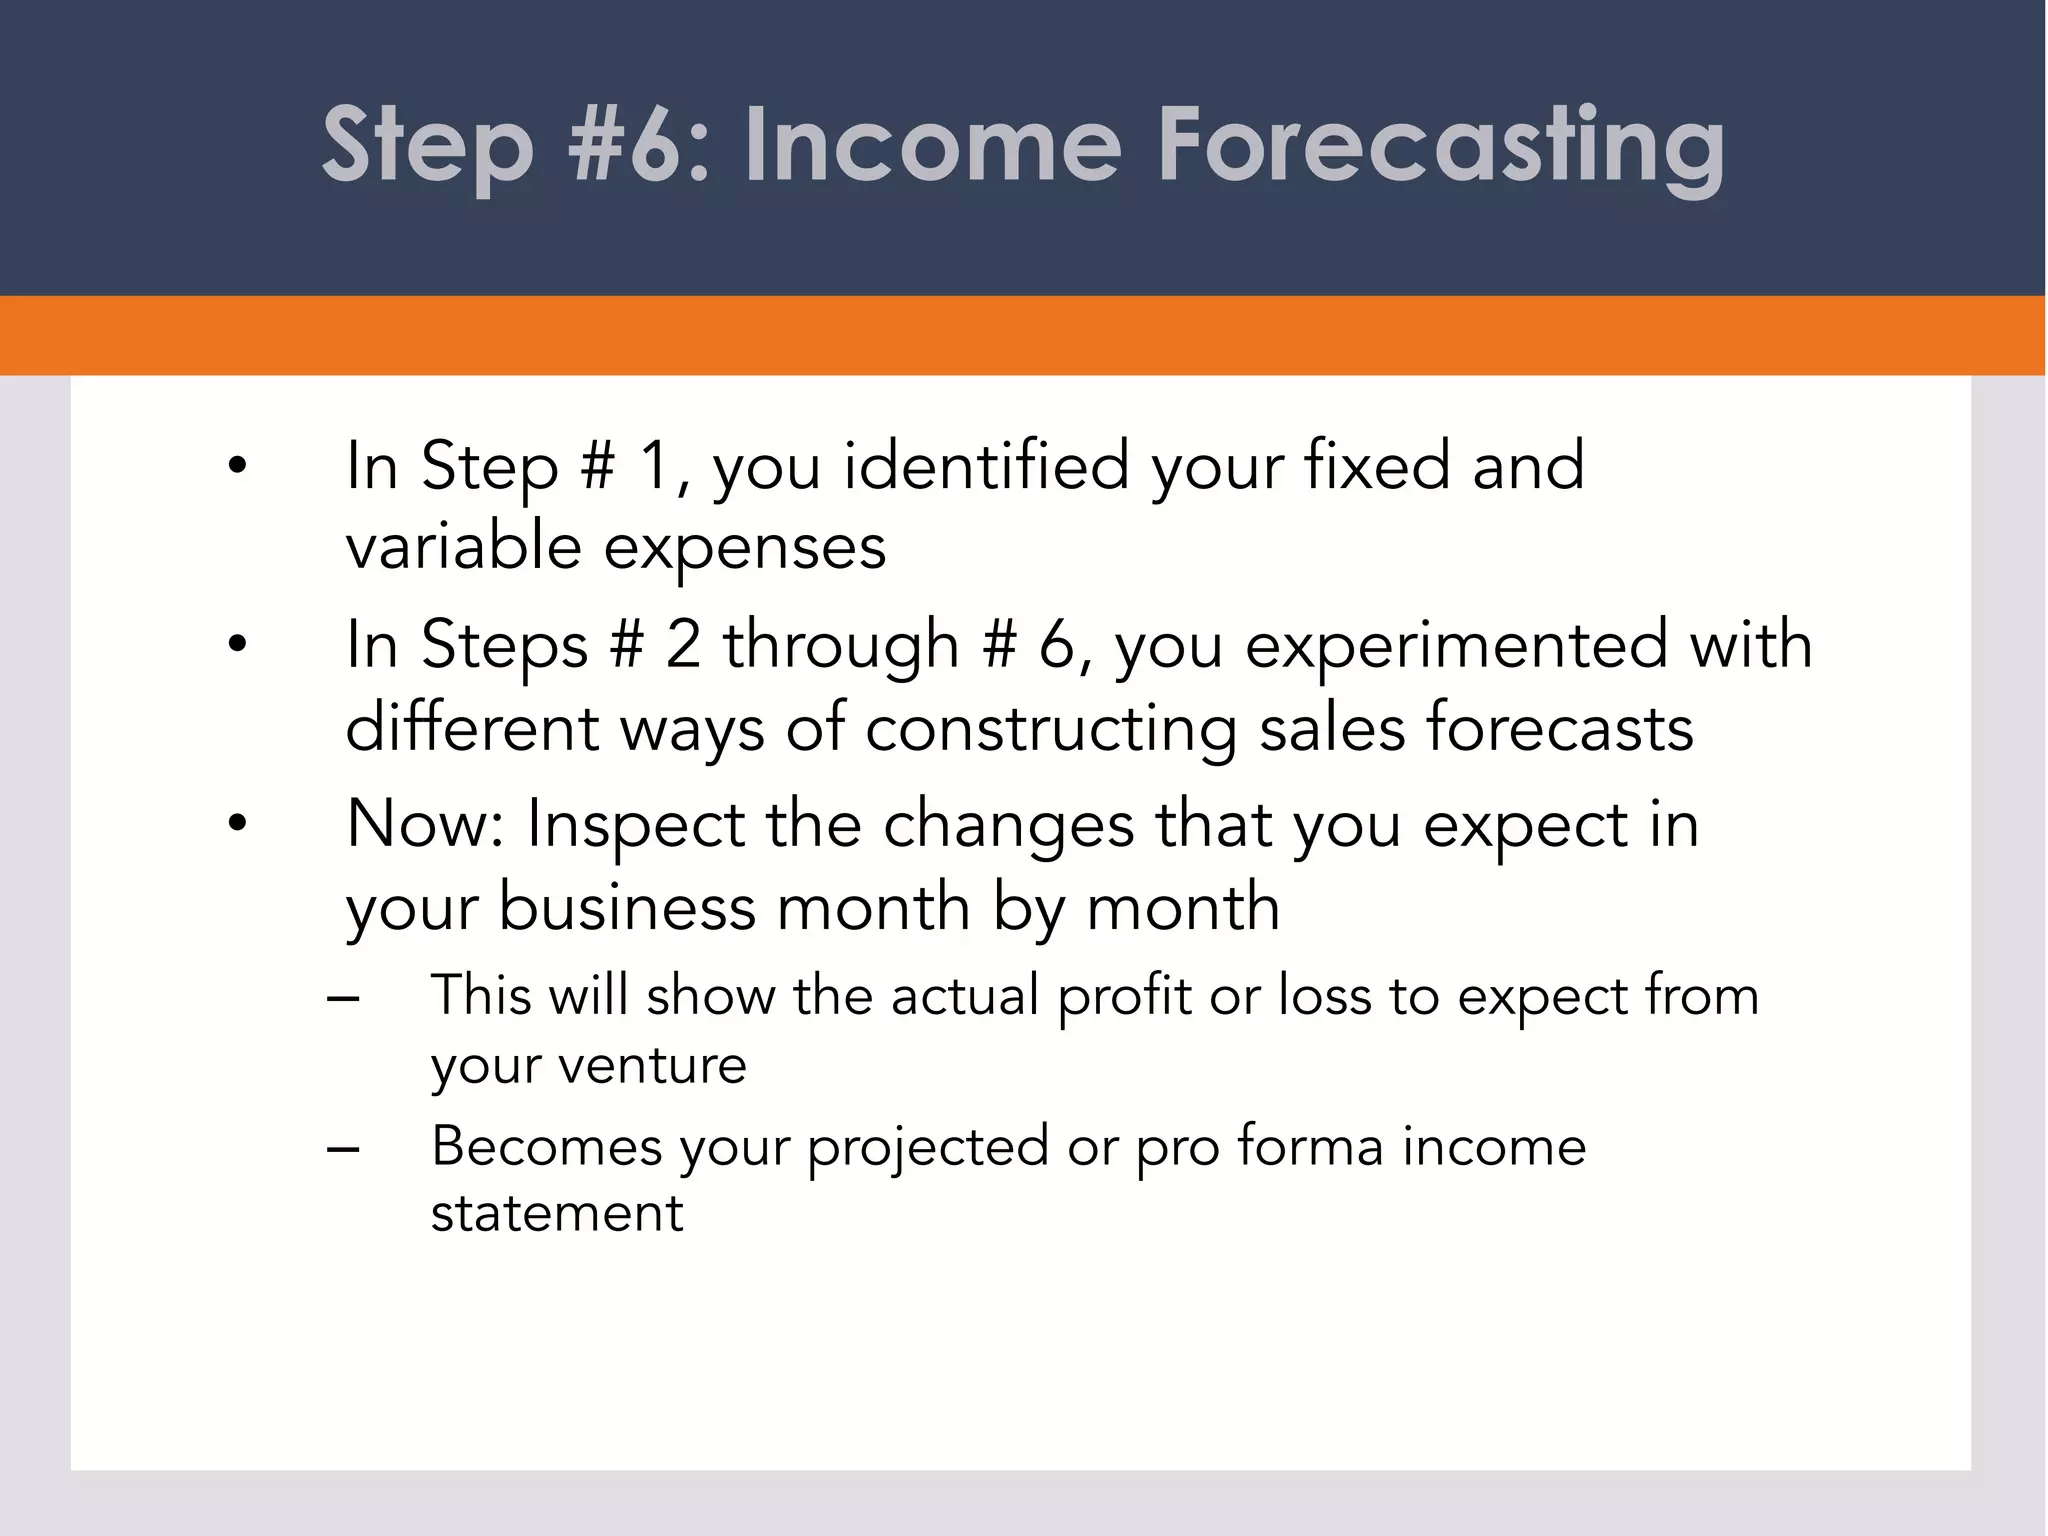
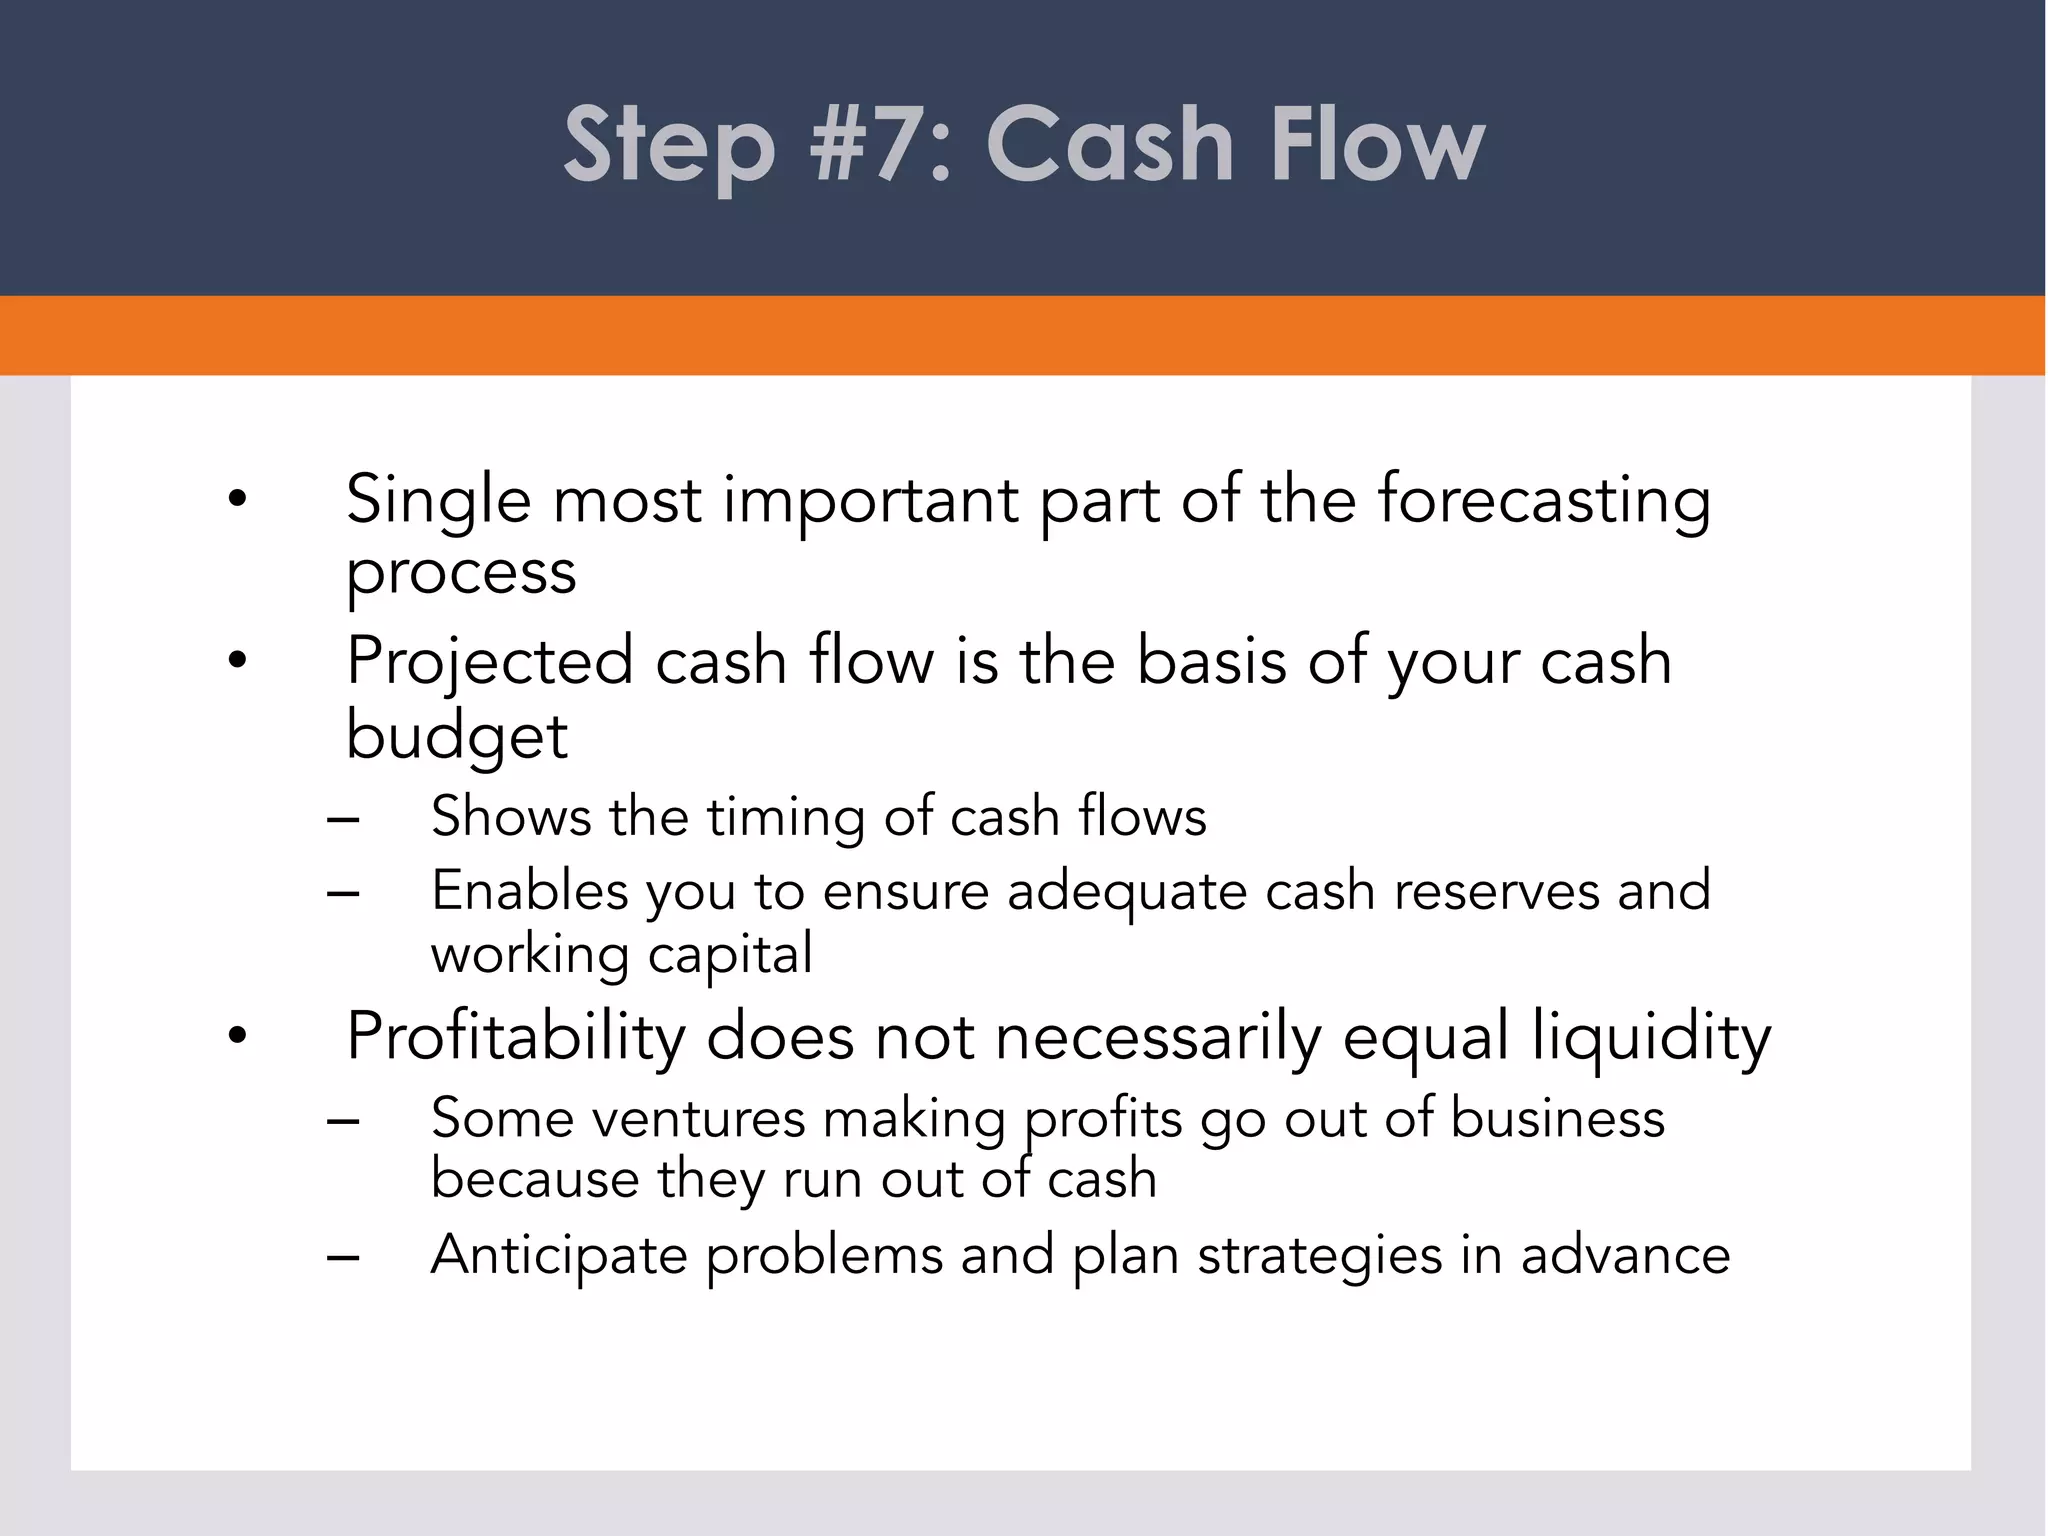


This document discusses the process of business forecasting. It explains that forecasting involves identifying fixed and variable costs, determining the breakeven sales level, evaluating the likelihood of reaching breakeven, and plotting sales projections and income forecasts. The key steps are: 1) identifying costs, 2) calculating breakeven, 3) evaluating chances of reaching breakeven, 4) determining when breakeven will be achieved, 5) graphing projections, 6) creating an income forecast, and 7) projecting cash flow. The overall goal is to carefully analyze past performance and costs to create realistic sales and financial projections for planning purposes.


![Ent ppt[1]](https://cdn.slidesharecdn.com/ss_thumbnails/entppt1-190502205922-thumbnail.jpg?width=640&height=640&fit=bounds)
![Ent ppt[1]](https://cdn.slidesharecdn.com/ss_thumbnails/entppt1-190502210300-thumbnail.jpg?width=640&height=640&fit=bounds)