Download to read offline


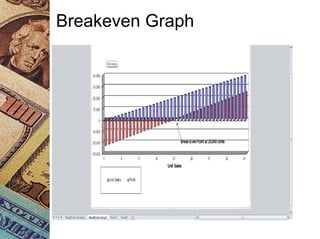
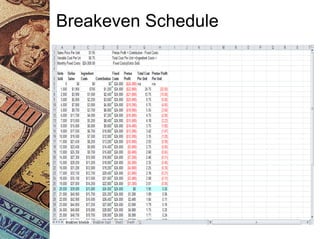


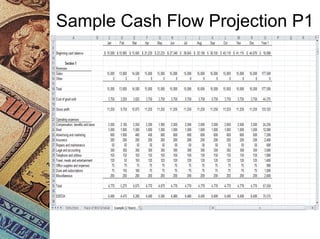
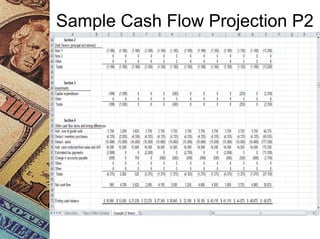
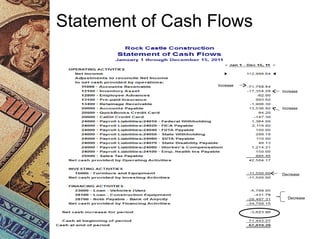
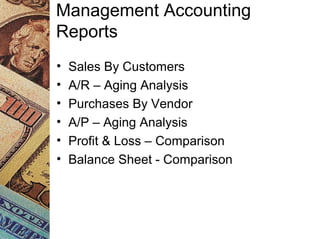
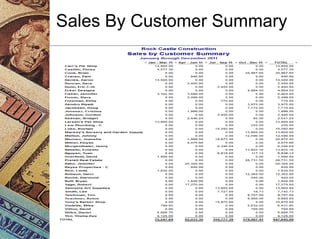
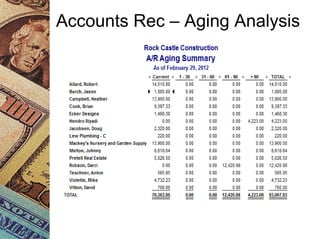
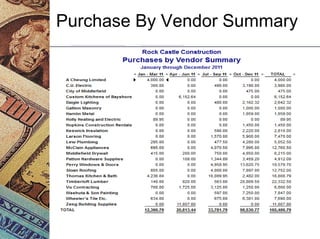
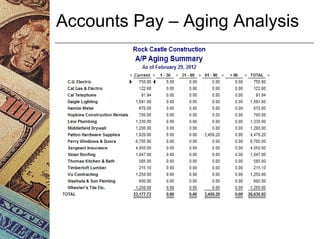
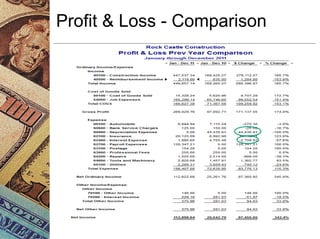
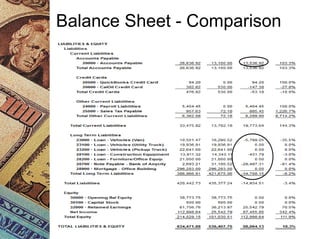
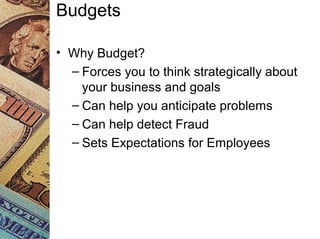
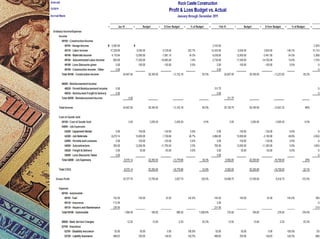
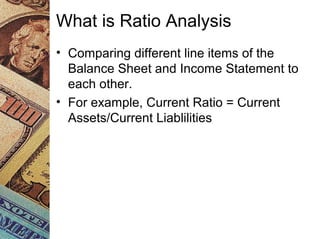


This document discusses how management accounting can increase business profits. It explains key management accounting concepts like cost analysis, cash flow projections, budgets, and financial ratio analysis. These tools help businesses understand costs, cash flows, and financial performance over time. Ratio analysis in particular can serve as an early warning system by identifying potential problems. Understanding a business's finances through management accounting allows owners to better manage costs, anticipate issues, and improve overall profits.


