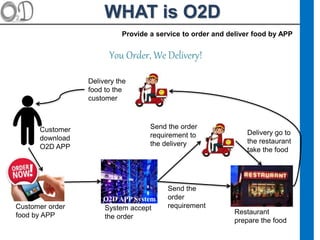
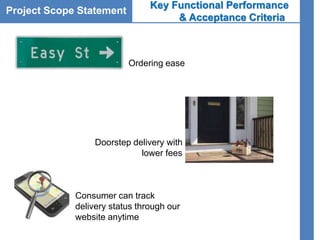
PROJECT RISK MANAGEMET
TIBEC TEAM
ZAKI DAOGENG TINA JAIME
VINICIUS
Development HR Financial
PM
Marketing
Provide a service to order and deliver food by APP
Customer order
food by APP
O2D APP System
System accept
the order
Send the
order
requirement
Send the order
requirement to
the delivery
Delivery go to
the restaurant
take the food
Customer
download
O2D APP
Restaurant
prepare the food
Delivery the
food to the
customer
You Order, We Delivery!
WHAT is O2D
MISSION
“We provide hot and fresh food from the top
franchise restaurants anytime anywhere straight
at your doorstep with our revolutionary delivery
service through our App.”
Project Scope Statement Business
Problem
 Don’t provide the delivery services
 Restaurants do not offer home delivery
Opportunity
 The food services industry is growing exponentially
Objective
 Lower cost to deliver food.
 Ordering ease
 Targeting corporate
Strategic Initiative
 Connect restaurants and customer with low cost and high quality
Project Scope Statement
Prioritized Project Objectives
Objectives
1 2 3 4
Benefits
$12,000/month
Budget
$ 40,000.00
Project Scope Statement Project Justification
A majority of regular full-fledged
restaurants do not offer home
delivery

The food services industry is
growing exponentially year over
year in this market
Project Scope Statement
Key Functional Performance
& Acceptance Criteria
Ordering ease
Doorstep delivery with
lower fees
Consumer can track
delivery status through our
website anytime
Project Scope Statement Deliverable
 Developing App
 Marketing
 Contract
 Work place
Project Scope Statement Key Resources
HR
Office
APP
Project Scope Statement
 Convenient solutions
 Meal at home
 Low fuel cost and cheap labor
Critical Assumptions
Project Scope Statement Constraints / Comments
 Government Policies
 People are looking for more convenient solutions for
their food
WHAT IS RISK ?
The objectives of project risk management are to increase the
likelihood and impact of positive events and decrease the
likelihood and impact of negative events.
Methodology
Roles and Responsibilities
Timing
Risk Categories
Definitions
Probability and Impact Matrix
Stakeholders’ Tolerances
Reporting Formats & Tracking
Budget
Risk Management Plan
Risk Management Plan Methodology
• Brainstorming
• Assumption analysis
• Checklist
• SWOT analysis
Risk Management Plan Roles and Responsibilities
Risk RAM for Team
Risk Management Plan Timing
 Risk Management
 when the project start
 Monthly Meeting with all the departments
 Development
 Weekly check the schedule on building APP
 Marketing
 Monthly do the APP Marketing Research
 Modify the marketing strategy
 Financial
 Review all the contract documents
 Human Resource
 Monthly tracking the effectively of the staffs
Work Breakdown Structure (WBS)
Risk Management Plan Risk Categories
Risk Breakdown Structure (RBS)
Risk Management Plan Risk Definitions
Risk Management Plan Probability and Impact Matrix
Risk Management Plan Risk Qualification & Response
Risk Management Plan Stakeholders’ Risk Tolerances
Project
Objective
Risk Tolerance Level
(1 low — 3 Medium — 5 high)
Cost 1 2 3 4 5
Time 1 2 3 4 5
Quality 1 2 3 4 5
Scope 1 2 3 4 5
 Low Tolerance for Cost, Quality
 Medium Tolerance for Time, Scope
Risk Management Plan Reporting Formats
Risk Register
Risk Management Plan
• Weekly meeting discuss the process
about the various risk avoidance and
controlling
• Regular brainstorming about risk
occurrence
• Analyzing the current status of risk
response
• Build the Mitigation of risk and check the
milestones
Tracking
TOP 5 RISKS
TOP 5 RISKS
 1.2.5 Delivery Delay
 1.3.2 Outsource Monitoring
 1.2.4 Solve customer complaints
 1.3.4 Compete with similar service
 1.3.11 Hire new staff
TOP 5 RISKS LEGEND
0 - 20% Very Low
21 - 40% Low
41 - 60% Medium
61-80% High
81-99% Very High
Legend Impact/Probability
0 - 5% Very Low
6 - 16% Medium
17-99% Very High
Legend Severity
As a reminder: Severity=Impact*Probability
TOP 5 RISKS RISK 1
• Risk
– Delivery delay
• Cause / Effect
– Traffic Problem
– Making the customers feel angry
• Strategy
– Avoid
• Response
– Use GPS to take a better route
Probability Severity Response Response description
Deliverable Categories RESULT L/M/H (IxP) L/M/H Strategy
External Delivery delay 84% 85% 72% Avoid use the gps trafic info to find a better route
Impact
TOP 5 RISKS RISK 2
• Risk
– Outsourcing monitoring
• Cause / Effect
– Lack of monitoring of outsourcing
– Loss of business
• Strategy
– Mitigate
• Response
– Hire a monitoring supervisor to control the outsource
companies
Probability Severity Response Response description
Deliverable Categories RESULT L/M/H (IxP) L/M/H Strategy
Organizational Outsource Monitoring 89% 80% 71% Mitigate
hire a monitoring supervisor to control the outsource
companies
Impact
TOP 5 RISKS RISK 3
• Risk
– Solve customers complaints
• Cause / Effect
– Slow process of customer’s feedback
– Bad reputation of the app
• Strategy
– Mitigate
• Response
– Check all the bad reviews and create action plan to solve
the complaints
Probability Severity Response Response description
Deliverable Categories RESULT L/M/H (IxP) L/M/H Strategy
External Solve customer complaints 89% 80% 71% Mitigate
check all the bad reviews and creat an action plan to
solve the complaints
Impact
TOP 5 RISKS RISK 4
• Risk
– Compete with similar service
• Cause / Effect
– Lack of research of competitors
– Lack of loyal customers
• Strategy
– Mitigate
• Response
– Keep a regular check and take actions on the price and
quality of competitor
Probability Severity Response Response description
Deliverable Categories RESULT L/M/H (IxP) L/M/H Strategy
Organizational Compete with similar service 54% 80% 44% Mitigate
keep a regular check and take actions on the price and
quality of competitor
Impact
TOP 5 RISKS RISK 5
• Risk
– Hire new staff
• Cause / Effect
– Assign work to new staff
– Cost more on training
• Strategy
– Mitigate
• Response
– Pay good salaries and better benefits to retain staff
Probability Severity Response Response description
Deliverable Categories L/M/H (IxP) L/M/H Strategy
Organizational Hire new staff 60% 42% Mitigate pay good salary and better benefits to retain staff
Probability-Impact Matrix
Very High 0 0 0 0 1
High 0 0 1 0 2
Medium 0 1 3 2 0
Low 0 3 2 1 0
very Low 0 8 13 13 0
Very Low Low Medium High Very High
High
Medium
Low
Probability - Impact Matrix
Probability
Impact
RISK COST ESTIMATE
Range of Project Risk Cost Estimates
RBS Element Low Most Likely High
Technical
35%
$ 7,000 $ 10,500 $ 14,000
External
30%
$ 6,000 $ 9,000 $ 12,000
Organizational
20%
$ 4,000 $ 6,000 $ 8,000
Project
Management
15%
$ 3,000 $ 4,500 $ 6,000
Total Project $ 20,000 $ 30,000 $ 40,000
Project BENEFIT
• Control the risk under its lowest level
• Reduce threats and increase
opportunities
• Identify the categories of the risk and
the priority
• Avoid unwanted costs
• Improve organizational and project
communication
Expected Monetary Value(EMV)
Risk Response Alternatives
Recommendations
 Lower Cost
 Save Human Resource Cost
 Outsource Delivery service
 Mitigate the problem from the system
 Risk avoidance
THANK YOU

Project Risk Management_O2D

  • 1.
  • 2.
    TIBEC TEAM ZAKI DAOGENGTINA JAIME VINICIUS Development HR Financial PM Marketing
  • 3.
    Provide a serviceto order and deliver food by APP Customer order food by APP O2D APP System System accept the order Send the order requirement Send the order requirement to the delivery Delivery go to the restaurant take the food Customer download O2D APP Restaurant prepare the food Delivery the food to the customer You Order, We Delivery! WHAT is O2D
  • 4.
    MISSION “We provide hotand fresh food from the top franchise restaurants anytime anywhere straight at your doorstep with our revolutionary delivery service through our App.”
  • 5.
    Project Scope StatementBusiness Problem  Don’t provide the delivery services  Restaurants do not offer home delivery Opportunity  The food services industry is growing exponentially Objective  Lower cost to deliver food.  Ordering ease  Targeting corporate Strategic Initiative  Connect restaurants and customer with low cost and high quality Project Scope Statement
  • 6.
    Project Scope Statement PrioritizedProject Objectives Objectives 1 2 3 4 Benefits $12,000/month Budget $ 40,000.00
  • 7.
    Project Scope StatementProject Justification A majority of regular full-fledged restaurants do not offer home delivery  The food services industry is growing exponentially year over year in this market
  • 8.
    Project Scope Statement KeyFunctional Performance & Acceptance Criteria Ordering ease Doorstep delivery with lower fees Consumer can track delivery status through our website anytime
  • 9.
    Project Scope StatementDeliverable  Developing App  Marketing  Contract  Work place
  • 10.
    Project Scope StatementKey Resources HR Office APP
  • 11.
    Project Scope Statement Convenient solutions  Meal at home  Low fuel cost and cheap labor Critical Assumptions
  • 12.
    Project Scope StatementConstraints / Comments  Government Policies  People are looking for more convenient solutions for their food
  • 13.
    WHAT IS RISK? The objectives of project risk management are to increase the likelihood and impact of positive events and decrease the likelihood and impact of negative events.
  • 14.
    Methodology Roles and Responsibilities Timing RiskCategories Definitions Probability and Impact Matrix Stakeholders’ Tolerances Reporting Formats & Tracking Budget Risk Management Plan
  • 15.
    Risk Management PlanMethodology • Brainstorming • Assumption analysis • Checklist • SWOT analysis
  • 16.
    Risk Management PlanRoles and Responsibilities Risk RAM for Team
  • 17.
    Risk Management PlanTiming  Risk Management  when the project start  Monthly Meeting with all the departments  Development  Weekly check the schedule on building APP  Marketing  Monthly do the APP Marketing Research  Modify the marketing strategy  Financial  Review all the contract documents  Human Resource  Monthly tracking the effectively of the staffs
  • 18.
  • 19.
    Risk Management PlanRisk Categories
  • 20.
  • 21.
    Risk Management PlanRisk Definitions
  • 22.
    Risk Management PlanProbability and Impact Matrix
  • 23.
    Risk Management PlanRisk Qualification & Response
  • 24.
    Risk Management PlanStakeholders’ Risk Tolerances Project Objective Risk Tolerance Level (1 low — 3 Medium — 5 high) Cost 1 2 3 4 5 Time 1 2 3 4 5 Quality 1 2 3 4 5 Scope 1 2 3 4 5  Low Tolerance for Cost, Quality  Medium Tolerance for Time, Scope
  • 25.
    Risk Management PlanReporting Formats Risk Register
  • 26.
    Risk Management Plan •Weekly meeting discuss the process about the various risk avoidance and controlling • Regular brainstorming about risk occurrence • Analyzing the current status of risk response • Build the Mitigation of risk and check the milestones Tracking
  • 27.
  • 28.
    TOP 5 RISKS 1.2.5 Delivery Delay  1.3.2 Outsource Monitoring  1.2.4 Solve customer complaints  1.3.4 Compete with similar service  1.3.11 Hire new staff
  • 29.
    TOP 5 RISKSLEGEND 0 - 20% Very Low 21 - 40% Low 41 - 60% Medium 61-80% High 81-99% Very High Legend Impact/Probability 0 - 5% Very Low 6 - 16% Medium 17-99% Very High Legend Severity As a reminder: Severity=Impact*Probability
  • 30.
    TOP 5 RISKSRISK 1 • Risk – Delivery delay • Cause / Effect – Traffic Problem – Making the customers feel angry • Strategy – Avoid • Response – Use GPS to take a better route Probability Severity Response Response description Deliverable Categories RESULT L/M/H (IxP) L/M/H Strategy External Delivery delay 84% 85% 72% Avoid use the gps trafic info to find a better route Impact
  • 31.
    TOP 5 RISKSRISK 2 • Risk – Outsourcing monitoring • Cause / Effect – Lack of monitoring of outsourcing – Loss of business • Strategy – Mitigate • Response – Hire a monitoring supervisor to control the outsource companies Probability Severity Response Response description Deliverable Categories RESULT L/M/H (IxP) L/M/H Strategy Organizational Outsource Monitoring 89% 80% 71% Mitigate hire a monitoring supervisor to control the outsource companies Impact
  • 32.
    TOP 5 RISKSRISK 3 • Risk – Solve customers complaints • Cause / Effect – Slow process of customer’s feedback – Bad reputation of the app • Strategy – Mitigate • Response – Check all the bad reviews and create action plan to solve the complaints Probability Severity Response Response description Deliverable Categories RESULT L/M/H (IxP) L/M/H Strategy External Solve customer complaints 89% 80% 71% Mitigate check all the bad reviews and creat an action plan to solve the complaints Impact
  • 33.
    TOP 5 RISKSRISK 4 • Risk – Compete with similar service • Cause / Effect – Lack of research of competitors – Lack of loyal customers • Strategy – Mitigate • Response – Keep a regular check and take actions on the price and quality of competitor Probability Severity Response Response description Deliverable Categories RESULT L/M/H (IxP) L/M/H Strategy Organizational Compete with similar service 54% 80% 44% Mitigate keep a regular check and take actions on the price and quality of competitor Impact
  • 34.
    TOP 5 RISKSRISK 5 • Risk – Hire new staff • Cause / Effect – Assign work to new staff – Cost more on training • Strategy – Mitigate • Response – Pay good salaries and better benefits to retain staff Probability Severity Response Response description Deliverable Categories L/M/H (IxP) L/M/H Strategy Organizational Hire new staff 60% 42% Mitigate pay good salary and better benefits to retain staff
  • 35.
    Probability-Impact Matrix Very High0 0 0 0 1 High 0 0 1 0 2 Medium 0 1 3 2 0 Low 0 3 2 1 0 very Low 0 8 13 13 0 Very Low Low Medium High Very High High Medium Low Probability - Impact Matrix Probability Impact
  • 36.
  • 37.
    Range of ProjectRisk Cost Estimates RBS Element Low Most Likely High Technical 35% $ 7,000 $ 10,500 $ 14,000 External 30% $ 6,000 $ 9,000 $ 12,000 Organizational 20% $ 4,000 $ 6,000 $ 8,000 Project Management 15% $ 3,000 $ 4,500 $ 6,000 Total Project $ 20,000 $ 30,000 $ 40,000
  • 38.
    Project BENEFIT • Controlthe risk under its lowest level • Reduce threats and increase opportunities • Identify the categories of the risk and the priority • Avoid unwanted costs • Improve organizational and project communication
  • 39.
    Expected Monetary Value(EMV) RiskResponse Alternatives
  • 40.
    Recommendations  Lower Cost Save Human Resource Cost  Outsource Delivery service  Mitigate the problem from the system  Risk avoidance
  • 41.

Editor's Notes

  • #4 Project description and business justification
  • #7 Project objectives, prioritized with rationale
  • #8 Scope description, project driver and business justification
  • #9 Scope description, project driver and business justification
  • #10 Scope description, project driver and business justification
  • #11 Scope description, project driver and business justification
  • #12 Scope description, project driver and business justification
  • #13 Scope description, project driver and business justification
  • #15 Risk Management Plan –itemized bullets addressing all global elements
  • #18 defines when risk management activities will occur, event and recurring.
  • #19 Project Selection Criteria / Scope Statement Exercise Process 1. Should be work-related 2. You know it first hand 3. “Risk rich” area 4. Not yet in Progress 5. Not classified / confidential 6. Right size scope – create WBS 7. Prioritize Project objective (T, C, S, Q)
  • #20 – Risk Breakdown Structure for identifying and classifying sources of risk Determine the elements of the Project Risk Breakdown Structure based upon PMBOK® Guide and lecture directions. Populate and insert the RBS Chart here; or provide table or text description.
  • #21 Risk Identification Exercise Process 1. Focus on a reasonable portion of WBS – detail that portion to level 3 or 4 2. Determine risk source categories (taxonomy) 3. Brainstorm 50 risk events – be as specific as possible 4. Use checklist to verify breadth of coverage 5. Complete consequences for each risk event (Copy/ insert rows for additional consequences flowing from same risk event) 6. Complete the description of risk statements to include source categories, timeframes, impact types and other attributes as useful 7. Do not score likelihood or impact at this time
  • #22 Discuss and define the Risk Impact & Probability Scales Definitions, based upon PMBOK® Guide and lecture directions, such that a selected threshold score will consistently refer to the targeted level of risk tolerance, including the bias for the project’s driving objective; e.g., Time, Quality, etc. Insert the Risk Impact & Probability Scales Definitions table here.
  • #23 used in qualitative analysis to prioritize risk events Determine which scores in the matrix correspond with the targeted risk tolerance level and code or label them accordingly. Insert the Probability – Impact Matrix table here, or provide textual description of the scoring categories.
  • #24 used in qualitative analysis to prioritize risk events Determine which scores in the matrix correspond with the targeted risk tolerance level and code or label them accordingly. Insert the Probability – Impact Matrix table here, or provide textual description of the scoring categories.
  • #25 Definition of key expectations – assessment is based on a specific project. State the score that reflects the selected risk tolerance level. Support with rationale. In project management, risk tolerance is the measure of the degree of uncertainty that a stakeholder accepts in respect of the project risk assessment.
  • #26 – format and content of the risk register and other reports and results from risk monitoring. Reporting Formats (including the risk register): May use existing formats
  • #27 – format and content of the risk register and other reports and results from risk monitoring.
  • #29 Description and analysis of top 5 risks, responses, post-response risk score, etc.
  • #36 Description and analysis of top 5 risks, responses, post-response risk score, etc.
  • #38 $ 20,000.00
  • #39 Summarize costs & benefits realized from risk management 4. Estimate costs for responses, accepted risks and unknown-unknowns 5. Summarize cost and benefits to determine value of each risk response
  • #40 Analyze 1 risk, using Expected Monetary Value(EMV) to comparative economic benefits to select one response from various response alternatives.
  • #41 Make recommendations and sell value of risk management how this risk management help the entire process of the project how do we convince why we do this stakeholder tolerance probability & impact matrix constant feedback week review