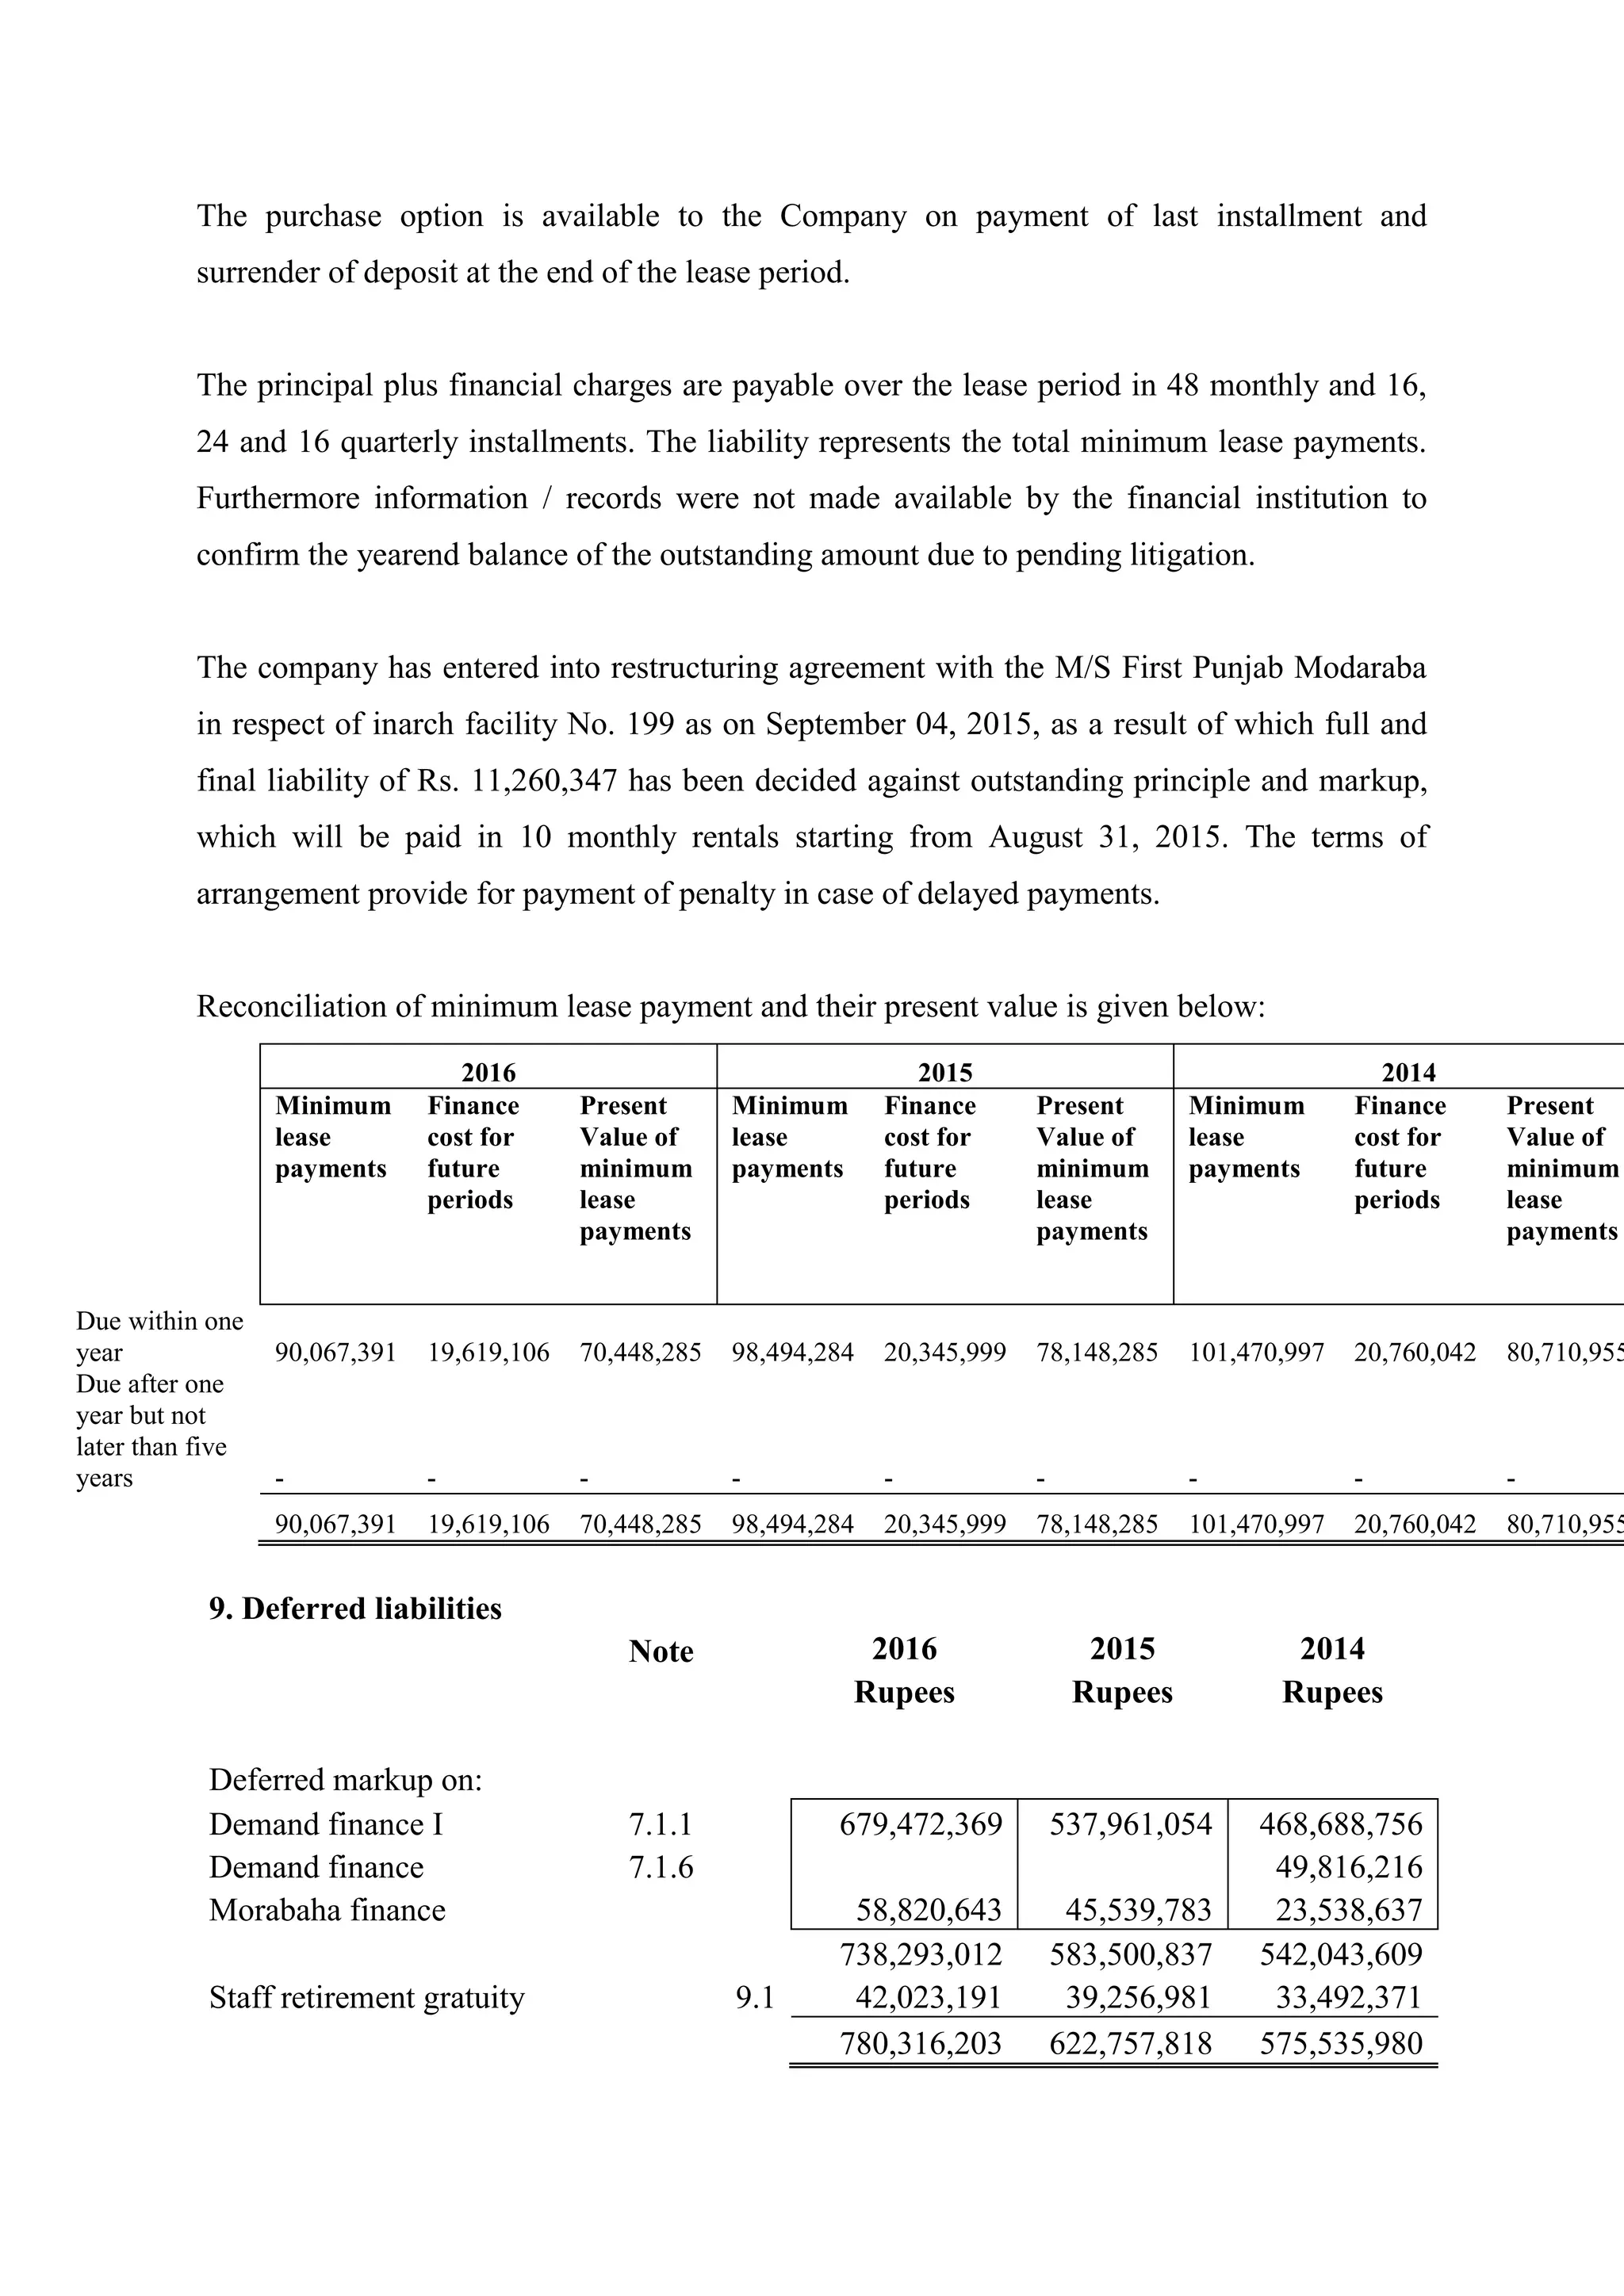
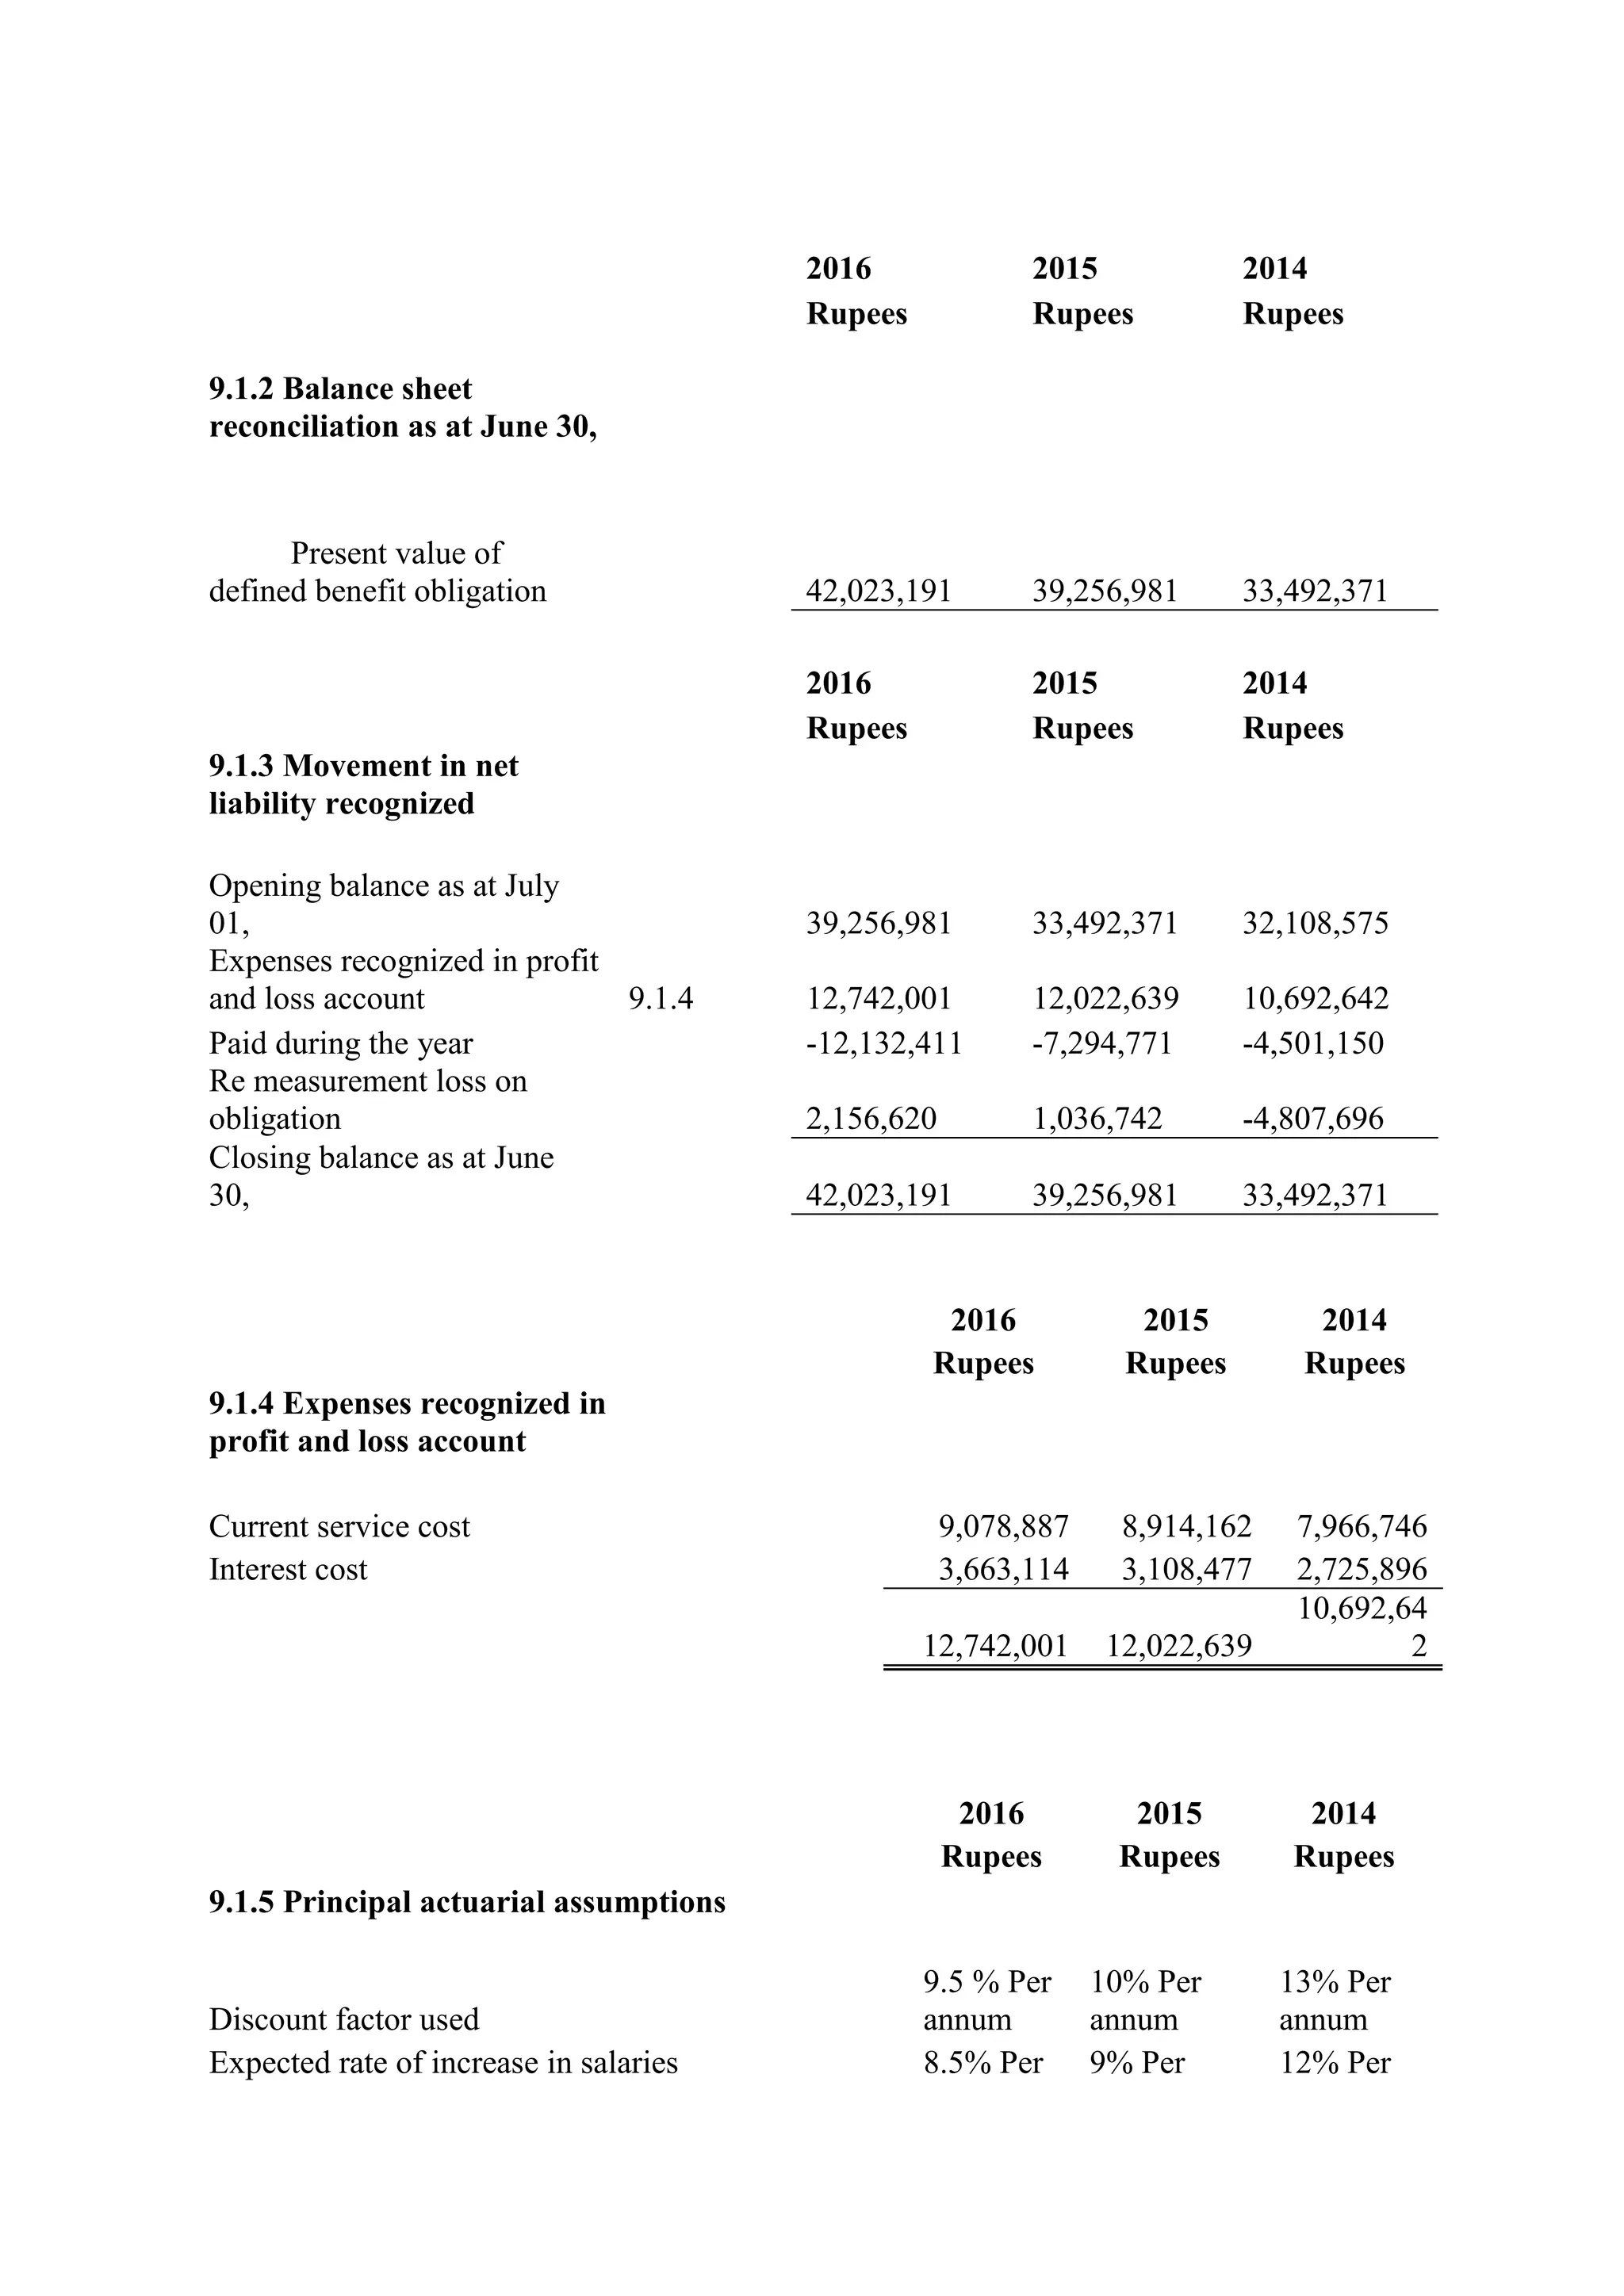
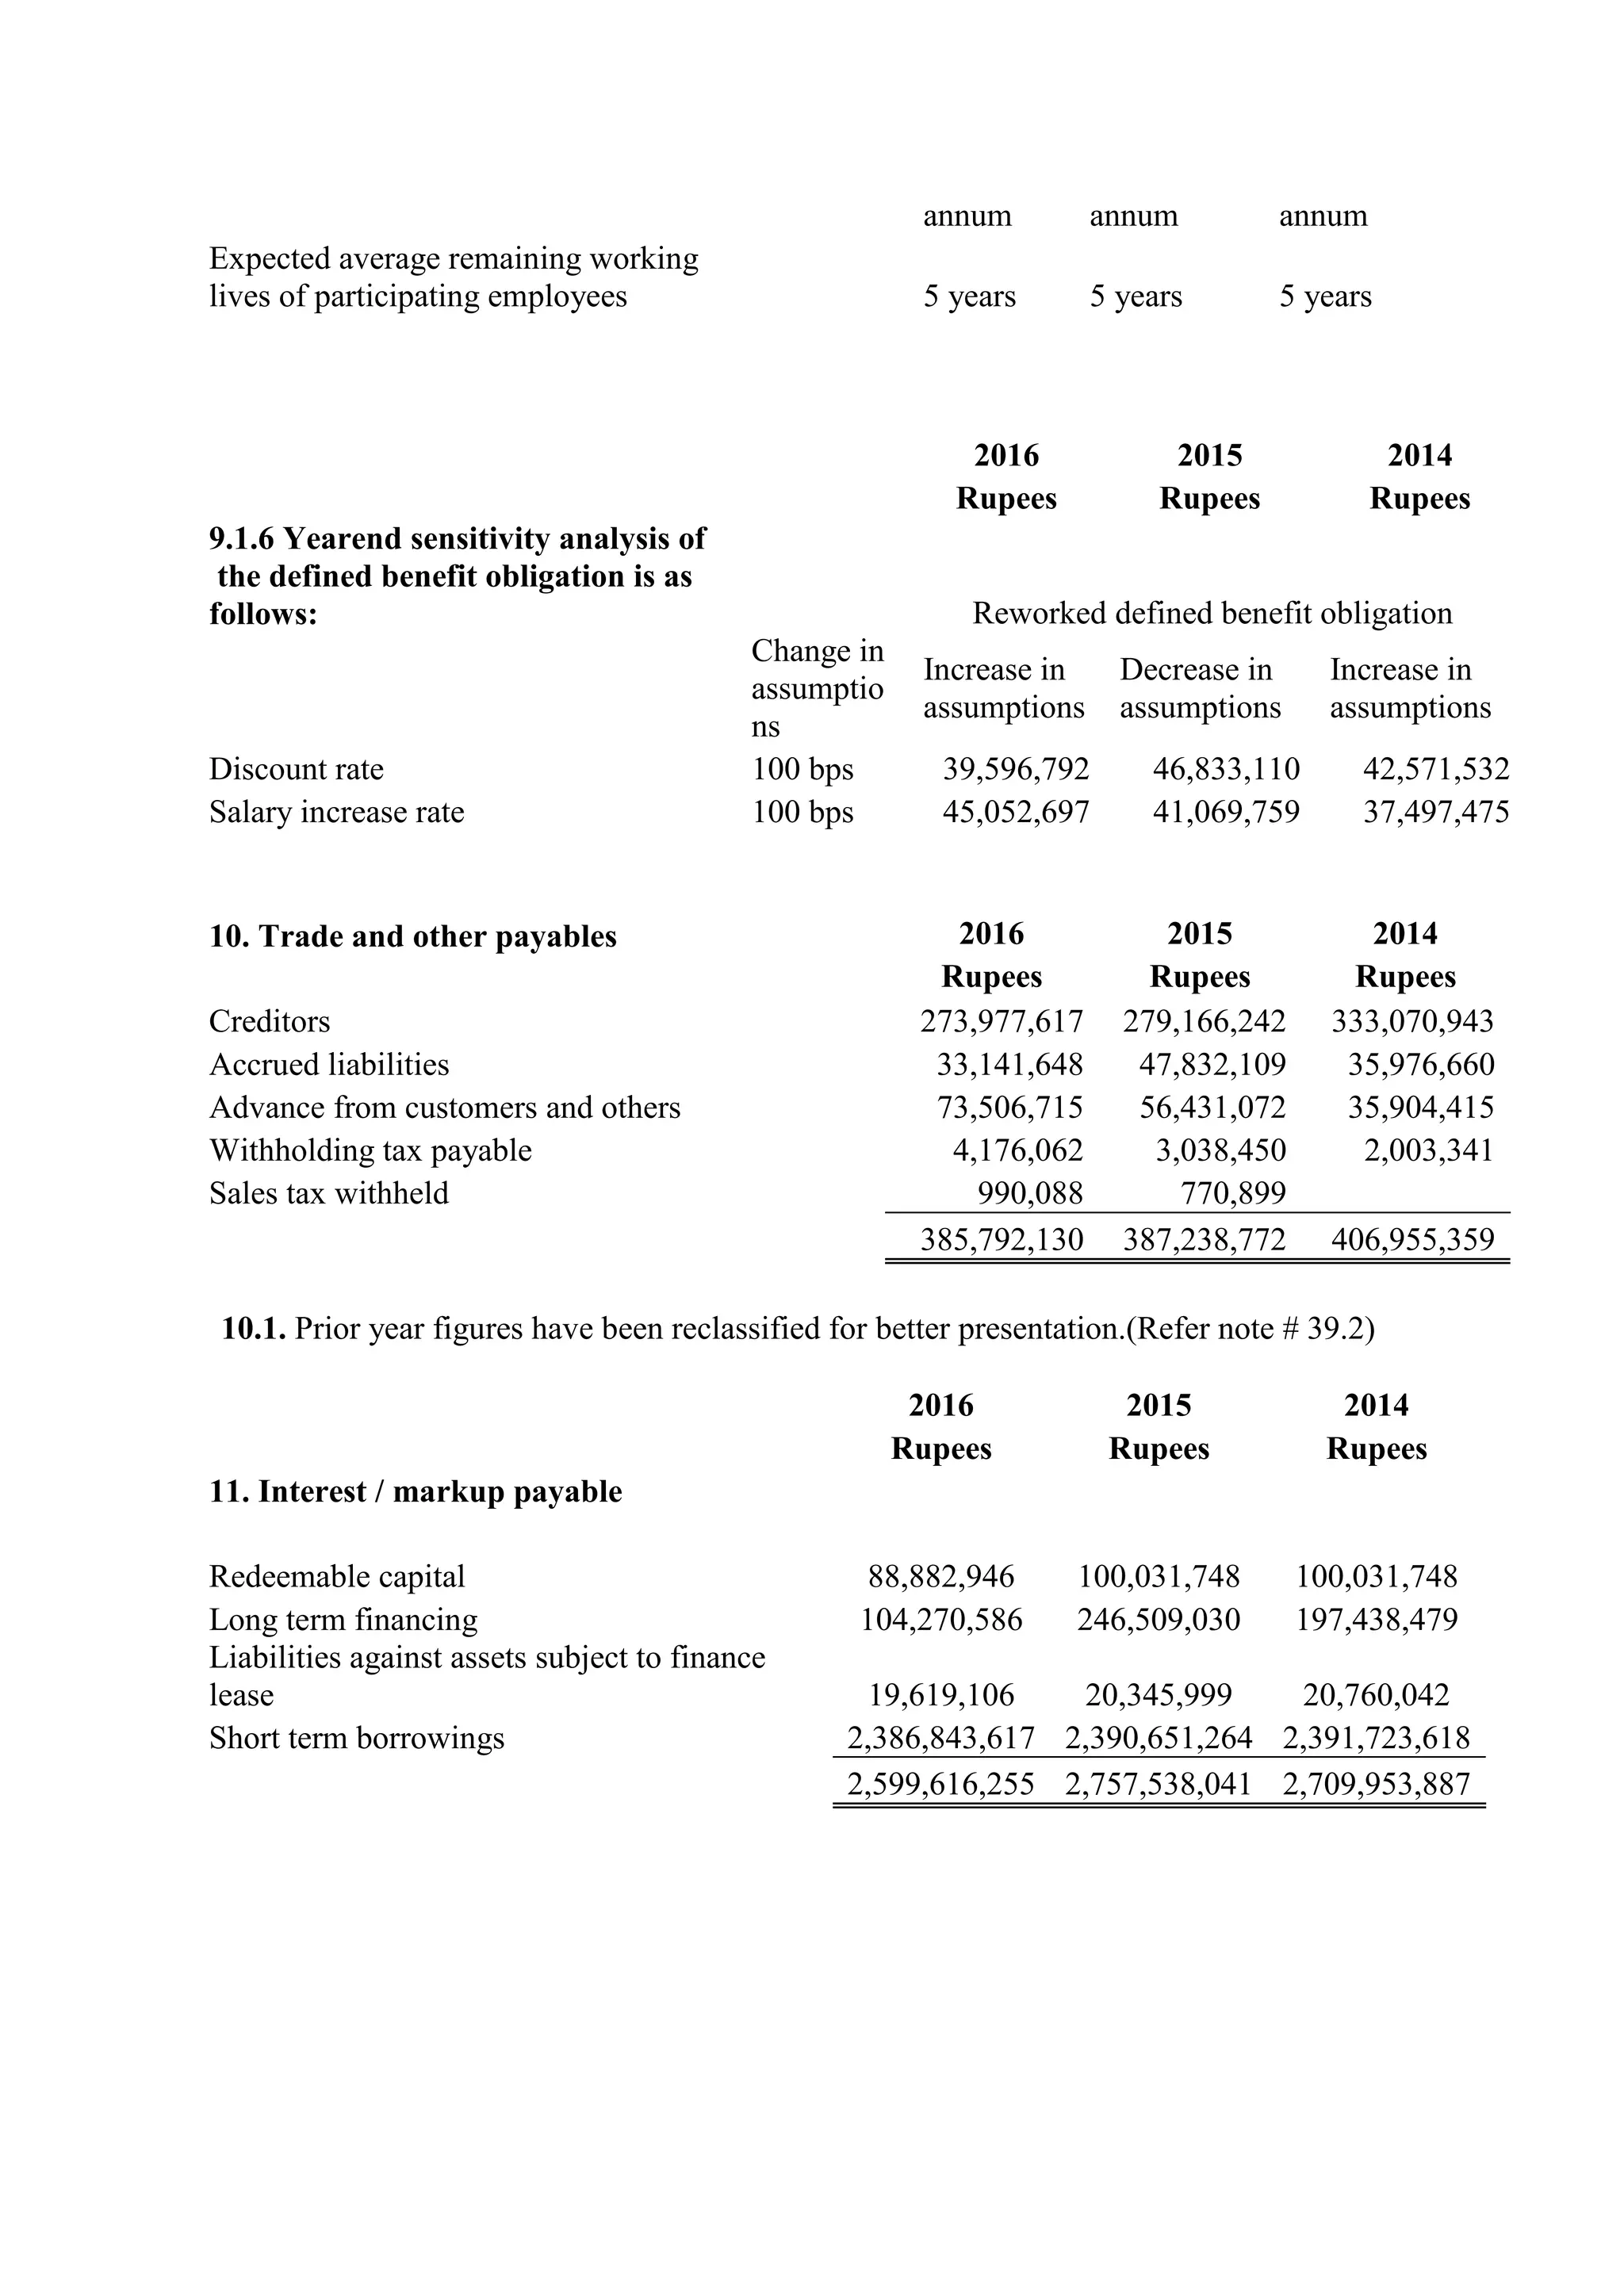
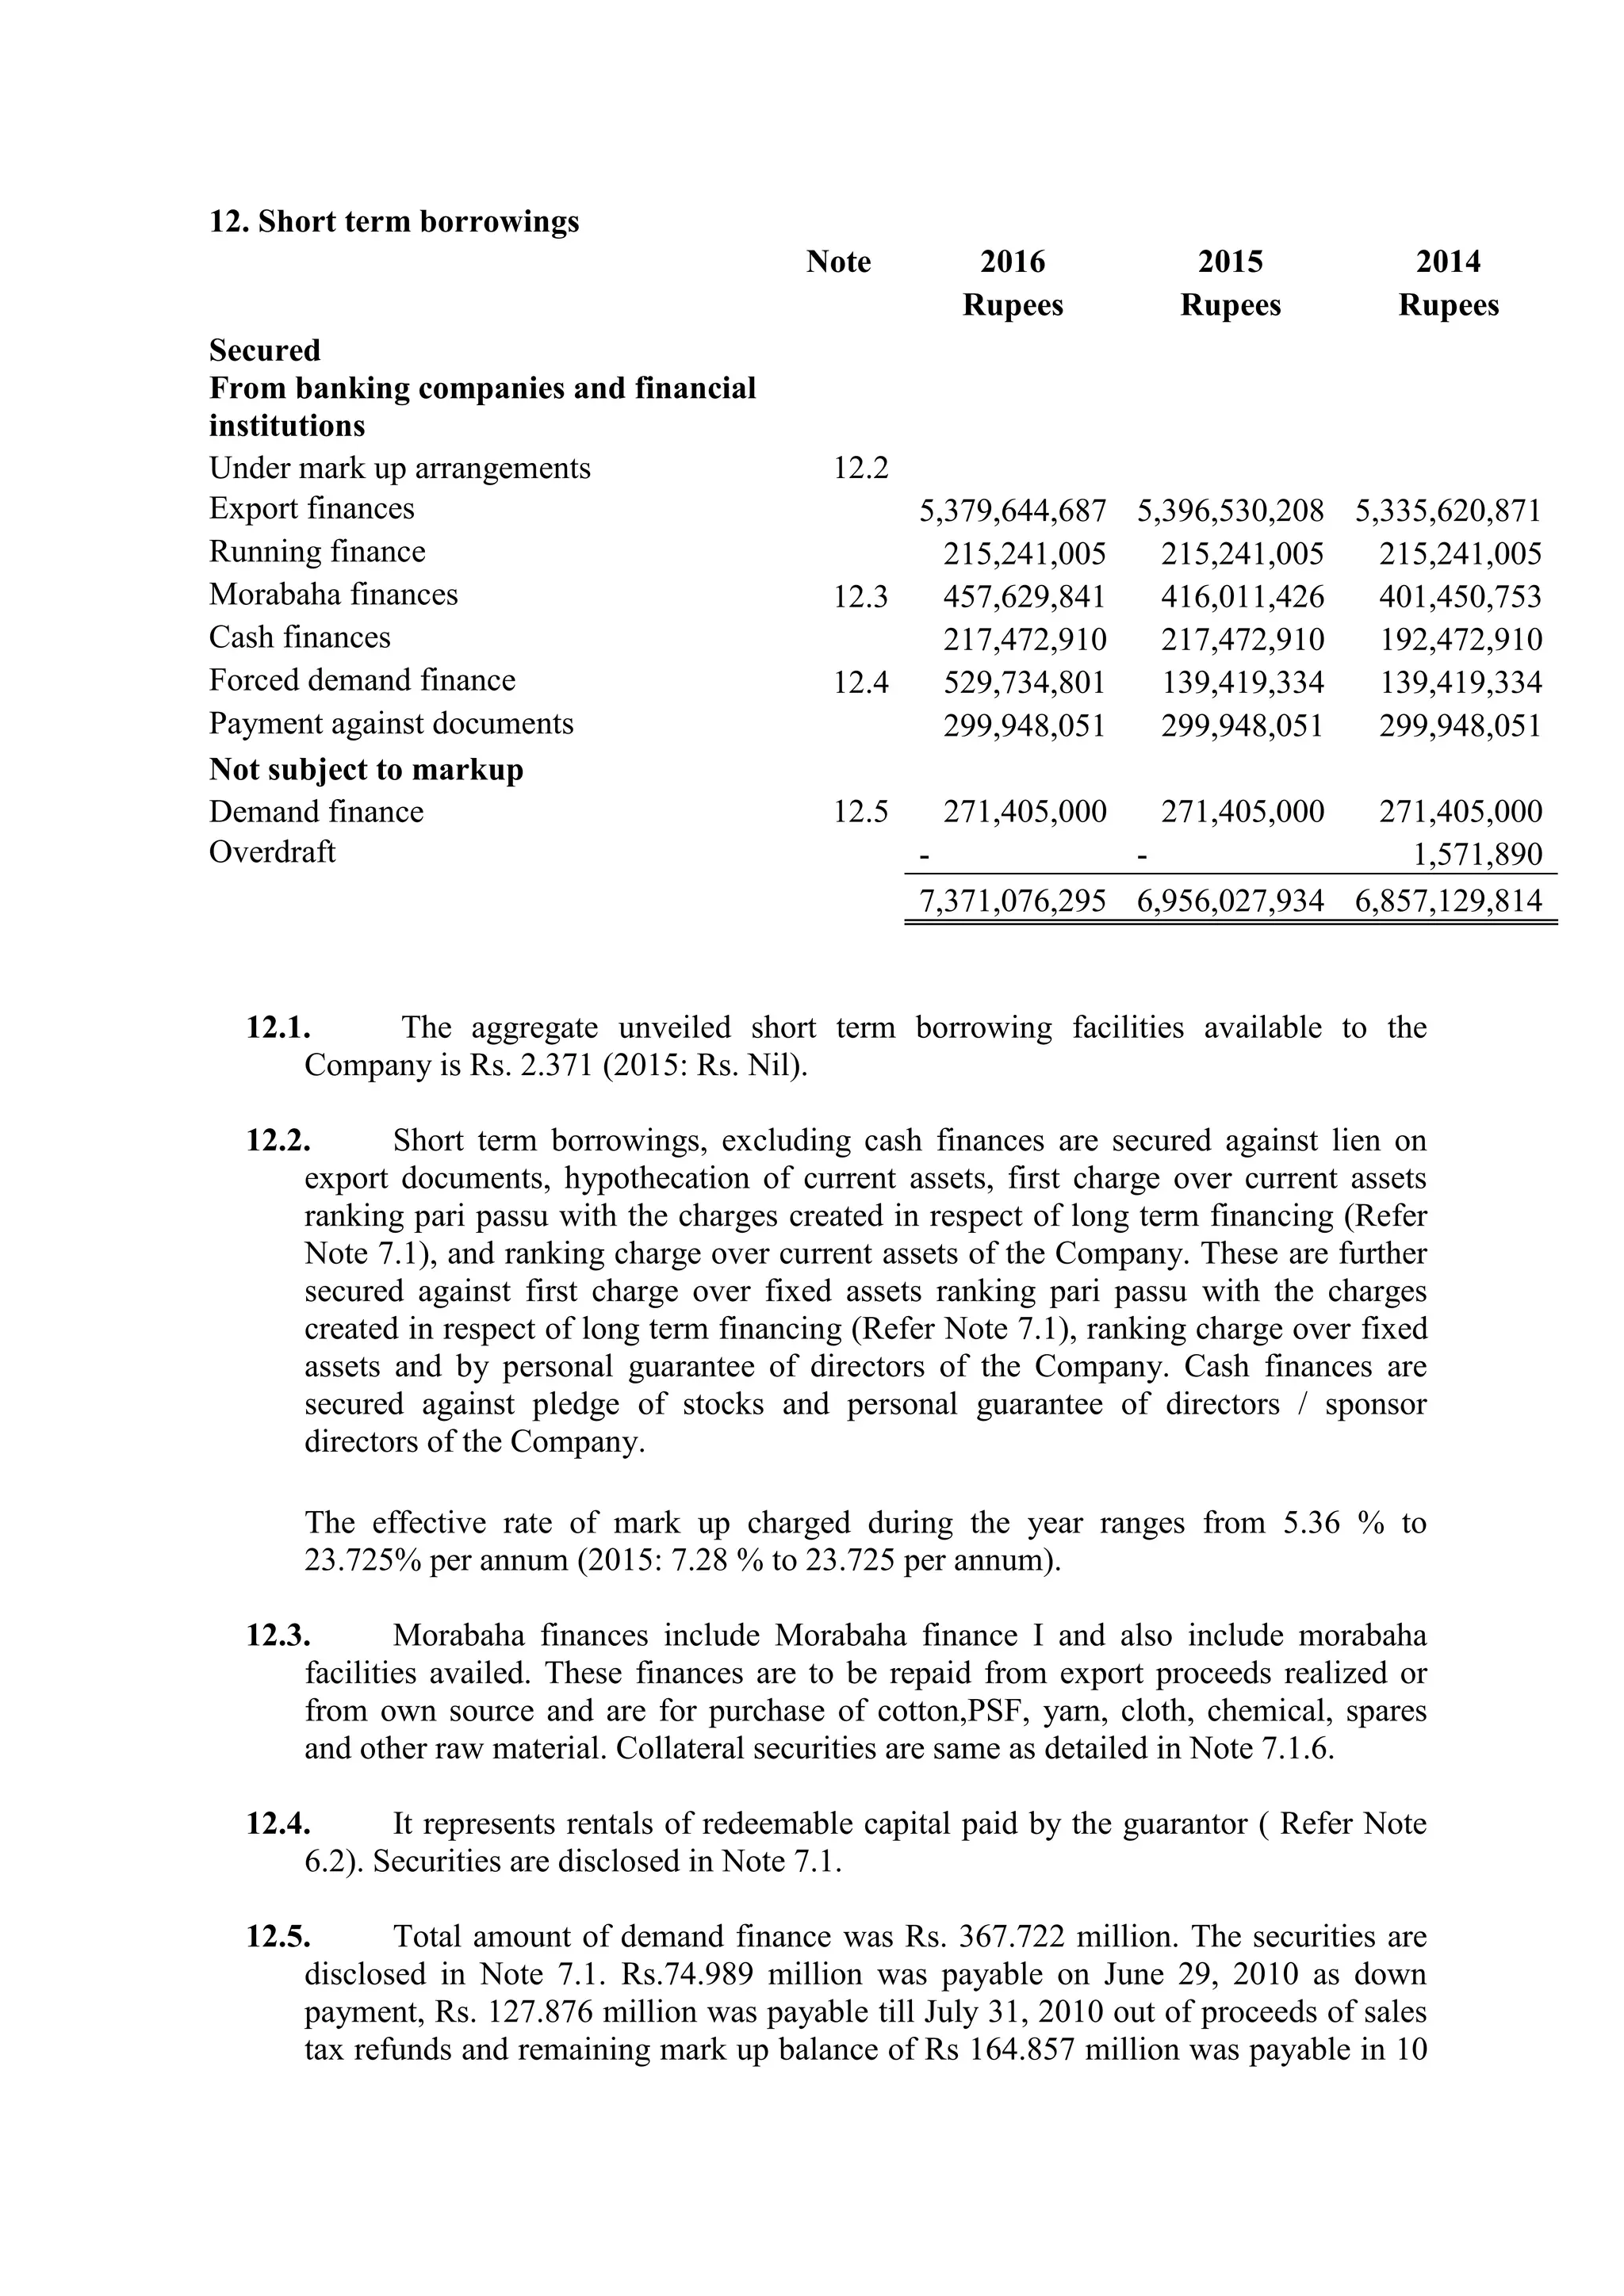
CHAPTER NO 1
INTRODUCTION/BACKGROUND
1.1 Company Profile
Amtex Private Limited was incorporated in Pakistan in 1991. Amtex Limited is amongst the
largest vertically integrated Textile setups in Pakistan having production facilities in all
sectors of Textile Industry from Spinning, Weaving, Processing, Printing, Finishing, Cut and
Sewn processes and provides employment opportunities to large number of families. After
establishing strong foothold in the Textile exports, Amtex successfully switched to Direct to
Retail (“DTR”) business model that has enabled it to focus on exporting high value added
diversified Products directly to premier Retailers in the EU, USA and across the globe.
Amtex holds an iconic textile position in the Global textile industry, being the “One Stop
Shop” concept by offering largest variety and combination of products to its diversified
customers.
With state of the art Textile manufacturing facility, internationally recognized R&D
Department, Strong outsourcing capabilities, Professional management, International display
centers and warehouses for facilitating procurement of orders and direct dealing with retailing
giants, Amtex is marching towards becoming a leader. Amtex has shown huge promise in
value added Home Textile sector, where it has become a leader in exporting high end quality
Products. Amtex has maintained its focus and commitment in balancing, modernization and
value addition activities, as core business philosophy. Amtex aims at developing synergies by
keeping abreast with their strong vendor base and as well as to have the flexibility to react to
the dynamics of ever demanding growing parameters of market and global business.
1.2Amtex Awards
Our slogan "Excellence without Compromise" has been proved by producing quality
products over the years. That is only why Amtex has been awarded "Best Export Trophy
Award" & Gold Medal for "Businessman of the Year".
1.3 Vision of Amtex
Our vision is to provide our customers all their required goods and services from one plat
form.
1.4 Company Information
1.5 Mission of Amtex
Our mission is to become the buyer’s first choice all around the world and to achieve this
target we make sure that we stay true to the highest standards of excellence and customer’s
satisfaction
Board of Directors
Mr. Khurram Iftikhar
Chief Executive Officer
Mr. Shahzad Iftikhar
Mr. Nadeem Iftikhar
Mr. Suhail Maqsood Ahmed
Mr. Muhammad Ahsan
Mr. Gul Muhammad Naz
Mr. Usman Ghani
Secretary & Chief Financial
Officer
Mr. Tahir Javed
Audit Committee
Mr. Suhail Maqsood Ahmed
Chairman
Mr. Muhammad Ahsan
Member
Mr. Usman Ghani
Member
Auditors
Zahid Jamil & Co.
Chartered Accountants
Legal Advisor
Mr. Mushtaq Ahmed Khan
Advocate High Court
Bankers
Albarka Bank Limited
Askari Bank Limited
Bank Alfalah Limited
Bankislami Pakistan Limited
Faysal Bank Limited
Habib Bank Limited
NIB Bank Limited
National Bank of Pakistan
Soneri Bank Limited
Summit Bank Limited
The Bank of Punjab
United Bank Limited
Registered Office
P-225 Tikka Gali # 2
Montgomery Bazar
Faisalabad
Share Registrar Office
Vision Consulting Limited
3-C, LDA Flats, Lawrance
Road, Lahore
Projects Locations
30-k.m. Shaiekhupura Road
Faisalabad
Spinning Unit
Sargodha Road Faisalabad
Weaving Unit
1-k.m. Khurrianwala
Jaranwala Road
Faisalabad
Processing & Stitching Unit
Chapter No 2
Organizational Structure/Hierarchy
2.1 Mr. Khurram Iftikhar (Chief Executive Officer)
On completing his education from Kensington College of Business, London, Mr. Khurram
started his career by joining the family business and has played pivotal role in developing and
consolidating the export business of the Company. Considering his glorious service to his
business, he has been awarded Gold Medal for “Businessman of the Year 2001–02”.
Apart from contributing to his family business he has served in several organizations in
various capacities.
2.2 Mr. Shahzad Iftikhar – Director Operations
After completing his MBA, Mr. Shahzad Iftikhar has played role of an anchor person in
strengthening Company’s Operations. Mr. Shahzad is responsible for all the Operations of the
Company ranging from Spinning, Weaving, Processing and Value addition activities. Mr.
Shahzad is also responsible for ensuring that the Company stays abreast of the latest
technology not just by updating existing Plant and Machinery but also introducing latest
technology of industrial engineering.
2.3 Mr. Nadeem Iftikhar – Director Marketing
Mr. Nadeem Iftikhar spearheads the marketing division of the Company. Over the years,
Amtex has made its presence felt in every corner of the Global market courtesy of pro-active
Mr. Khurram Iftikhar
Chief Executive Officer
Mr. Nadeem Iftikhar
Directing Marketing
Mr. Shahzad Iftikhar
Director Operations
marketing strategies initiated by the Company under the leadership and the vision of its
Senior Management. After completing education, Mr. Nadeem decided to head the marketing
team of Amtex and has achieved many milestones in introducing and developing the Product
range of Amtex. He has been responsible for exploring new international markets and has
played a pivotal role in establishing Amtex name as one of the best garment manufacturing
units in the country.
Name Designation No. of Meetings Attended
Khurram Iftikhar C.E.O 7
Shahzad Iftikhar Director 8
Nadeem Iftikhar Director 8
Suhail Maqsood Ahmed Director 7
Muhammad Ahsan Director 6
Gul Muhammad Naz Director 6
Usman Ghani Director Director 5
Category Names
Independent Directors Suhail Maqsood Ahmed
Executive Directors
Khurram Iftikhar
Shahzad Iftikhar
Nadeem Iftikhar
Non-Executive Directors
Usman Ghani
Muhammad Ahsan
Gul Muhammad Naz
Chapter No 3
Products and Services
3.1 Fabrics
We can produce fabric from 1016mm to 3200mm width in 100% Cotton, Poly / Cotton,
100% Polyester, Viscose, Acrylic, Acetate rayon, Triacetate, Poly / Viscose, Poly / Acrylic,
Poly / Acetate, Polypropylene (all blend ratios) with plain and different weaves like Twills,
Drills, Satins, Debbie’s, Jacquards. All these qualities are available in Grey, Bleach, Dyed,
Coated &Flocked and Printed Fabric (Pigment & Reactive).
Blends Weaves Dyeing Printing Finishing Coating Flockin
g
Blinds
100%
Cotton
Cretonne Reactiv
e
Pigment Special
Finishes
Single
Pass
Acrylic
Foam
Backing
Flock
Pattern
Printing
Vertical
s Blinds
100%
Polyester
Rein
Force
Dispers
e
Reactive Fashion
Trends
Velour/
Flocked
Fabrics
Roman
Blinds
Poly/Cotton Percale
(180-300
Threads)
Vat Special
Printing
Chinte Two/Thre
e Pass
(ply) Back
out
Holland
Blinds
100%
Cotton
Satin
(150-600
Threads)
Dispers
e
Reactiv
e
Burn Out Easy
Care
Water
Repellant
Roller
Blinds
100%
Viscose
Twill Dispers
e Vat
Glow I
the Dark
Bukram Shower
CurtainDrill
Poly/Viscos BFC Pigmen Metallic Special Table
Products
Fabrics Home Textile Garments
e Canvas t Effect Cloth
Hi/Low
BFC
Auto men Direct Puff Emerising
(Peach)
Out Door
Fabrics/
RainwearOxford Resist
and
Discharg
e
Raising
Fine
Twills
Herring
Bone
Panel
Print
Fabric
Protectio
n
Sports
Wear
Novelty
Weaves
Soil &
Satin
Resistanc
e
Slub
Fabric
Naps
Fabric
Dobby Water and
Oil
Repellant
(Teflon)
Panama User
Protectio
n
Half
Panama
Sanitized
Jacquard Down
Proof
Seersucke
r
Flame
Retardant
Voile Normal
Finishes
Soft
Heavy
Stiff
3.2 Home Textile
Amtex is fully equipped to offer customers a variety of textile products, according to the
diversified needs of our valued customer by following new trends. We make uniquely styled
& designed products as per the aesthetic sense of the customer, keeping in mind the specific
requirement of final consumer. At Amtex our customers have the option to select from a rich
variety of fabrics, exported in the form of piece goods as well as various confections in made
ups.
Bed Linen Kitchen
Products
Upholstery
Range
Quilted Range Curtains
Covers and
Pillow Case
Runners Cushions and
Neck Rolls
Bed Spreads Rod Pocket
Curtains
Flat and Fitted
Sheets
Place Mate Grand Foulards
and throws
Comforters and
Shams, Mattress
Cover
Comice/Plain
Valances
Valances and
Bed Shirts
Tea Cozy Chair and Sofa
Covers
Chair Pads and
Seats Backs
Metal Ring/
Eyelet Curtains
Mattress Covers Aprons Futon Covers Sleeping Bags,
Bumper pads,
Baby Quilts
Tab Tops and
Loop Curtains
Comforter
Shells and
Shams
Kitchen Bags Jabots Sels,
Plemets and
Scarts
Pot Holders and
Oven Gloves
Tape and (Pinch)
Pleated Curtains
Table Covers
with Napkins
Folding Curtains
and Roman
Blinds
Printed Kitchen Tie Backs in
Tea Towels Various
Confections
Kitchen
Curtains
Shower Curtains
3.3 Garments
Our apparel division is producing both light & heavy weight garments. A comprehensive
Quality Control & Assurance System is working continuously monitor, control and assure the
quality Standards. Various inspections in cutting, stitching, washing, finishing and packing
facilitate us to maintain AQL levels as per customer's requirement
3.3.1 Product Line
 Light Weight Garments
 Lounge Wear
 Sleep Wear
 Casual Shirts
 Hospital Wear
 Scrub Sets
 Heavy Weight
 Bottom Wear (Basic & Fashion)
 Work Wear
Garment Wet Processing State of the art imported machines are utilized to enhance the fabric
handle, feel, wash and natural look of the garment. GWP is fully equipped to produce
following types of washes and special effects.
 Rinse Wash
 Silicon Wash
 Stone Wash
 Enzyme Wash
 Bleach Wash
 Distress
 Sand Blast
 Spray
 Moustache
 Distress
 Tints
Chapter No 4
SWOT Analysis
4.1 Amtex Ltd financial SWOT analysis
Strengths, Weaknesses, Opportunities, Threats of Amtex Ltd. Find 100,000 more
reports and SW
This financial SWOT analysis of Amtex Ltd provides a strategic SWOT analysis of the
company's businesses and operations. The profile shows a comprehensive view of the
company's key strengths and weaknesses and the potential opportunities and threats.
4.1.1 Categories: strategic management, cost analysis, company report, market analysis
Tag: company history, key employees, major products and services, business description
4.1.2 Description: We see a growing market and believe that this trend will continue. New
products and services can be seen.
This SWOT Analysis of Amtex Ltd provides a strategic SWOT analysis of the company's
businesses and operations. This free SWOT analysis shows strengths, weaknesses,
opportunities and threats. This SWOT analysis of Amtex Ltd can provide a competitive
advantage.
This SWOT analysis contains 695 data points.
4.1.3 SWOT analysis of Amtex Private Limited.
Financial and Strategic SWOT Analysis provides a comprehensive insight into the
company’s history, corporate strategy, business and financial structure, management and
operations. The report contains a detailed SWOT analysis, information on the company’s
products and services, key competitors, as well as detailed financial information.
Data on this page may have come in part, or entirely, from one or more data providers. Please
contact us for further information. We are not responsible for any errors or omissions on this
page. This website is for information purposes only. This is a sample report.
Strengths
-monetary assistance provided
-experienced business units
-barriers of market entry
-domestic market
-One window operations
-Providing multiple types of product.
Weaknesses
-high loan rates are possible
-future market size
-Lack of direct Relationship with non
Managerial Employees
-Lack of transportation facility to employees
-No proper way for requiting new
employees.
Opportunities
-new products and services
-income level is at a constant increase
-new markets
-Reduced the cost of product, scarification
of quality
-Provides out sourcing Services
Threats
-growing competition and lower profitability
-government regulations
-rising cost of raw materials
-financial capacity
-price changes
-technological problems
-increasing rates of interest
-increasing costs
4.1.4 Compliance
Compliance is necessary to make sure that any business or action conducted by a company is
within legal parameters. The compliance unit develops initiates, maintains, and revises
policies and procedures for the general operation of the compliance program and its related
activities to prevent illegal, unethical, or improper conduct.
4.1.5 Financial and strategic SWOT analysis
A financial and strategic SWOT (strengths, weaknesses, opportunities and threats) Analysis
provides a comprehensive insight into the company’s history, corporate strategy, financial
data, business structure, business divisions and key operations. Each report contains a
detailed SWOT analysis with additional information on the key competitors, market
structure, major products, brands and services, as well as detailed financial data for the last 5
years.
4.1.6 Due Diligence
Due diligence is the process of systematically researching and verifying the accuracy of a
financial statement, business or investment.
Chapter no 5 Financial Statements Analysis
(03 Consecutive Annual Years)
Prepare 03 Years Income Statement/Profit and Loss Account
Note
2016 2015 2014
Sales 25 2,154,385,182 2,905,180,803 2,812,437,021
Cost of Sales
26
2,777,481,623 3,590,902,113 3,920,739,449
Gross loss (623,096,441) (685,721,310) (1,108,302,428)
Other (loss) / income
27
(11,265,326) 47,416,734 82,669,382
(634,361,767) (638,304,576) (1,025,633,046)
Selling and distribution expenses 28 18,310,803 24,819,187 17,929,077
Administrative expenses 29 706,427,594 747,506,761 735,887,202
Finance cost 30 155,260,377 180,418,898 179,906,637
879,998,774 952,744,846 933,722,916
Loss before taxation (1,514,360,541) (1,591,049,422) (1,959,355,962)
Provision for taxation 31 11,537,056 11,068,987 7,277,808
Net loss for the year (1,525,897,597) (1,602,118,409) (1,966,633,770)
Loss per share - Basic and diluted 32 (5.87) (6.16) (7.56)
Note
2016 2015 2014
EQUITY AND LIABILITIES
PKR (3,000,000,000)
PKR (2,000,000,000)
PKR (1,000,000,000)
PKR -
PKR 1,000,000,000
PKR 2,000,000,000
PKR 3,000,000,000
PKR 4,000,000,000
PKR 5,000,000,000
2016
2015
2014
SHARE CAPITAL AND RESERVES
Authorized capital
260,000,000 (2015: 260,000,000)
ordinary shares of Rs.10/- each 2,600,000,000 2,600,000,000 2,600,000,000
Issued, subscribed and paid up capital 3 2,594,301,340
(7,227,441,423)
2,594,301,340 2,594,301,340
Reserves 4 (5,791,753,557) (4,353,370,923)
(4,633,140,083) (3,197,452,217) (1,759,069,583)
SURPLUS ON REVALUATION OF
PROPERTY, PLANT AND EQUIPMENT
5
1,637,742,714 1,730,109,065 1,894,881,582
NON-CURRENT LIABILITIES
Redeemable capital 6 - - -
Long term financing 7 1,580,939,617 1,558,109,833 1,828,728,822
Liabilities against assets subject to finance
lease
8
- -
Deferred liabilities 9 780,316,203 622,757,818 575,535,980
2,361,255,820 2,180,867,651 2,404,264,802
CURRENT LIABILITIES
Trade and other payables 10 385,792,130 387,238,772 406,955,359
Interest / markup payable 11 2,599,616,255 2,757,538,041 2,709,953,887
Short term borrowings 12 7,371,076,295 6,956,027,934 6,857,129,814
Current portion of noncurrent liabilities 13 739,812,129 1,084,436,842 946,447,477
11,096,296,809 11,185,241,589 10,920,486,537
Contingencies and commitments 14 - - -
10,462,155,260 11,898,766,088 13,460,563,338
ASSETS Note 2016 2015 2014
NON-CURRENT ASSETS
Property, plant and equipment 15 4,078,928,051 4,334,512,927 4,699,965,450
Long term deposits 16 62,021,425 55,342,868 35,967,868
4,140,949,476 4,389,855,795 4,735,933,318
CURRENT ASSETS
Stores, spares and loose tools 17 664,545,130 698,112,426 749,728,790
Stock in trade 18 1,797,415,644 2,204,661,263 2,790,660,569
Trade debts 19 3,357,835,924 4,026,403,565 4,671,392,930
Loans and advances 20 21,333,830 41,387,533 27,819,296
Deposits and prepayments 21 9,998,782 7,592,174 11,132,806
Other receivables 22 94,798,690 101,546,257 110,145,065
Tax refunds due from the
Government 23 229,188,251 256,798,777 212,469,281
Cash and bank balances 24 146,089,533 172,408,298 151,281,283
6,321,205,784 7,508,910,293 8,724,630,020
10,462,155,260 11,898,766,088 13,460,563,338
-1E+10
-5E+09
0
5E+09
1E+10
1.5E+10
2016
2015
2014
5.1 Ratio Analysis
5.1.1 Acid test or quick ratio
The acid test or quick ratio is used to determine how quickly a company would be able to pay
off its current liabilities if it needs to convert its „quick‟ assets into cash.
Acid test or quick ratio = (Cash & bank balances + Trade debtors + Short term investments)/
Current Liabilities.
The ideal quick ratio is 1:1, which measures the firm’s capacity to payoff claims of current
creditors immediately.
Equation of Acid Test or Quick Ratio:
(Cash & bank balances + Trade debtors + Short term investments
*
)
Current Liabilities
In 2014 =
151,281,283+4,671,392,930+11,132,806
10,920,486,537
= 0.44:1
In 2015 =
172,408,298+4,026,403,565+7,592,174
11,185,241,589
= 0.38:1
In 2016 =
146,089,533+3,357,835,924+9,998,782
11,096,296,809
= 0.32:1
NOTES:
* Short term investment = Deposits and prepayments
5.1.2 Financial expenses to sales
0
2E+09
4E+09
6E+09
8E+09
1E+10
1.2E+10
1.4E+10
1.6E+10
2016
2015
2014
It shows the ratio of financial expenses to sales. Lowering the ratio indicates the financial
discipline of the company and the increasing ratio indicates that the company is facing
financial expenses burden out of its sales revenue
Financial expense to sales = Financial expenses/ Sales
Equation of Financial expense to sales:
Financial expenses
Sales
In 2014 =
179,906,637
2,812,437,021
= 0.063968
In 2015 =
180,418,898
2,905,180,803
= 0.0621024680507639
In 2016 =
155,260,377
2,154,385,182
= 0.072067139292086
5.1.3 Trade debt to sales
It is the ratio of outstanding credit (all sales receivables) to the total sale proceeds of the
company. Higher the percentage, the company is increasing its debtors and credit risk and
reducing its liquidity position.
Trade debt to sales= Trade debt/ Sales
Equation of Trade debt to sales:
Trade debt
Sales
In 2014 =
4,671,392,930
2,812,437,021
=1.660976901925087
In 2015 =
4,026,403,565
2,905,180,803
= 1.385939064736413
In 2016 =
3,357,835,924
2,154,385,182
= 1.558605189106801
5.1.4 Assets turnover ratio
It is the ratio of total sale proceeds to the total assets of the company. Higher the ratio, the
company is sufficiently using its assets in generating revenues and lowers the ratio; the
company is insufficient in generating revenues.
Assets turnover ratio= Sales/ (Non-Current Assets + Current Assets)
Equation of Assets turnover ratio:
Sales
(Non-Current Assets + Current Assets)
In 2014 =
2,812,437,021
4,735,933,318+8,724,630,020
= 0.2089390280613529
In 2015 =
2,905,180,803
4,389,855,795+7,508,910,293
= 0.2441581573680903
In 2016 =
2,154,385,182
4,140,949,476+6,321,205,784
= 0.2059217368181171
5.1.5 Current ratio
It is the ratio of total current assets to the total current liabilities. Higher current ratio shows
that the company is in a well-off situation and lower current ratio shows the worsening
situation.
Current ratio= Current Assets/ Current Liabilities
Equation of Current ratio:
Current Assets
Current Liabilities
In 2014 =
8,724,630,020
10,920,486,537
= 0.7989231972806195
In 2015 =
7,508,910,293
11,185,241,589
= 0.6713230316262953
In 2016 =
6,321,205,784
11,096,296,809
= 0.5696680516758517
5.1.6 Cost of goods sold to sales
This ratio is derived by dividing cost of sales of goods to the total amount of sale proceeds.
Higher the ratio, lower the gross profit margins and lower the ratio, higher the gross profit
margins of the company.
Cost of goods sold to sales= Cost of goods sold/ sales
Equation of Cost of goods sold to sales:
Cost of goods sold
sales
In 2014 =
3,920,739,449
2,812,437,021
= 1.394071909779487
In 2015 =
3,590,902,113
2,905,180,803
= 1.236033953305728
In 2016 =
2,777,481,623
2,154,385,182
= 1.289222394493799
7. Debt equity ratio
This is a measure of company’s financial leverage and calculated by dividing its total
liabilities by stockholders' equity. It indicates what proportion of equity and debt the
company is using to finance its assets. The higher ratio generally means that a company has
been aggressive in financing its growth with debt. This can result in volatile earnings as a
result of the additional interest expense.
Debt equity ratio = (Current Liabilities + Non-Current Liabilities)/ Shareholder’s equity
It provides a margin safety to creditors. The smaller the ratio, the more secured are the
creditors. An appropriate debt to equity ratio is 0.33. A higher ratio than this is an indication
of financial risk policy.
Equation of Debt Equity Ratio:
(Current Liabilities + Non-Current Liabilities)
Shareholder’s equity*
In 2014 =
10,920,486,537+2,404,264,802
135811999
= 98.11173855853488
In 2015 =
11,185,241,589+2,180,867,651
(1467343152)
= -9.10905484
In 2016 =
11,096,296,809+2,361,255,820
(2995397369)
= -4.49274369
NOTES:
* Shareholder’s equity = (Issued, subscribed and paid up capital)+( Reserves)+( SURPLUS
ON REVALUATION OF PROPERTY, PLANT AND EQUIPMENT)
5.1.8 Return on assets (ROA)
This is an indicator that reflects how profitable a company is relative to its total assets. ROA
gives an idea as to how efficient management is at using its assets to generate earnings. This
is calculated by dividing a company's annual earnings by its total assets. The higher the ROA,
the better, because the company earns more money on less investment.
ROA = Net profit before taxes/ Average of (Non-Current Assets + Current Assets)
Equation Return on assets:
Net profit before taxes
Average of (Non-Current Assets + Current Assets)
*
In 2014 =
(1,959,355,962)
6,730,281,669
= -0.2911254028230182
In 2015 =
(1,591,049,422)
5,949,383,044
= -0.2674309941439366
In 2016 =
(1,514,360,541)
5,231,077,630
= -0.2894930353002618
NOTES:
* Average of (Non-Current Assets + Current Assets) = (Non-Current Assets + Current
Assets)/2
OR Total Assets/2
5.1.9 Return on equity (ROE)
It measures a firm's efficiency at generating profits from every unit of shareholders' equity. It
shows how well a company uses its resources to generate earnings growth. The ROE is useful
for comparing the profitability of a company to that of other firms in the same industry.
ROE = Net profit before taxes/ Average of Shareholder’s equity
Equation of Return on equity (ROE):
Net profit before taxes
Average of Shareholder’s equity*
In 2014 =
(1,959,355,962)
67,906,000
= -28.85394459988808
In 2015 =
(1,591,049,422)
(733,671,576)
= 2.168612597307436
In 2016 =
(1,514,360,541)
(1,497,698,685)
= 1.011124972043359
NOTES:
* Average of Shareholder’s equity = Shareholders Equity/2
5.1.10 Return on capital employed (ROCE)
ROCE compares earnings with capital invested in the company. ROCE should always be
higher than the rate at which the company borrows; otherwise any increase in borrowing will
reduce shareholders' earnings.
ROCE = Net profit before taxes/ Average of Total capital employed
Equation of Return on Capital Employed (ROCE):
Net profit before taxes
Average of Total capital employed
*
In 2014 =
(1,959,355,962)
1,270,038,401
= -1.5427533218344
In 2015 =
(1,591,049,422)
356,762,250
= -4.459691074377965
In 2016 =
(1,514,360,541)
(317,070,775)
= 4.776096254850356
NOTES:
* Average of total capital employed = Shareholders Equity+ Non-Current Liabilities/2
5.1.11 Dividend cover ratio
This measures the ability of a company to pay dividends to ordinary shareholders from after
tax income and measured as:
Dividend cover ratio= (Net profit before taxes - Tax provision)/ Total amount of dividend
If a company is operating in a sector that is reasonably unaffected by economic downturns,
such as food manufacturing and retailing, the lower dividend cover is more acceptable,
because the risk is lower.
Equation of Dividend cover ratio:
(Net profit before taxes - Tax provision)
Total amount of dividend
In 2014 =
(1,959,355,962)−7,277,808
(1,966,633,770)
= 1
In 2015 =
(1,591,049,422)−11,068,987
(1,602,118,409)
= 1
In 2016 =
(1,514,360,541)−11,537,056
(1,525,897,597)
= 1
5.1.12 Inventory Turnover Ratio
A ratio showing how many times a company's inventory is sold and replaced over a period.
The inventory turnover ratio is calculated as
Inventory Turnover Ratio = Sales / Inventory
This ratio should be compared against industry averages. A low turnover implies poor sales
and, therefore, excess inventory. A high ratio on the other hand implies strong sales.
High inventory levels are unhealthy because they represent an investment with a rate of
return of zero. It also opens the company up to trouble should prices begin to fall.
Equation of Inventory Turnover Ratio:
Sales
Inventory
In 2014Inventory Turnover Ratio =
2,812,437,021
2,790,660,569
= 1.007803332387286
In 2015Inventory Turnover Ratio =
2,905,180,803
2,204,661,263
= 1.317744749162402
In 2016Inventory Turnover Ratio =
2,154,385,182
1,797,415,644
= 1.198601552841497
5.1.13 Interest cover ratio
This ratio measures the efficiency of a company for its ability to pay its interest-payment on
its borrowing from operating profit and measured as
Interest cover ratio = Net profit before interest and tax payment / Interest expenses
= (Net profit before taxes+ Interest expenses) / Interest expenses
The higher the figure, the safer is the company. The company with interest cover ratio 2 will
suffer a 50% drop in the profit and a company with a ratio less than 1 would have to dip into
cash reserve.
Equation OF Interest cover ratio:
Net profit before taxes + Interest Expenses
Interest expenses
In 2014 =
(1,959,355,962)+179,906,637
179,906,637
In 2015 =
(1,591,049,422)+180,418,898
180,418,898
In 2016 =
(1,514,360,541)+155,260,377
155,260,377
5.1.14 Net profit margin
This ratio is achieved as a ratio of profit earned by a company from its sale proceeds.
Net profit margin= Net profit before taxes/ sales
Equation of Net profit margin:
Net profit before taxes
Sales
In 2014 Net profit margin =
(1,959,355,962)
2,812,437,021
= -0.6966754979293099
In2015 Net profit margin =
(1,591,049,422)
2,905,180,803
= -0.5476593471762659
In 2016 Net profit margin =
(1,514,360,541)
2,154,385,182
= -0.7029200505334705
5.1.15 Operating cash flow to debt ratio
This ratio is obtained by dividing the net cash flow balance from operating activities from
total liabilities and mathematically it may be derived as:
Operating cash flow to debt ratio =Cash flows from operations/ (Current Liabilities+ Non
-Current Liabilities)
This ratio measures the ability of the company's operating cash flow to meet its obligations.
The operating cash flow is simply the amount of cash generated by the company from its
main operations, which are used to keep the business funded. The higher the ratio, the safer
the company. A minimum value of 0.2 is often used as guided level.
Equation of operating cash flow to debt ratio:
Cash flows from operations
(Current Liabilities+ Non -Current Liabilities)
In 2014 =
(22,865,954)
11,185,241,589 + 2,180,867,651
= -0.0017107412179133
In 2015 =
96,022,845
11,185,241,589+2,180,867,651
= 0.0071840535847663
In 2016 =
107,788,028
11,096,296,809+2,361,255,820
= 0.008009482182349
5.1.16 Earnings per share after tax (Rs./share)
It is arrived at by dividing the net profit (after tax) by the number of ordinary shares.
Earnings per share after tax (Rs.) = (Net profit before taxes - Tax provision)/ Number of
ordinary shares
Equation of earnings per share after tax (Rs.)
(Net profit before taxes - Tax provision)
Number of ordinary shares
In 2014 =
(1,959,355,962)−7,277,808
260,000,000
= -7.563976038461538
In 2015 =
(1,591,049,422)−11,068,987
260,000,000
= -6.161993880769231
In 2016 =
(1,514,360,541)−11,537,056
260,000,000
= -5.868836911538462
5.1.17 Break- up value shares (Rs. /share)
It is obtained by dividing the amount of shareholders equity by the number of ordinary
shares.
Break- up value shares (Rs. /share) = Shareholder’s equity/ Number of ordinary shares
Equation of Break- up value shares (Rs. /share)
Shareholder’s equity
Number of ordinary shares
In 2014Break- up value shares =
2,600,000,000
260,000,000
= (Rs.10 /share)
In 2015 Break- up value shares =
2,600,000,000
260,000,000
= (Rs.10 /share)
In 2016Break- up value shares =
2,600,000,000
260,000,000
= (Rs.10 /share)
Vertical Analysis
2016
Rupees
2015
Rupees
2014
Rupees
Sales 76.60 103.30 100
Cost of Sales 70.84 91.59 100
Gross loss 56.22 61.87 100
Other (loss) / income -13.63 57.36 100
61.85 62.24 100
Selling and distribution expenses 102.13 138.43 100
Administrative expenses 96.00 101.58 100
Finance cost 86.30 100.28 100
94.25 102.04 100
Loss before taxation 77.29 81.20 100
Provision for taxation 158.52 152.09 100
Net loss for the year 77.59 81.47 100
Loss per share - Basic and diluted 77.59 81.47 100
Horizontal Analysis
2016
Rupees
2015
Rupees
2014
Rupees
Sales 140.86 100 100
Cost of Sales 128.92 123.60 139.41
Gross loss -28.92 -23.60 -39.41
Other (loss) / income -0.52 1.63 2.94
-29.45 -21.97 -36.47
Selling and distribution expenses 0.85 0.85 0.64
Administrative expenses 32.79 25.73 26.17
Finance cost 7.21 6.21 6.40
40.85 32.79 33.20
Loss before taxation -70.29 -54.77 -69.67
Provision for taxation 0.54 0.38 0.26
Net loss for the year -70.83 -55.15 -69.93
Loss per share - Basic and diluted -3E-07 -2.1E-07 -2.7E-07
-40.00
-20.00
0.00
20.00
40.00
60.00
80.00
100.00
120.00
140.00
160.00
180.00
2016
2015
2014
Vertical Analysis
2016
Rupees
2015
Rupees
2014
Rupees
EQUITY AND LIABILITIES
SHARE CAPITAL AND RESERVES
Authorized capital
260,000,000 (2015: 260,000,000)
ordinary shares of Rs.10/- each
Issued, subscribed and paid up capital 24.80 21.80 19.27
Reserves -69.08 -48.68 -32.34
-44.28 -26.87 -13.07
SURPLUS ON REVALUATION OF 15.65 14.54 14.08
PROPERTY, PLANT AND EQUIPMENT
NON-CURRENT LIABILITIES
Redeemable capital
Long term financing 15.11 13.09 13.59
Liabilities against assets subject to finance lease
Deferred liabilities 7.46 5.23 4.28
22.57 18.33 17.86
-100.00
-50.00
0.00
50.00
100.00
150.00
200.00
2016
2015
2014
CURRENT LIABILITIES
Trade and other payables 3.69 3.25 3.02
Interest / markup payable 24.85 23.17 20.13
Short term borrowings 70.45 58.46 50.94
Current portion of non current liabilities 7.07 9.11 7.03
106.06 94.00 81.13
Contingencies and commitments
100 100 100
-80
-60
-40
-20
0
20
40
60
80
100
120
2016
2015
2014
ASSETS 2016 2015 2014
NON-CURRENT ASSETS Rupees Rupees Rupees
Property, plant and equipment 38.99 36.43 34.92
Long term deposits 0.59 0.47 0.27
39.58 36.89 35.18
CURRENT ASSETS
Stores, spares and loose tools 6.35 5.87 5.57
Stock in trade 17.18 18.53 20.73
Trade debts 32.10 33.84 34.70
Loans and advances 0.20 0.35 0.21
Deposits and prepayments 0.10 0.06 0.08
Other receivables 0.91 0.85 0.82
Tax refunds due from the Government 2.19 2.16 1.58
Cash and bank balances 1.40 1.45 1.12
60.42 63.11 64.82
100 100 100
0
20
40
60
80
100
120
2016
2015
2014
Horizontal Analysis
2016
Rupees
2015
Rupees
2014
Rupees
EQUITY AND LIABILITIES
SHARE CAPITAL AND RESERVES
Authorized capital
260,000,000 (2015: 260,000,000)
ordinary shares of Rs.10/- each 100.00 100.00 100.00
Issued, subscribed and paid up capital 100.00 100.00 100.00
Reserves 166.02 133.04 100.00
263.39 181.77 100.00
SURPLUS ON REVALUATION OF 86.43 91.30 100.00
PROPERTY, PLANT AND EQUIPMENT
NON-CURRENT LIABILITIES
Redeemable capital
Long term financing 86.45 85.20 100.00
Liabilities against assets subject to finance lease
Deferred liabilities 135.58 108.20 100.00
98.21 90.71 100.00
CURRENT LIABILITIES
Trade and other payables 94.80 95.16 100.00
Interest / markup payable 95.93 101.76 100.00
Short term borrowings 100.00
Current portion of non current liabilities 78.17 114.58 100.00
101.61 102.42 100.00
Contingencies and commitments
77.72 88.40 100.00
ASSETS 2016 2015 2014
NON-CURRENT ASSETS Rupees Rupees Rupees
Property, plant and equipment 86.79 92.22 100
Long term deposits 172.44 153.87 100
87.44 92.69 100
CURRENT ASSETS
Stores, spares and loose tools 88.64 93.12 100
Stock in trade 64.41 79.00 100
Trade debts 71.88 86.19 100
Loans and advances 76.69 148.77 100
Deposits and prepayments 89.81 68.20 100
Other receivables 86.07 92.19 100
Tax refunds due from the Government 107.87 120.86 100
Cash and bank balances 96.57 113.97 100
72.45 86.07 100
77.72 88.40 100
0
50
100
150
200
250
300
2016
2015
2014
NOTES OF FINANICAL STATEMENTS 2014 TO 2016
1. STATUS AND ACTIVITIES
1.1. Amtex Limited (the Company) is a public limited company incorporated in Punjab,
Pakistan under the Companies Ordinance, 1984 and listed on Pakistan Stock
Exchange Limited (formerly Karachi Stock Exchange Limited) in Pakistan. The
registered office of the Company is situated at P-225, Tikka Gali No. 2, Montgomery
Bazar, Faisalabad. The principal business of the Company is export of all kinds of
value added fabrics, textile made-ups, casual and fashion garments duly processed.
The Company is also engaged in the business of manufacturing and sale of yarn and
fabrics on its own & conversion basis. The cloth processing unit and stitching units
are located at 1 KM Jaranwala Road, Khurrianwala, District Faisalabad and spinning
unit is located at 30 KM Sheikhupura Road, Khurrianwala, District Faisalabad, in the
province of Punjab.
1.2. Pursuant to scheme of arrangement approved by the Honorable Lahore High Court,
Lahore, assets, liabilities and reserves of Amtex Spinning Limited were merged with
the assets, liabilities and reserves of the Company with effect from April 01, 2003.
1.3. The Company has incurred loss before taxation of Rs. 1,514,360,541/- and its sales
have been slightly increased during the year as compared to previous corresponding
year. The drop in the production and sale due to under utilization of production
capacity because of continuous load management by the utility companies has
resulted in higher operating cost. Further overall yarn prices faces significant
downfall due to which spinning sector survival becomes very hard day by day. Due
to slow turnover of stocks, worst ever textile market conditions, the Company is
facing tight cash flow situation and has not been able to comply with the terms of
certain loan agreements. The Company is in litigation with sukuk unit holders and
0
20
40
60
80
100
120
140
160
180
200
2016
2015
2014
certain other banks / financial institutions has also filed suit against the company for
recovery of their outstanding debts.
The management is hopeful that with the improvement textile market along with
improvement in supply of energy, the production and operating results will improve.
The management of the Company has already taken steps for extension and
restructuring of loans. The major bankers of the Company have agreed to restructure
the facilities (refer note 7.1.2) and negotiations with other banks are in process. There
is material uncertainty related to events or conditions which may cast significant
doubt about the Company’s ability to continue as a going concern and, therefore, it
may be unable to realize its assets and discharge its liabilities in the normal course of
business. The management is confident that it will be successful
2 SIGNIFICANT ACCOUNTING POLICIES
2.1. Statement of compliance
These financial statements have been prepared in accordance with the requirements
of the Companies Ordinance, 1984 (the Ordinance) and directives issued by the
Securities and Exchange Commission of Pakistan and approved accounting standards
as applicable in Pakistan. Approved accounting standards comprise of such
International Financial Reporting Standards (IFRSs) as notified under the provisions
of the Ordinance. Wherever, the requirements of the Ordinance or directives issued
by the Securities and Exchange Commission of Pakistan differ with the requirements
of these standards, the requirements of the Ordinance or the requirements of the said
directives take precedence.
2.1.1. Standards, amendments to standards and interpretations becoming
effective in current period
IFRS 14 Regulatory 1-Jan-16
IAS 1 Presentation of Financial Statements (Amendments) 1-Jan-16
IAS 16 Property, Plant and Equipment (Amendments) 1-Jan-16
IAS 19 Employee Benefits (Amendments) 1-Jan-16
IAS 27 Separate Financial Statements (Amendments) 1-Jan-16
IAS 28 Investment in Associates and Joint Ventures (Amendments) 1-Jan-16
IAS 34 Interim Financial Reporting (Amendments) 1-Jan-16
IAS 38 Intangible Assets (Amendments) 1-Jan-16
IAS 41 Agriculture (Amendments) 1-Jan-16
2.1.2. Standards, amendments to standards and interpretations becoming
effective in current year but not relevant
There are certain new standards, amendments and interpretations that are
mandatory for accounting periods of the Company beginning on or after July 1,
2015 but are considered not to be relevant to the Company’s operations and are,
therefore not disclosed in these financial statements & are not expected to have
any material impact on the company’s financial statements.
2.1.3. Standards, amendments to standards and interpretations becoming
effective in future periods
3. Issued, subscribed and paid up CAPITAL:
2016 2015 2014 2016 2015 2014
Number of shares Rupees Rupees Rupees
237,444,067 237,444,067 237,444,067 Ordinary shares of Rs. 10/- each
fully paid in cash
2,374,440,670 2,374,440,670 2,374,440,670
4,046,067 4,046,067 4,046,067 Ordinary shares of Rs.10/- each
issued as fully paid shares as per
scheme of arrangement for
40,460,670 40,460,670 40,460,670
IFRS 5 Non-current Assets Held for Sale and Discontinued
Operations (Amendments)
1-Jul-16
IFRS 7 Financial Instruments: Disclosures (Amendments) 1-Jul-16
IFRS
11
Joint Arrangements (Amendments) 1-Jan-17
IFRS
15
Revenue from Contracts with Customers 1-Jan-18
IFRS
16
Leases 1-Jan-19
IAS 7 Statement of Cash Flows (Amendments) 1-Jan-17
IAS 12 Income Taxes (Amendments) 1-Jan-17
Amalgamation sanctioned by the
Court.
17,940,000 17,940,000 17,940,000 Ordinary shares of Rs. 10/- each
issued as fully paid bonus shares.
179,400,000 179,400,000 179,400,000
259,430,134 259,430,134 259,430,134 2,594,301,340 2,594,301,340 2,594,301,340
4. Reserves
Notes 2016 2015 2014
Rupees Rupees Rupees
Reserves
Capital Reserves
Merger Reserve 98,039,330 98,039,330 98,039,330
Share premium 4.1 183,000,000 183,000,000 183,000,000
281,039,330 281,039,330 281,039,330
Revenue Reserves
General reserve 4.2 250,000,000 250,000,000 250,000,000
Accumulated loss -7,758,480,753 -6,322,792,887 -4,884,410,253
-7,508,480,753 -6,072,792,887 -4,634,410,253
-7,227,441,423 -5,791,753,557 -4,353,370,923
4.1. This reserve can be utilized by the Company only for the purposes specified in
section 83(2) of the Companies Ordinance, 1984.
4.2. This reserve can be utilized by the Company for various purposes including issue of
bonus shares to shareholders, payment of dividend when profits are insufficient and
further to meet sudden losses due to natural calamities.
5. SURPLUS ON REVALUATION OF PROPERTY, PLANT AND EQUIPMENT
SURPLUS ON REVALUATION OF
PROPERTY, PLANT AND EQUIPMENT 2016 2015 2014
Note Rupees Rupees Rupees
Opening balance 5.1 1,894,881,582 2,076,922,720 2,076,922,720
Less:
Transferred to Comprehensive Income for the
year in respect of:
Incremental depreciation for the year 102,700,076 114,185,719 114,185,719
Surplus realized on disposal of assets during the
year 62,072,441 67,855,419 67,855,419
164,772,517 182,041,138 182,041,138
1,730,109,065 1,894,881,582 1,894,881,582
5.1. This represents surplus on revaluation of freehold land, building on freehold land,
plant and machinery, electric installations and factory equipment. Revaluation of
freehold land on market value basis and building on freehold land, plant and
machinery, electric installations and factory equipment on depreciated replacement
values basis was carried out by independent valuers M/S Observers (Private) Limited
as at June 03, 2004, by M/S BFA (Private) Limited as at June 30, 2009 and latest
revaluation was carried out by independent valuers M/S Empire Enterprises (Pvt)
Limited as at December 31, 2012 on depreciated replacement values basis.
6. Redeemable capital
Note 2016 2015 2014
Rupees Rupees Rupees
Redeemable capital
Secured
Sukuk certificates 6.1 379,166,665 379,166,665 379,166,665
Less Adjusted during the year
-
379,166,665
- 379,166,665 379,166,665
Less : Current portion shown under current liabilities
Installments over due - 379,166,665 379,166,665
Payable within one year - - -
- 379,166,665 379,166,665
- 0 0
6.1. These represent balance out of 130,000 sukuk certificates of Rs. 5,000/- each privately
placed with a banking company.
During the musharika, the legal title to the musharika assets will remain with the
Company, however, a trustee will hold the beneficial title on behalf of the investors.
In addition, these are secured against second charge on all the present and future
fixed assets excluding freehold land and building on freehold land of the Company,
bank guarantee of Rs. 740 million issued in favor of the trustee and by personal
guarantee of two directors of the Company. Bank guarantee of Rs. 740 million is also
secured. Securities are disclosed in Note 7.1.
Sukuk certificates are redeemable in twelve equal quarterly installments commenced
from January 10, 2010 and ending on October 10, 2012.
The certificate holders will be entitled to rental payments for use of musharika assets.
Rental payments shall be calculated to provide return equal to the base rate plus
incremental rental plus service agency charges incurred by the trustee during the
previous quarter.
Base rate is defined as three months KIBOR and incremental rental is defined as
margin of 2% per annum.
The effective yield rate of rental ranges from 8.35% to 9.01% per annum (2015: 10%
to 12.21% per anum).
6.2. The Company has filed suit under Financial Institutions (Recovery of Finances)
Ordinance, 2001 against the sukuk unit holders in the Honorable Lahore High Court,
Lahore and prayed for declaration of undertaking to purchase the sukuk units at a pre-
agreed price as void, unlawful and satisfaction of obligations against the existing
amounts paid. The Company has also sought relief of suspension of operation of the
undertaking and the bank guarantee issued there under till the final decision of the suit.
As per two different interim orders of The Honorable Lahore High Court, Lahore
guarantor has deposited the amount of guarantee against all overdue rentals, as
claimed by the sukuk unit holders amounting Rs. 529,734,801, in an escrow account
opened by the Deputy Registrar (Judicial) to secure the payments due under sukuk
arrangement. The payable sukuk rentals, as claimed by the sukuk holders, have been
adjusted in these financial statements against the amounts paid by the guarantor,
however, due to pending litigation, sukuk unit holders have not received these
payments and sukuk unit holders have not acknowledged the adjustment of sukuk
rentals.
Further, in its final order The Honorable Lahore High Court, Lahore has dismissed
the above referred suit, with no findings on the issue and prayer of the Company,
stating that this Court lacks jurisdiction under Financial Institutions (Recovery of
Finances) Ordinance, 2001 and the plaint is returned to the plaintiff (Company) to be
presented to the court in which the suit should have been instituted. Being aggrieved
Company has filed first appeal against this order before Division Bench of Honorable
Lahore High Court, Lahore and same is pending for adjudication and in its interim
order Division Bench has passed stay order that no amount will be withdrawn, paid
by the guarantor, from escrow account opened by the Deputy Registrar (Judicial) up
till further orders in this matter.
7. Long term financing
Note 2016 2015 2014
Rupees Rupees Rupees
Secured
From banking companies and financial
institutions 7.1
Under mark up arrangements
Demand finance 1,759,020,216 1,783,596,216 1,887,778,216
Term finance 150,000,000 150,000,000 155,000,000
Long term finances 19,176,163 19,176,163 19,176,163
Syndicated term finance 7,875,000 10,500,000 11,288,814
Morabaha finance 19,301,582 19,301,582 19,301,582
Morabaha finance II 160,095,500 169,441,764 189,537,904
Not subject to markup
Demand finance 134,835,000 33,216,000 33,216,000
2,250,303,461 2,185,231,725 2,315,298,679
Less: Current portion
Installments due / overdue 394,928,822 419,842,913 287,103,253
Payable within one year 274,435,022 207,278,979 199,466,604
669,363,844 627,121,892 486,569,857
1,580,939,617 1,558,109,833 1,828,728,822
8. Liabilities against assets subject
to finance lease 2016 2015 2014
Rupees Rupees Rupees
Opening balance 78,148,285 80,710,955 82,117,164
Paid / adjusted during the year -7,700,000 -2,562,670 -1,406,209
70,448,285 78,148,285 80,710,955
Current portion
Installments due / overdue -70,448,285 -67,326,108 -80,710,955
Payable within one year - -10,822,177 -
-70,448,285 -78,148,285 -80,710,955
0 0 0
These represent plant and machinery acquired under separate lease agreements.
The purchase option is available to the Company on payment of last installment and
surrender of deposit at the end of the lease period.
The principal plus financial charges are payable over the lease period in 48 monthly and 16,
24 and 16 quarterly installments. The liability represents the total minimum lease payments.
Furthermore information / records were not made available by the financial institution to
confirm the yearend balance of the outstanding amount due to pending litigation.
The company has entered into restructuring agreement with the M/S First Punjab Modaraba
in respect of inarch facility No. 199 as on September 04, 2015, as a result of which full and
final liability of Rs. 11,260,347 has been decided against outstanding principle and markup,
which will be paid in 10 monthly rentals starting from August 31, 2015. The terms of
arrangement provide for payment of penalty in case of delayed payments.
Reconciliation of minimum lease payment and their present value is given below:
2016 2015 2014
Minimum
lease
payments
Finance
cost for
future
periods
Present
Value of
minimum
lease
payments
Minimum
lease
payments
Finance
cost for
future
periods
Present
Value of
minimum
lease
payments
Minimum
lease
payments
Finance
cost for
future
periods
Present
Value of
minimum
lease
payments
Due within one
year 90,067,391 19,619,106 70,448,285 98,494,284 20,345,999 78,148,285 101,470,997 20,760,042 80,710,955
Due after one
year but not
later than five
years - - - - - - - - -
90,067,391 19,619,106 70,448,285 98,494,284 20,345,999 78,148,285 101,470,997 20,760,042 80,710,955
9. Deferred liabilities
Note 2016 2015 2014
Rupees Rupees Rupees
Deferred markup on:
Demand finance I 7.1.1 679,472,369 537,961,054 468,688,756
Demand finance 7.1.6 49,816,216
Morabaha finance 58,820,643 45,539,783 23,538,637
738,293,012 583,500,837 542,043,609
Staff retirement gratuity 9.1 42,023,191 39,256,981 33,492,371
780,316,203 622,757,818 575,535,980
2016 2015 2014
Rupees Rupees Rupees
9.1.4 Expenses recognized in
profit and loss account
Current service cost 9,078,887 8,914,162 7,966,746
Interest cost 3,663,114 3,108,477 2,725,896
12,742,001 12,022,639
10,692,64
2
2016 2015 2014
Rupees Rupees Rupees
9.1.5 Principal actuarial assumptions
Discount factor used
9.5 % Per
annum
10% Per
annum
13% Per
annum
Expected rate of increase in salaries 8.5% Per 9% Per 12% Per
2016 2015 2014
Rupees Rupees Rupees
9.1.2 Balance sheet
reconciliation as at June 30,
Present value of
defined benefit obligation 42,023,191 39,256,981 33,492,371
2016 2015 2014
Rupees Rupees Rupees
9.1.3 Movement in net
liability recognized
Opening balance as at July
01, 39,256,981 33,492,371 32,108,575
Expenses recognized in profit
and loss account 9.1.4 12,742,001 12,022,639 10,692,642
Paid during the year -12,132,411 -7,294,771 -4,501,150
Re measurement loss on
obligation 2,156,620 1,036,742 -4,807,696
Closing balance as at June
30, 42,023,191 39,256,981 33,492,371
annum annum annum
Expected average remaining working
lives of participating employees 5 years 5 years 5 years
2016 2015 2014
Rupees Rupees Rupees
9.1.6 Yearend sensitivity analysis of
the defined benefit obligation is as
follows: Reworked defined benefit obligation
Change in
assumptio
ns
Increase in
assumptions
Decrease in
assumptions
Increase in
assumptions
Discount rate 100 bps 39,596,792 46,833,110 42,571,532
Salary increase rate 100 bps 45,052,697 41,069,759 37,497,475
10. Trade and other payables 2016 2015 2014
Rupees Rupees Rupees
Creditors 273,977,617 279,166,242 333,070,943
Accrued liabilities 33,141,648 47,832,109 35,976,660
Advance from customers and others 73,506,715 56,431,072 35,904,415
Withholding tax payable 4,176,062 3,038,450 2,003,341
Sales tax withheld 990,088 770,899
385,792,130 387,238,772 406,955,359
10.1. Prior year figures have been reclassified for better presentation.(Refer note # 39.2)
2016 2015 2014
Rupees Rupees Rupees
11. Interest / markup payable
Redeemable capital 88,882,946 100,031,748 100,031,748
Long term financing 104,270,586 246,509,030 197,438,479
Liabilities against assets subject to finance
lease 19,619,106 20,345,999 20,760,042
Short term borrowings 2,386,843,617 2,390,651,264 2,391,723,618
2,599,616,255 2,757,538,041 2,709,953,887
12. Short term borrowings
Note 2016 2015 2014
Rupees Rupees Rupees
Secured
From banking companies and financial
institutions
Under mark up arrangements 12.2
Export finances 5,379,644,687 5,396,530,208 5,335,620,871
Running finance 215,241,005 215,241,005 215,241,005
Morabaha finances 12.3 457,629,841 416,011,426 401,450,753
Cash finances 217,472,910 217,472,910 192,472,910
Forced demand finance 12.4 529,734,801 139,419,334 139,419,334
Payment against documents 299,948,051 299,948,051 299,948,051
Not subject to markup
Demand finance 12.5 271,405,000 271,405,000 271,405,000
Overdraft - - 1,571,890
7,371,076,295 6,956,027,934 6,857,129,814
12.1. The aggregate unveiled short term borrowing facilities available to the
Company is Rs. 2.371 (2015: Rs. Nil).
12.2. Short term borrowings, excluding cash finances are secured against lien on
export documents, hypothecation of current assets, first charge over current assets
ranking pari passu with the charges created in respect of long term financing (Refer
Note 7.1), and ranking charge over current assets of the Company. These are further
secured against first charge over fixed assets ranking pari passu with the charges
created in respect of long term financing (Refer Note 7.1), ranking charge over fixed
assets and by personal guarantee of directors of the Company. Cash finances are
secured against pledge of stocks and personal guarantee of directors / sponsor
directors of the Company.
The effective rate of mark up charged during the year ranges from 5.36 % to
23.725% per annum (2015: 7.28 % to 23.725 per annum).
12.3. Morabaha finances include Morabaha finance I and also include morabaha
facilities availed. These finances are to be repaid from export proceeds realized or
from own source and are for purchase of cotton,PSF, yarn, cloth, chemical, spares
and other raw material. Collateral securities are same as detailed in Note 7.1.6.
12.4. It represents rentals of redeemable capital paid by the guarantor ( Refer Note
6.2). Securities are disclosed in Note 7.1.
12.5. Total amount of demand finance was Rs. 367.722 million. The securities are
disclosed in Note 7.1. Rs.74.989 million was payable on June 29, 2010 as down
payment, Rs. 127.876 million was payable till July 31, 2010 out of proceeds of sales
tax refunds and remaining mark up balance of Rs 164.857 million was payable in 10
equal monthly installments commenced from June 30, 2010 and ending on March 31,
2011.
12.6. Information / records were not made available by the banking companies to
confirm the year end balances amounting to Rs. 1,397.435 million (2015: 99.969
million) out of total outstanding amount due to pending litigation.
Note 2016 2015 2014
Rupees Rupees Rupees
13. Current portion of non current
liabilities
Redeemable capital 6 - 379,166,665 379,166,665
Long term financing 7 669,363,844 627,121,892 486,569,857
Liabilities against assets subject to finance
lease 8 70,448,285 78,148,285 80,710,955
739,812,129 1,084,436,842 946,447,477
14. Contingencies and commitments
14.1. Contingencies
a. Amtex Limited has filed suit in the Honorable Civil Court at Faisalabad
against M/s S.A Rehmat Private Limited for recovery of Rs.28, 230,026/- and
Rendition of account and cancellation of documents. Same is pending
adjudication.
b. M/S Bank Islami (Formerly KASB Bank Limited and now merged in to Bank
Islami) instituted a suit for recovery of Rs.149,802,970/- under Financial
institutions (Recovery of Finances) Ordinance, 2001 in the Honorable Lahore
High Court, Lahore against the Company. The Bank restructured the
outstanding finances as it claimed in referred suit for recovery and also offered
to provide fresh export refinance working capital limits vide its offer letter.
Based on such offer Letter Company entered in to a compromise agreement
with the Bank and Honorable Lahore High Court, Lahore passed the consent
decree. Now, the Bank is not fulfilling its contractual obligations and not
providing the agreed fresh export refinance working capital limits and has
filed Execution Petition for recovery of Rs.192,528,719/-. The company is
filing its legal reply to Execution Petition filed by the Bank in the said matter
is pending adjudication.
c. Amtex Limited filed suit in the court of Honorable Senior Civil Judge
Faisalabad against M/S. Pakistan Cargo Services Private Limited for recovery
of Rs.12,019,087/-. The case has been dismissed for want of evidence. Being
aggrieved, company has filed appeal which is pending for adjudication before
Honorable Additional Session Judge, Faisalabad.
d. M/S Zephyre Textile Limited has filed a suit for recovery of Rs. 2,916,762/-
against the company before the Honorable District Judge Lahore. The
company has duly filed its reply in the said matter and the same is pending
adjudication.
e. M/S. Pak Kuwait Investment Company Private Limited has instituted suit
under Financial Institutions (Recovery of Finances) Ordinance, 2001 for
recovery of Rs. 97,903,568/- along with future markup in the Honorable High
Court Sindh at Karachi against the company. The company has duly filed its
petition for leave to defend in the said matter and the same is pending
adjudication.
f. Bank islami Pakistan Limited has instituted suit against the company in the
Honorable Lahore High Court, Lahore under financial institutions (Recovery
of Finance) Ordinance, 2001 for recovery of Rs. 660,473,859/-. The Company
has duly filed its petition for leave to defend in the said matter and the same is
pending adjudication.
g. M/S National Bank of Pakistan (Islamic Banking Division) has instituted a
suit for recovery of Rs. 106,924,484/- under Financial Institutions ( Recovery
of finances) Ordinance, 2001 in the Honorable Lahore High Court, Lahore
against the company. The company has duly filed its petition for leave to
defend in the said matter and the same is pending adjudication. h. M/S
National Bank of Pakistan has instituted a suit for recovery of Rs.
1,487,663,500/- under Financial Institutions (Recovery of finances)
Ordinance, 2001 in the Honorable Lahore High Court, Lahore against the
company. The company has duly filed its petition for leave to defend in the
said matter and the same is pending adjudication.
h. M/S Faysal Bank Ltd has instituted a suit for recovery of Rs. 6,061,867/-
under Financial Institutions (Recovery of finances) Ordinance, 2001 in the
Honorable Banking Court No. II, Faisalabad against the company. The
company has filed its petition for leave to defend in the said matter and same
is pending adjudication.
i. M/S Saudi Pak Industrial & Agricultural Investment Company Ltd has
instituted a suit for recovery of Rs. 19,122,367/- under Financial Institutions
(Recovery of finances) Ordinance, 2001 in the Honorable Banking Court No.
II, Lahore against the company. Court has passed the decree against the
company and the company has filed an appeal against the court order before
Honorable Lahore High Court, Lahore and same is pending adjudication. The
Honorable Lahore High Court, Lahore has granted stay against the decree and
in compliance of court order, the Company has deposited demand draft
amounting to Rs. 2,625,000/- as at 12-Feb-2016 in the name of Judge Banking
Court Lahore,.
j. M/S Habib Bank Ltd has instituted a suit for recovery of Rs. 946,312,769/-
under Financial Institutions (Recovery of finances) Ordinance, 2001 in the
Honorable High Court Lahore against the company. The company has duly
filed its petition for leave to defend in the said matter and the same is pending
adjudication.
k. The Bank of Punjab has instituted a suit for recovery of Rs. 6,373,121,000/-
under Financial Institutions (Recovery of finances) Ordinance, 2001 in the
Honorable High Court Lahore against the company. The company has filed its
petition for leave to defend the said matter and same is pending adjudication.
l. Askari Bank Ltd has instituted a suit for recovery of Rs. 619,486,166/- under
Financial Institutions (Recovery of finances) Ordinance, 2001 in the
Honorable High Court Lahore against the company. The company has filed its
petition for leave to defend the said matter and same is pending adjudication.
m. The company has filed writ petition in the Honorable Lahore High Court,
Lahore against Federation of Pakistan and others, in the case of investigation
of affairs of the company. The case is pending adjudication.
n. Cases are pending before foreign exchange adjudication officer, State Bank of
Pakistan, for no repatriation of export proceeds within prescribed times. The
default may attract penalties. The financial impact cannot be determined at this
stage.
o. A recovery demand of Rs. 9.4 million has been raised as a result of an order
passed by Additional Commissioner Inland Revenue u/s 122 (5A) of the
Income Tax Ordinance 2001 regarding Tax Year 2012. Department has
deducted Rs. 9 million from Company’s income tax and sales tax refunds.
Said recovery deductions has not yet accounted for due to an appeal filed
before Appellate Tribunal Inland Revenue (ATIR), Lahore.
p. SNGPL in July 2014 has changed the Sui gas Tariff from Rs. 488.23 per
MMBTU to Rs. 573.28 per MMBTU by transferring the category of our unit
from General Industrial to Captive Power. Company has filed writ petition
before the Honorable Lahore High Court, Lahore against the said illegal /
unlawful captive power tariff application by taking plea that we are producing
/ generating electricity only for own consumption / use, moreover, we do not
hold license which is pre-requisite for sale of electricity. Honorable Lahore
High Court, Lahore has granted stay in favor of the company restraining the
SNGPL from charging captive power tariff instead of general industrial tariff.
The company is confident of a favorable outcome of the suit, therefore,
provision amounting to Rs. 38,046,528/- has not been made in these financial
statements.
q. The company has filed suit in Honorable Lahore High Court Lahore
challenging the illegal/ unlawful increase / levy of “Gas Infrastructure
Development Cess” (GIDC) in Sui gas power bills by SNGPL. Honorable
court has granted stay against recovery of enhanced GIDC hence the company
has not paid the enhanced amount of GIDC. Further as the company is
confident that the case will be decided in its favor, and due to impracticability,
no provision in respect of enhanced GIDC is made in these financial
statements.
r. The Company has filed writ petition in Honorable Lahore High Court, Lahore
against Commissioner Inland Revenue Regional Tax Office Faisalabad,
Revenue Officer Faisalabad, Faisalabad Electric Supply Company and others
regarding illegal and un-lawful levy of General Sales Tax on newly acquired
electric connection / bill of spinning division. The court has granted interim
relief for the month of January 2016 and further ordered the respondents to
decide the issue within a period of one month.
s. The Company has filed civil suit, against illegal demand by SNGPL to
increase the security deposit / guarantee amount worked out on the basis of
higher Captive Power Tariff, before Honorable Civil Judge Faisalabad.
Honorable Court of Civil Judge Faisalabad has granted stay order against said
impugned revision of security deposit / guarantee demand.
t. The Company has filed petition and challenged the imposition of various
surcharges on the consumption of electricity and obtained stay order from
Honorable Lahore High Court. No any provision is made in these financial
statements based on the opinion of the legal council that there is not likelihood
of unfavorable outcome or any potential loss.
u. The Company is defendant in various legal proceedings initiated by ex-
employees in labor / civil courts. The Company expects decisions in its favor
based on grounds of case and legal opinion hence no provision has been made.
v. The company has not fully recognized mark up on redeemable capital, long
and short term financing due to aforementioned litigations and also due to
settlements with other banks. Had the mark up been fully charged, net loss for
the year would have been increased by Rs. 668.464 million (2015: 848.496
million) and accumulated loss and interest / markup payable would have been
increased by Rs. 2,484.632 million (2015: 1,816.145 million).
w. Delayed payment of income tax withheld may attract default surcharge and
penal action.
x. Financial impact, if any, of the above (a to x) has not been acknowledged in
these financial statements because of pending litigations.
Note 2016 2015 2014
Rupees Rupees Rupees
14.2 Commitments
Bank guarantees issued in favour of
Sui Northern Gas Pipelines Limited for supply of
gas. 39,018,000 39,018,000 64,018,000
Claim of workers’ welfare fund not
acknowledged.
The Company is claiming exemption from the
levy. 3,333,305 3,333,305
Bank guarantees issued in favor of
Faisalabad Electric Supply Corporation for new
connection. 8,940,000 8,940,000 8,940,000
Collector of Custom (2015 restated) 21,486,791 14,585,666 -
2016 2015 2014
Note Rupees Rupees Rupees
15. Property, plant and equipment
Tangible
Operating fixed assets 15.1 4,078,928,051 4,299,280,603 4,673,948,551
Capital work in progress 15.5 - 35,232,324 26,016,899
4,078,928,051 4,334,512,927 4,699,965,450
2016 2015 2014
Note Rupees Rupees Rupees
15.2 Depreciation for the year has been
allocated as under:
Cost of sales 272,528,451 297,479,889 321,810,952
Administrative expenses 4,473,684 4,863,016 4,581,490
277,002,135 302,342,905 326,392,442
15.3. Had there been no revaluation, the related figures of freehold land, building
on freehold land, plant and machinery, electric installations, factory equipment and
laboratory equipment as at June 30, 2016, 2015 and 2014 would have been as
follows:
2016
Cost
Accumulated
depreciation
Written
down value
……………..Rupees………………
Company owned
Freehold land 143,605,403 143,605,403
Building on freehold land 1,742,753,222 532,063,285 1,210,689,937
Plant and machinery 3,149,040,481 2,179,251,457 969,789,024
Electric installations 92,087,323 62,297,779 29,789,544
Factory equipment 5,882,262 4,360,461 1,521,801
Laboratory equipment 844,749 369,836 474,913
Leasehold
Plant and machinery 173,681,175 112,746,728 60,934,447
5,307,894,615 2,891,089,546 2,416,805,069
2015
Cost
Accumulated
depreciation
Written
down value
……………..Rupees………………
Company owned
Freehold land 143,605,403 - 143,605,403
Building on freehold land 1,703,002,666 469,477,589 1,233,525,077
Plant and machinery 3,135,724,229 2,071,977,353 1,063,746,876
Electric installations 92,087,323 58,987,830 33,099,493
Factory equipment 5,882,262 4,191,372 1,690,890
Laboratory equipment 844,749 317,068 527,681
Leasehold
Plant and machinery 173,681,175 105,976,234 67,704,941
5,254,827,807 2,710,927,446 2,543,900,361
2014
Cost
Accumulated
depreciation
Written
down value
……………..Rupees………………
Company owned
Freehold land 168,093,535 168,093,535
Building on freehold land 1,703,002,666 403,685,256 1,299,317,409
Plant and machinery 3,122,962,932 1,954,424,651 1,168,538,281
Electric installations 92,087,323 55,310,109 36,777,214
Factory equipment 5,882,262 4,003,495 1,878,767
Laboratory equipment 724,749 270,659 454,090
Leasehold
Plant and machinery 173,681,175 98,453,463 75,227,712
5,266,434,642 2,516,147,633 2,750,287,008
Note 2016 2015 2014
Rupees Rupees Rupees
16. Long term deposits
Against utilities 52,646,928 45,968,371 26,593,371
Against TFC 9,374,497 9,374,497 9,374,497
62,021,425 55,342,868 35,967,868
Note 2016 2015 2014
Rupees Rupees Rupees
17. Stores, spares and loose
tools
Stores 650,538,521 680,151,461 730,330,711
Spares 12,131,200 15,485,125 17,412,110
Loose tools 1,875,409 2,475,840 1,985,969
664,545,130 698,112,426 749,728,790
17.1. Stores include items that may result in fixed capital expenditure but are not
distinguishable.
17.2. Stores’ amounting to Rs. 193.453 million is at net realizable value as per
valuation report given by an independent value.
2016 2015 2014
Note Rupees Rupees Rupees
18. Stock in trade
Raw material 747,365,908 867,057,440 1,061,226,051
Work in process 135,529,150 178,881,358 204,979,803
Finished goods 913,024,168 1,155,804,265 1,518,749,713
Waste 1,496,418 2,918,200 5,705,002
1,797,415,644 2,204,661,263 2,790,660,569
18.1. Stock in trade amounting to Rs. 184.375 million (2015 restated: Rs. 184.375
million) was pledged as security with the banks. Due to pending litigation with NBP
& BOP latest pledged stocks sheets are not provided/ made available by the Banks.
18.2. Stock in trade amounting to Rs. 665.077 million (2015: Rs. 235.707 million) is
at net realizable value as per valuation report given by an independent valuer.
19. Trade debts
Note 2016 2015 2014
Rupees Rupees Rupees
Considered good
Unsecured
Foreign 3,175,878,516 3,821,556,302 4,462,911,850
Local 181,957,408 204,847,263 208,481,080
3,357,835,924 4,026,403,565 4,671,392,930
Considered doubtful
Unsecured
Foreign 3,933,360,396 3,322,845,608 2,651,491,122
Less: Provision for doubtful
debts 19.1
-
3,933,360,396
-
3,322,845,608
-
2,651,491,122
0 0 0
3,357,835,924 4,026,403,565 4,671,392,930
19.1 Provision for doubtful
debts
Note 2016 2015 2014
Rupees Rupees Rupees
Opening balance 3,322,845,608 2,651,491,122 1,984,619,236
Created during the year 610,514,788 671,354,486 666,871,886
Closing balance 3,933,360,396 3,322,845,608 2,651,491,122
19.2 The aging of trade debts as at balance sheet date is as under:
Notes 2016 2015 2014
Rupees Rupees Rupees
Not past due 213,859,849 262,186,968 220,116,249
Past due within one year 7,722,964 5,862,152 21,567,750
Past due more than one year 7,069,613,507 7,081,200,053 7,081,200,053
7,077,336,471 7,087,062,205 7,102,767,803
7,291,196,320 7,349,249,173 7,322,884,052
19.3. Past due balances which are considered good are not restated as at balance
sheet date. Had this restatement been made, the loss for the year would have been
decreased by Rs.117.417 million.
2016 2015 2014
Rupees Rupees Rupees
20. Loans and advances
Considered good
Advances
Suppliers and others 21,333,830 41,387,533 27,819,296
2016 2015 2014
Notes Rupees Rupees Rupees
21 Deposits and prepayments
Considered good
Deposits
Export margin 2,173,969 - 3,510,822
Lease deposits 7,251,662 7,251,662 7,251,662
Prepayments 573,151 340,512 370,322
9,998,782 7,592,174 11,132,806
22 Other receivables
2016 2015 2014
Note Rupees Rupees Rupees
Considered good
Export rebate / duty drawback 85,121,390 84,503,600 93,102,408
Federal excise duty 6,677,360 14,042,717 14,042,717
Others 2,999,940 2,999,940 2,999,940
94,798,690 101,546,257 110,145,065
2016 2015 2014
Note Rupees Rupees Rupees
23 Tax refunds due from
Government
Income tax 73,466,668 54,288,053 32,103,302
Sales tax 155,721,583 202,510,724 180,365,979
229,188,251 256,798,777 212,469,281
Note 2016 2015 2014
Rupees Rupees Rupees
24. Cash and bank balances
Cash in hand 116,979,893 138,155,858 127,849,543
Cash at banks
In current accounts 29,087,042 34,240,875 23,420,357
In PLS accounts 22,598 11,565 11,383
146,089,533 172,408,298 151,281,283
Note 2016 2015 2014
Rupees Rupees Rupees
25. Sales
Export
Fabrics / made ups / garments 25.1 853,325,060 787,752,047 506,413,207
Indirect export
Yarn 25.2 57,532,100 101,977,800 79,758,900
Cloth 25.2 77,143,201 25,027,800 3,659,800
Processing and conversion 25.2 122,537,062 208,421,000 294,292,666
1,110,537,423 1,123,178,647 884,124,573
Local
Yarn / cloth 25.2 707,193,943 1,508,719,748 1,703,792,269
Processing and conversion 25.2 164,880,703 110,315,361 88,220,766
Waste and left over
25.2 &
25.3 46,165,737 40,734,083 46,399,103
Printing screens 25.2 138,538,439 130,004,055 90,702,508
2,167,316,245 2,912,951,894 2,813,239,219
Add: Export rebate / duty drawback 6,856,214 6,499,912 3,997,902
2,174,172,459 2,919,451,806 2,817,237,121
Less: Commission 19,787,277 14,271,003 4,800,100
2,154,385,182 2,905,180,803 2,812,437,021
25.2 Gross sales
Note 2016 2015 2014
Rupees Rupees Rupees
Indirect export
Yarn 59,258,063 104,017,356 81,354,078
Cloth 79,457,497 25,778,634 3,769,594
Processing and conversion 126,213,174 212,589,420 300,178,519
Local
Yarn / cloth 728,409,761 1,544,244,342 1,742,748,741
Processing and conversion 169,827,124 112,521,668 89,985,181
Waste and left over 48,144,067 42,272,096 47,430,112
Printing screens 161,048,083 152,104,744 106,121,934
1,372,357,769 2,193,528,260 2,371,588,159
Less: Sales tax -58,366,585 -68,328,413 -64,762,147
1,313,991,184 2,125,199,847 2,306,826,012
25.3. It represents sale of left over / waste material out of goods manufactured.
26. Cost of sales
2016 2015 2014
Note Rupees Rupees Rupees
Cost of goods manufactured 26.1 2,533,279,744 3,225,169,863 3,599,882,229
Finished goods
Opening stock 1,158,722,465 1,524,454,715 1,845,311,935
Closing stock 26.2 -914,520,586
-
1,158,722,465
-
1,524,454,715
244,201,879 365,732,250 320,857,220
2,777,481,623 3,590,902,113 3,920,739,449
26.1 Cost of goods manufactured
2016 2015 2014
Note Rupees Rupees Rupees
Raw material consumed 26.1.1 1,018,034,198 1,688,808,538 1,987,022,603
Salaries, wages and benefits 323,681,166 352,487,998 341,034,509
Staff retirement benefits 12,742,001 12,022,639 10,692,642
Stores and spares 69,647,728 98,975,504 103,815,446
Dyes and chemicals 282,425,392 222,766,261 228,710,063
Packing material 74,513,653 70,218,998 57,564,258
Conversion and processing charges 7,929,689 4,262,744 8,219,914
Engraving and wadding 14,052,919 18,404,030 16,939,584
Repairs and maintenance 9,752,879 19,649,941 17,039,381
Fuel and power 396,534,999 402,361,995 435,976,007
Insurance 1,066,134 618,891 1,496,767
Depreciation 15.2 272,528,451 297,479,889 321,810,952
Other 26.3 7,018,327 11,013,990 20,532,120
2,489,927,536 3,199,071,418 3,550,854,246
Work in process
Opening stock 178,881,358 204,979,803 254,007,786
Closing stock -135,529,150 -178,881,358 -204,979,803
43,352,208 26,098,445 49,027,983
2,533,279,744 3,225,169,863 3,599,882,229
26.1.1 Raw material consumed
2016 2015 2014
Note Rupees Rupees Rupees
Opening stock 867,057,440 1,061,226,051 1,628,065,176
Purchases including purchase
expenses 898,342,666 1,494,639,927 1,420,183,478
1,765,400,106 2,555,865,978 3,048,248,654
Closing stock -747,365,908 -867,057,440
-
1,061,226,051
1,018,034,198 1,688,808,538 1,987,022,603
27. Other income
Note 2016 2015 2014
Rupees Rupees Rupees
Income from financial assets:
Profit on deposit 23,447 209,653 -
Income from assets other than financial
assets:
Markup waived off by banks 726,893 43,183,287 -
Gain on disposal of property, plant and
equipment 1,246,768 3,843,794 81,974,381
Rental income 180,000 180,000 695,001
Trading loss 27.1 -13,442,434
-11,265,326 47,416,734 82,669,382
27.1 Trading loss
2016 2015 2014
Rupees Rupees Rupees
Sale 27.1.1 60,684,871 - -
Cost of sales
-
74,127,305 - -
-
13,442,434 - -
27.1.1
2016 2015 2014
Rupees Rupees Rupees
Gross sales 62,505,417 - -
Less: sales tax -1,820,546 - -
60,684,871 - -
28. Selling and distribution expenses
2016 2015 2014
Note Rupees Rupees Rupees
Steamer freight 9,459,032 13,827,276 12,147,217
Freight and octroi 3,944,720 3,511,272 2,156,639
Clearing and forwarding 2,466,950 2,697,912 1,019,392
Export development surcharge 2,232,413 1,928,681 1,212,380
Other 207,688 2,854,046 1,393,449
18,310,803 24,819,187 17,929,077
29. Administrative expenses
2016 2015 2014
Note Rupees Rupees Rupees
Directors’ remuneration 33 3,600,000 3,600,000 3,600,000
Salaries and benefits 28,839,663 30,432,761 27,407,163
Electricity and gas 1,048,616 1,409,543 1,928,004
Postage and telecommunication 8,521,241 7,247,594 4,418,970
Vehicles running and maintenance 4,495,832 5,237,151 3,946,702
Traveling and conveyance 6,448,804 9,844,561 8,862,899
Printing and stationery 1,186,649 1,404,031 1,133,404
Entertainment 4,334,302 3,370,687 2,498,852
Fees and subscriptions 1,172,232 450,910 2,067,161
Legal and professional 4,743,466 1,801,630 3,273,036
Auditor’s remuneration 29.1 1,500,000 1,500,000 1,500,000
Repairs and maintenance 444,650 1,377,731 951,919
Advertisement - 215,362 118,275
Amortisation - 1,189,176
Depreciation 15.2 4,473,684 4,863,016 4,581,490
Provision for doubtful debts 19.1 610,514,788 671,354,486 666,871,886
Sales tax written off 20,182,412 - -
Further sales tax 1,800,483 - -
Insurance - - 70,707
Other 3,120,772 3,397,298 1,467,558
706,427,594 747,506,761 735,887,202
2016 2015 2014
Rupees Rupees Rupees
29.1 Auditor’s remuneration
Audit fee 1,000,000 1,000,000 1,000,000
Half yearly review 500,000 500,000 500,000
1,500,000 1,500,000 1,500,000
2016 2015 2014
Rupees Rupees Rupees
30. Finance cost
Interest / mark up on:
Long term financing 105,718,591 129,227,057 134,383,859
Liabilities against assets subject to finance lease - - 1,673,787
Short term borrowings 35,943,120 35,074,658 35,023,454
Bank charges and commission 13,598,666 16,117,183 8,825,537
155,260,377 180,418,898 179,906,637
31. Provision for taxation
Note 2016 2015 2014
Rupees Rupees Rupees
Current
For the year 31.1 11,537,056 11,068,987 7,277,808
Deferred 31.2 - - -
11,537,056 11,068,987 7,277,808
32. Loss per share - Basic and diluted
2016 2015 2014
Note Rupees Rupees Rupees
Net loss for the year (Rupees)
-
1,525,897,597
-
1,602,118,409
-
1,966,633,770
Weighted average number of ordinary
shares 259,430,134 259,430,134 259,430,134
Loss per share - Basic and diluted
(Rupees) -5.88 -6.18 -7.58
Chapter No 6
Conclusion
Conclusions typically relate to the present or past situation of the company financial and
other activities. Based on the findings of the as a internee at Amtex Pvt LTD, we draw the
following conclusions.
1. First of all we saw in this industry, this industry has multiples task like spinning,
weaving, manufacturing and exports.
2. The Main purpose of Amtex is to provide the Product at Retail Person.
3. We find out in this company, its hierarchy system how this company work like one
CEO and Two Directors One is related to Operation and second is related to
marketing.
4. The Main products of the Amtex are three Fabric, home Textile or Garments.
5. Amtex has a Licensed to produce your own electricity.
6. Through Amtex SWOT Analysis we find out that company has a huge amount
of technology capabilities and its weakness is lack of direct Relationship with non
Managerial Employees so therefore company unable to understand the feeling of their
employees or lack of transportation facility to employees so therefore employee
unable to came on time, but he has opportunity to introduced new products and
services in to market or increase income level is at a constant, and increase new
markets access, reduced the cost of product scarification of quality, and for the
purpose of best utilization of work force provides out sourcing Services. Amtex also
has Threats of growing competition and lower profitability government regulations,
rising cost of raw materials financial capacity price changes, technological problems,
increasing rates of interest, increasing costs
7. 3 years Financial Documents of Amtex shows that company run in loss side, but year
by year going to improvement side.
8. Company Ratio Analysis also informed to us about the financial position of the
company in the shape of summary, most of the ratio informed to us about insolvent
condition of the company.
Chapter No 7
Suggestions & Recommendation
Suggestions & Recommendations are oriented to the future: what changes are recommended,
or what actions are recommended for the future? They are specific, action-oriented suggestions
to solve the report problem.
1. There should be a Direct Relationship with Top level Management to non-Managerial
Employees.
2. You should gave the social benefits to the employees like old age benefit, health
facilities, Transportation facility and also solve their problem related to work.
3. There should be flexibility in the labor force; you gave weekly holiday to every
employee, its effect show that your employee would work hard.
4. To improve he financial position of the company there are some points which kept in
mind by the company.
4.1. Company issued sales tax invoiced to every person who purchased the products and
services from company its affects show that company inventory reduced and
automatically sales increased and company loss converted into profit.

Project Report of Amtex Private Limited

  • 1.
    CHAPTER NO 1 INTRODUCTION/BACKGROUND 1.1Company Profile Amtex Private Limited was incorporated in Pakistan in 1991. Amtex Limited is amongst the largest vertically integrated Textile setups in Pakistan having production facilities in all sectors of Textile Industry from Spinning, Weaving, Processing, Printing, Finishing, Cut and Sewn processes and provides employment opportunities to large number of families. After establishing strong foothold in the Textile exports, Amtex successfully switched to Direct to Retail (“DTR”) business model that has enabled it to focus on exporting high value added diversified Products directly to premier Retailers in the EU, USA and across the globe. Amtex holds an iconic textile position in the Global textile industry, being the “One Stop Shop” concept by offering largest variety and combination of products to its diversified customers. With state of the art Textile manufacturing facility, internationally recognized R&D Department, Strong outsourcing capabilities, Professional management, International display centers and warehouses for facilitating procurement of orders and direct dealing with retailing giants, Amtex is marching towards becoming a leader. Amtex has shown huge promise in value added Home Textile sector, where it has become a leader in exporting high end quality Products. Amtex has maintained its focus and commitment in balancing, modernization and value addition activities, as core business philosophy. Amtex aims at developing synergies by keeping abreast with their strong vendor base and as well as to have the flexibility to react to the dynamics of ever demanding growing parameters of market and global business. 1.2Amtex Awards Our slogan "Excellence without Compromise" has been proved by producing quality products over the years. That is only why Amtex has been awarded "Best Export Trophy Award" & Gold Medal for "Businessman of the Year". 1.3 Vision of Amtex Our vision is to provide our customers all their required goods and services from one plat form.
  • 2.
    1.4 Company Information 1.5Mission of Amtex Our mission is to become the buyer’s first choice all around the world and to achieve this target we make sure that we stay true to the highest standards of excellence and customer’s satisfaction Board of Directors Mr. Khurram Iftikhar Chief Executive Officer Mr. Shahzad Iftikhar Mr. Nadeem Iftikhar Mr. Suhail Maqsood Ahmed Mr. Muhammad Ahsan Mr. Gul Muhammad Naz Mr. Usman Ghani Secretary & Chief Financial Officer Mr. Tahir Javed Audit Committee Mr. Suhail Maqsood Ahmed Chairman Mr. Muhammad Ahsan Member Mr. Usman Ghani Member Auditors Zahid Jamil & Co. Chartered Accountants Legal Advisor Mr. Mushtaq Ahmed Khan Advocate High Court Bankers Albarka Bank Limited Askari Bank Limited Bank Alfalah Limited Bankislami Pakistan Limited Faysal Bank Limited Habib Bank Limited NIB Bank Limited National Bank of Pakistan Soneri Bank Limited Summit Bank Limited The Bank of Punjab United Bank Limited Registered Office P-225 Tikka Gali # 2 Montgomery Bazar Faisalabad Share Registrar Office Vision Consulting Limited 3-C, LDA Flats, Lawrance Road, Lahore Projects Locations 30-k.m. Shaiekhupura Road Faisalabad Spinning Unit Sargodha Road Faisalabad Weaving Unit 1-k.m. Khurrianwala Jaranwala Road Faisalabad Processing & Stitching Unit
  • 3.
    Chapter No 2 OrganizationalStructure/Hierarchy 2.1 Mr. Khurram Iftikhar (Chief Executive Officer) On completing his education from Kensington College of Business, London, Mr. Khurram started his career by joining the family business and has played pivotal role in developing and consolidating the export business of the Company. Considering his glorious service to his business, he has been awarded Gold Medal for “Businessman of the Year 2001–02”. Apart from contributing to his family business he has served in several organizations in various capacities. 2.2 Mr. Shahzad Iftikhar – Director Operations After completing his MBA, Mr. Shahzad Iftikhar has played role of an anchor person in strengthening Company’s Operations. Mr. Shahzad is responsible for all the Operations of the Company ranging from Spinning, Weaving, Processing and Value addition activities. Mr. Shahzad is also responsible for ensuring that the Company stays abreast of the latest technology not just by updating existing Plant and Machinery but also introducing latest technology of industrial engineering. 2.3 Mr. Nadeem Iftikhar – Director Marketing Mr. Nadeem Iftikhar spearheads the marketing division of the Company. Over the years, Amtex has made its presence felt in every corner of the Global market courtesy of pro-active Mr. Khurram Iftikhar Chief Executive Officer Mr. Nadeem Iftikhar Directing Marketing Mr. Shahzad Iftikhar Director Operations
  • 4.
    marketing strategies initiatedby the Company under the leadership and the vision of its Senior Management. After completing education, Mr. Nadeem decided to head the marketing team of Amtex and has achieved many milestones in introducing and developing the Product range of Amtex. He has been responsible for exploring new international markets and has played a pivotal role in establishing Amtex name as one of the best garment manufacturing units in the country. Name Designation No. of Meetings Attended Khurram Iftikhar C.E.O 7 Shahzad Iftikhar Director 8 Nadeem Iftikhar Director 8 Suhail Maqsood Ahmed Director 7 Muhammad Ahsan Director 6 Gul Muhammad Naz Director 6 Usman Ghani Director Director 5 Category Names Independent Directors Suhail Maqsood Ahmed Executive Directors Khurram Iftikhar Shahzad Iftikhar Nadeem Iftikhar Non-Executive Directors Usman Ghani Muhammad Ahsan Gul Muhammad Naz
  • 5.
    Chapter No 3 Productsand Services 3.1 Fabrics We can produce fabric from 1016mm to 3200mm width in 100% Cotton, Poly / Cotton, 100% Polyester, Viscose, Acrylic, Acetate rayon, Triacetate, Poly / Viscose, Poly / Acrylic, Poly / Acetate, Polypropylene (all blend ratios) with plain and different weaves like Twills, Drills, Satins, Debbie’s, Jacquards. All these qualities are available in Grey, Bleach, Dyed, Coated &Flocked and Printed Fabric (Pigment & Reactive). Blends Weaves Dyeing Printing Finishing Coating Flockin g Blinds 100% Cotton Cretonne Reactiv e Pigment Special Finishes Single Pass Acrylic Foam Backing Flock Pattern Printing Vertical s Blinds 100% Polyester Rein Force Dispers e Reactive Fashion Trends Velour/ Flocked Fabrics Roman Blinds Poly/Cotton Percale (180-300 Threads) Vat Special Printing Chinte Two/Thre e Pass (ply) Back out Holland Blinds 100% Cotton Satin (150-600 Threads) Dispers e Reactiv e Burn Out Easy Care Water Repellant Roller Blinds 100% Viscose Twill Dispers e Vat Glow I the Dark Bukram Shower CurtainDrill Poly/Viscos BFC Pigmen Metallic Special Table Products Fabrics Home Textile Garments
  • 6.
    e Canvas tEffect Cloth Hi/Low BFC Auto men Direct Puff Emerising (Peach) Out Door Fabrics/ RainwearOxford Resist and Discharg e Raising Fine Twills Herring Bone Panel Print Fabric Protectio n Sports Wear Novelty Weaves Soil & Satin Resistanc e Slub Fabric Naps Fabric Dobby Water and Oil Repellant (Teflon) Panama User Protectio n Half Panama Sanitized Jacquard Down Proof Seersucke r Flame Retardant Voile Normal Finishes
  • 7.
    Soft Heavy Stiff 3.2 Home Textile Amtexis fully equipped to offer customers a variety of textile products, according to the diversified needs of our valued customer by following new trends. We make uniquely styled & designed products as per the aesthetic sense of the customer, keeping in mind the specific requirement of final consumer. At Amtex our customers have the option to select from a rich variety of fabrics, exported in the form of piece goods as well as various confections in made ups. Bed Linen Kitchen Products Upholstery Range Quilted Range Curtains Covers and Pillow Case Runners Cushions and Neck Rolls Bed Spreads Rod Pocket Curtains Flat and Fitted Sheets Place Mate Grand Foulards and throws Comforters and Shams, Mattress Cover Comice/Plain Valances Valances and Bed Shirts Tea Cozy Chair and Sofa Covers Chair Pads and Seats Backs Metal Ring/ Eyelet Curtains Mattress Covers Aprons Futon Covers Sleeping Bags, Bumper pads, Baby Quilts Tab Tops and Loop Curtains Comforter Shells and Shams Kitchen Bags Jabots Sels, Plemets and Scarts Pot Holders and Oven Gloves Tape and (Pinch) Pleated Curtains Table Covers with Napkins Folding Curtains and Roman Blinds Printed Kitchen Tie Backs in
  • 8.
    Tea Towels Various Confections Kitchen Curtains ShowerCurtains 3.3 Garments Our apparel division is producing both light & heavy weight garments. A comprehensive Quality Control & Assurance System is working continuously monitor, control and assure the quality Standards. Various inspections in cutting, stitching, washing, finishing and packing facilitate us to maintain AQL levels as per customer's requirement 3.3.1 Product Line  Light Weight Garments  Lounge Wear  Sleep Wear  Casual Shirts  Hospital Wear  Scrub Sets  Heavy Weight  Bottom Wear (Basic & Fashion)  Work Wear Garment Wet Processing State of the art imported machines are utilized to enhance the fabric handle, feel, wash and natural look of the garment. GWP is fully equipped to produce following types of washes and special effects.  Rinse Wash  Silicon Wash  Stone Wash  Enzyme Wash  Bleach Wash  Distress  Sand Blast
  • 9.
     Spray  Moustache Distress  Tints
  • 10.
    Chapter No 4 SWOTAnalysis 4.1 Amtex Ltd financial SWOT analysis Strengths, Weaknesses, Opportunities, Threats of Amtex Ltd. Find 100,000 more reports and SW This financial SWOT analysis of Amtex Ltd provides a strategic SWOT analysis of the company's businesses and operations. The profile shows a comprehensive view of the company's key strengths and weaknesses and the potential opportunities and threats. 4.1.1 Categories: strategic management, cost analysis, company report, market analysis Tag: company history, key employees, major products and services, business description 4.1.2 Description: We see a growing market and believe that this trend will continue. New products and services can be seen. This SWOT Analysis of Amtex Ltd provides a strategic SWOT analysis of the company's businesses and operations. This free SWOT analysis shows strengths, weaknesses, opportunities and threats. This SWOT analysis of Amtex Ltd can provide a competitive advantage. This SWOT analysis contains 695 data points. 4.1.3 SWOT analysis of Amtex Private Limited. Financial and Strategic SWOT Analysis provides a comprehensive insight into the company’s history, corporate strategy, business and financial structure, management and operations. The report contains a detailed SWOT analysis, information on the company’s products and services, key competitors, as well as detailed financial information. Data on this page may have come in part, or entirely, from one or more data providers. Please contact us for further information. We are not responsible for any errors or omissions on this page. This website is for information purposes only. This is a sample report.
  • 11.
    Strengths -monetary assistance provided -experiencedbusiness units -barriers of market entry -domestic market -One window operations -Providing multiple types of product. Weaknesses -high loan rates are possible -future market size -Lack of direct Relationship with non Managerial Employees -Lack of transportation facility to employees -No proper way for requiting new employees. Opportunities -new products and services -income level is at a constant increase -new markets -Reduced the cost of product, scarification of quality -Provides out sourcing Services Threats -growing competition and lower profitability -government regulations -rising cost of raw materials -financial capacity -price changes -technological problems -increasing rates of interest -increasing costs 4.1.4 Compliance Compliance is necessary to make sure that any business or action conducted by a company is within legal parameters. The compliance unit develops initiates, maintains, and revises policies and procedures for the general operation of the compliance program and its related activities to prevent illegal, unethical, or improper conduct. 4.1.5 Financial and strategic SWOT analysis A financial and strategic SWOT (strengths, weaknesses, opportunities and threats) Analysis provides a comprehensive insight into the company’s history, corporate strategy, financial data, business structure, business divisions and key operations. Each report contains a detailed SWOT analysis with additional information on the key competitors, market
  • 12.
    structure, major products,brands and services, as well as detailed financial data for the last 5 years. 4.1.6 Due Diligence Due diligence is the process of systematically researching and verifying the accuracy of a financial statement, business or investment.
  • 13.
    Chapter no 5Financial Statements Analysis (03 Consecutive Annual Years) Prepare 03 Years Income Statement/Profit and Loss Account Note 2016 2015 2014 Sales 25 2,154,385,182 2,905,180,803 2,812,437,021 Cost of Sales 26 2,777,481,623 3,590,902,113 3,920,739,449 Gross loss (623,096,441) (685,721,310) (1,108,302,428) Other (loss) / income 27 (11,265,326) 47,416,734 82,669,382 (634,361,767) (638,304,576) (1,025,633,046) Selling and distribution expenses 28 18,310,803 24,819,187 17,929,077 Administrative expenses 29 706,427,594 747,506,761 735,887,202 Finance cost 30 155,260,377 180,418,898 179,906,637 879,998,774 952,744,846 933,722,916 Loss before taxation (1,514,360,541) (1,591,049,422) (1,959,355,962) Provision for taxation 31 11,537,056 11,068,987 7,277,808 Net loss for the year (1,525,897,597) (1,602,118,409) (1,966,633,770) Loss per share - Basic and diluted 32 (5.87) (6.16) (7.56) Note 2016 2015 2014 EQUITY AND LIABILITIES PKR (3,000,000,000) PKR (2,000,000,000) PKR (1,000,000,000) PKR - PKR 1,000,000,000 PKR 2,000,000,000 PKR 3,000,000,000 PKR 4,000,000,000 PKR 5,000,000,000 2016 2015 2014
  • 14.
    SHARE CAPITAL ANDRESERVES Authorized capital 260,000,000 (2015: 260,000,000) ordinary shares of Rs.10/- each 2,600,000,000 2,600,000,000 2,600,000,000 Issued, subscribed and paid up capital 3 2,594,301,340 (7,227,441,423) 2,594,301,340 2,594,301,340 Reserves 4 (5,791,753,557) (4,353,370,923) (4,633,140,083) (3,197,452,217) (1,759,069,583) SURPLUS ON REVALUATION OF PROPERTY, PLANT AND EQUIPMENT 5 1,637,742,714 1,730,109,065 1,894,881,582 NON-CURRENT LIABILITIES Redeemable capital 6 - - - Long term financing 7 1,580,939,617 1,558,109,833 1,828,728,822 Liabilities against assets subject to finance lease 8 - - Deferred liabilities 9 780,316,203 622,757,818 575,535,980 2,361,255,820 2,180,867,651 2,404,264,802 CURRENT LIABILITIES Trade and other payables 10 385,792,130 387,238,772 406,955,359 Interest / markup payable 11 2,599,616,255 2,757,538,041 2,709,953,887 Short term borrowings 12 7,371,076,295 6,956,027,934 6,857,129,814 Current portion of noncurrent liabilities 13 739,812,129 1,084,436,842 946,447,477 11,096,296,809 11,185,241,589 10,920,486,537 Contingencies and commitments 14 - - - 10,462,155,260 11,898,766,088 13,460,563,338
  • 15.
    ASSETS Note 20162015 2014 NON-CURRENT ASSETS Property, plant and equipment 15 4,078,928,051 4,334,512,927 4,699,965,450 Long term deposits 16 62,021,425 55,342,868 35,967,868 4,140,949,476 4,389,855,795 4,735,933,318 CURRENT ASSETS Stores, spares and loose tools 17 664,545,130 698,112,426 749,728,790 Stock in trade 18 1,797,415,644 2,204,661,263 2,790,660,569 Trade debts 19 3,357,835,924 4,026,403,565 4,671,392,930 Loans and advances 20 21,333,830 41,387,533 27,819,296 Deposits and prepayments 21 9,998,782 7,592,174 11,132,806 Other receivables 22 94,798,690 101,546,257 110,145,065 Tax refunds due from the Government 23 229,188,251 256,798,777 212,469,281 Cash and bank balances 24 146,089,533 172,408,298 151,281,283 6,321,205,784 7,508,910,293 8,724,630,020 10,462,155,260 11,898,766,088 13,460,563,338 -1E+10 -5E+09 0 5E+09 1E+10 1.5E+10 2016 2015 2014
  • 16.
    5.1 Ratio Analysis 5.1.1Acid test or quick ratio The acid test or quick ratio is used to determine how quickly a company would be able to pay off its current liabilities if it needs to convert its „quick‟ assets into cash. Acid test or quick ratio = (Cash & bank balances + Trade debtors + Short term investments)/ Current Liabilities. The ideal quick ratio is 1:1, which measures the firm’s capacity to payoff claims of current creditors immediately. Equation of Acid Test or Quick Ratio: (Cash & bank balances + Trade debtors + Short term investments * ) Current Liabilities In 2014 = 151,281,283+4,671,392,930+11,132,806 10,920,486,537 = 0.44:1 In 2015 = 172,408,298+4,026,403,565+7,592,174 11,185,241,589 = 0.38:1 In 2016 = 146,089,533+3,357,835,924+9,998,782 11,096,296,809 = 0.32:1 NOTES: * Short term investment = Deposits and prepayments 5.1.2 Financial expenses to sales 0 2E+09 4E+09 6E+09 8E+09 1E+10 1.2E+10 1.4E+10 1.6E+10 2016 2015 2014
  • 17.
    It shows theratio of financial expenses to sales. Lowering the ratio indicates the financial discipline of the company and the increasing ratio indicates that the company is facing financial expenses burden out of its sales revenue Financial expense to sales = Financial expenses/ Sales Equation of Financial expense to sales: Financial expenses Sales In 2014 = 179,906,637 2,812,437,021 = 0.063968 In 2015 = 180,418,898 2,905,180,803 = 0.0621024680507639 In 2016 = 155,260,377 2,154,385,182 = 0.072067139292086 5.1.3 Trade debt to sales It is the ratio of outstanding credit (all sales receivables) to the total sale proceeds of the company. Higher the percentage, the company is increasing its debtors and credit risk and reducing its liquidity position. Trade debt to sales= Trade debt/ Sales Equation of Trade debt to sales: Trade debt Sales In 2014 = 4,671,392,930 2,812,437,021 =1.660976901925087 In 2015 = 4,026,403,565 2,905,180,803 = 1.385939064736413 In 2016 = 3,357,835,924 2,154,385,182 = 1.558605189106801 5.1.4 Assets turnover ratio It is the ratio of total sale proceeds to the total assets of the company. Higher the ratio, the company is sufficiently using its assets in generating revenues and lowers the ratio; the company is insufficient in generating revenues. Assets turnover ratio= Sales/ (Non-Current Assets + Current Assets) Equation of Assets turnover ratio:
  • 18.
    Sales (Non-Current Assets +Current Assets) In 2014 = 2,812,437,021 4,735,933,318+8,724,630,020 = 0.2089390280613529 In 2015 = 2,905,180,803 4,389,855,795+7,508,910,293 = 0.2441581573680903 In 2016 = 2,154,385,182 4,140,949,476+6,321,205,784 = 0.2059217368181171 5.1.5 Current ratio It is the ratio of total current assets to the total current liabilities. Higher current ratio shows that the company is in a well-off situation and lower current ratio shows the worsening situation. Current ratio= Current Assets/ Current Liabilities Equation of Current ratio: Current Assets Current Liabilities In 2014 = 8,724,630,020 10,920,486,537 = 0.7989231972806195 In 2015 = 7,508,910,293 11,185,241,589 = 0.6713230316262953 In 2016 = 6,321,205,784 11,096,296,809 = 0.5696680516758517 5.1.6 Cost of goods sold to sales This ratio is derived by dividing cost of sales of goods to the total amount of sale proceeds. Higher the ratio, lower the gross profit margins and lower the ratio, higher the gross profit margins of the company. Cost of goods sold to sales= Cost of goods sold/ sales Equation of Cost of goods sold to sales: Cost of goods sold sales In 2014 = 3,920,739,449 2,812,437,021 = 1.394071909779487 In 2015 = 3,590,902,113 2,905,180,803 = 1.236033953305728
  • 19.
    In 2016 = 2,777,481,623 2,154,385,182 =1.289222394493799 7. Debt equity ratio This is a measure of company’s financial leverage and calculated by dividing its total liabilities by stockholders' equity. It indicates what proportion of equity and debt the company is using to finance its assets. The higher ratio generally means that a company has been aggressive in financing its growth with debt. This can result in volatile earnings as a result of the additional interest expense. Debt equity ratio = (Current Liabilities + Non-Current Liabilities)/ Shareholder’s equity It provides a margin safety to creditors. The smaller the ratio, the more secured are the creditors. An appropriate debt to equity ratio is 0.33. A higher ratio than this is an indication of financial risk policy. Equation of Debt Equity Ratio: (Current Liabilities + Non-Current Liabilities) Shareholder’s equity* In 2014 = 10,920,486,537+2,404,264,802 135811999 = 98.11173855853488 In 2015 = 11,185,241,589+2,180,867,651 (1467343152) = -9.10905484 In 2016 = 11,096,296,809+2,361,255,820 (2995397369) = -4.49274369 NOTES: * Shareholder’s equity = (Issued, subscribed and paid up capital)+( Reserves)+( SURPLUS ON REVALUATION OF PROPERTY, PLANT AND EQUIPMENT) 5.1.8 Return on assets (ROA) This is an indicator that reflects how profitable a company is relative to its total assets. ROA gives an idea as to how efficient management is at using its assets to generate earnings. This is calculated by dividing a company's annual earnings by its total assets. The higher the ROA, the better, because the company earns more money on less investment. ROA = Net profit before taxes/ Average of (Non-Current Assets + Current Assets) Equation Return on assets: Net profit before taxes Average of (Non-Current Assets + Current Assets) *
  • 20.
    In 2014 = (1,959,355,962) 6,730,281,669 =-0.2911254028230182 In 2015 = (1,591,049,422) 5,949,383,044 = -0.2674309941439366 In 2016 = (1,514,360,541) 5,231,077,630 = -0.2894930353002618 NOTES: * Average of (Non-Current Assets + Current Assets) = (Non-Current Assets + Current Assets)/2 OR Total Assets/2 5.1.9 Return on equity (ROE) It measures a firm's efficiency at generating profits from every unit of shareholders' equity. It shows how well a company uses its resources to generate earnings growth. The ROE is useful for comparing the profitability of a company to that of other firms in the same industry. ROE = Net profit before taxes/ Average of Shareholder’s equity Equation of Return on equity (ROE): Net profit before taxes Average of Shareholder’s equity* In 2014 = (1,959,355,962) 67,906,000 = -28.85394459988808 In 2015 = (1,591,049,422) (733,671,576) = 2.168612597307436 In 2016 = (1,514,360,541) (1,497,698,685) = 1.011124972043359 NOTES: * Average of Shareholder’s equity = Shareholders Equity/2 5.1.10 Return on capital employed (ROCE) ROCE compares earnings with capital invested in the company. ROCE should always be higher than the rate at which the company borrows; otherwise any increase in borrowing will reduce shareholders' earnings. ROCE = Net profit before taxes/ Average of Total capital employed Equation of Return on Capital Employed (ROCE):
  • 21.
    Net profit beforetaxes Average of Total capital employed * In 2014 = (1,959,355,962) 1,270,038,401 = -1.5427533218344 In 2015 = (1,591,049,422) 356,762,250 = -4.459691074377965 In 2016 = (1,514,360,541) (317,070,775) = 4.776096254850356 NOTES: * Average of total capital employed = Shareholders Equity+ Non-Current Liabilities/2 5.1.11 Dividend cover ratio This measures the ability of a company to pay dividends to ordinary shareholders from after tax income and measured as: Dividend cover ratio= (Net profit before taxes - Tax provision)/ Total amount of dividend If a company is operating in a sector that is reasonably unaffected by economic downturns, such as food manufacturing and retailing, the lower dividend cover is more acceptable, because the risk is lower. Equation of Dividend cover ratio: (Net profit before taxes - Tax provision) Total amount of dividend In 2014 = (1,959,355,962)−7,277,808 (1,966,633,770) = 1 In 2015 = (1,591,049,422)−11,068,987 (1,602,118,409) = 1 In 2016 = (1,514,360,541)−11,537,056 (1,525,897,597) = 1 5.1.12 Inventory Turnover Ratio A ratio showing how many times a company's inventory is sold and replaced over a period. The inventory turnover ratio is calculated as Inventory Turnover Ratio = Sales / Inventory This ratio should be compared against industry averages. A low turnover implies poor sales and, therefore, excess inventory. A high ratio on the other hand implies strong sales. High inventory levels are unhealthy because they represent an investment with a rate of return of zero. It also opens the company up to trouble should prices begin to fall.
  • 22.
    Equation of InventoryTurnover Ratio: Sales Inventory In 2014Inventory Turnover Ratio = 2,812,437,021 2,790,660,569 = 1.007803332387286 In 2015Inventory Turnover Ratio = 2,905,180,803 2,204,661,263 = 1.317744749162402 In 2016Inventory Turnover Ratio = 2,154,385,182 1,797,415,644 = 1.198601552841497 5.1.13 Interest cover ratio This ratio measures the efficiency of a company for its ability to pay its interest-payment on its borrowing from operating profit and measured as Interest cover ratio = Net profit before interest and tax payment / Interest expenses = (Net profit before taxes+ Interest expenses) / Interest expenses The higher the figure, the safer is the company. The company with interest cover ratio 2 will suffer a 50% drop in the profit and a company with a ratio less than 1 would have to dip into cash reserve. Equation OF Interest cover ratio: Net profit before taxes + Interest Expenses Interest expenses In 2014 = (1,959,355,962)+179,906,637 179,906,637 In 2015 = (1,591,049,422)+180,418,898 180,418,898 In 2016 = (1,514,360,541)+155,260,377 155,260,377 5.1.14 Net profit margin This ratio is achieved as a ratio of profit earned by a company from its sale proceeds. Net profit margin= Net profit before taxes/ sales Equation of Net profit margin: Net profit before taxes Sales In 2014 Net profit margin = (1,959,355,962) 2,812,437,021 = -0.6966754979293099 In2015 Net profit margin = (1,591,049,422) 2,905,180,803 = -0.5476593471762659
  • 23.
    In 2016 Netprofit margin = (1,514,360,541) 2,154,385,182 = -0.7029200505334705 5.1.15 Operating cash flow to debt ratio This ratio is obtained by dividing the net cash flow balance from operating activities from total liabilities and mathematically it may be derived as: Operating cash flow to debt ratio =Cash flows from operations/ (Current Liabilities+ Non -Current Liabilities) This ratio measures the ability of the company's operating cash flow to meet its obligations. The operating cash flow is simply the amount of cash generated by the company from its main operations, which are used to keep the business funded. The higher the ratio, the safer the company. A minimum value of 0.2 is often used as guided level. Equation of operating cash flow to debt ratio: Cash flows from operations (Current Liabilities+ Non -Current Liabilities) In 2014 = (22,865,954) 11,185,241,589 + 2,180,867,651 = -0.0017107412179133 In 2015 = 96,022,845 11,185,241,589+2,180,867,651 = 0.0071840535847663 In 2016 = 107,788,028 11,096,296,809+2,361,255,820 = 0.008009482182349 5.1.16 Earnings per share after tax (Rs./share) It is arrived at by dividing the net profit (after tax) by the number of ordinary shares. Earnings per share after tax (Rs.) = (Net profit before taxes - Tax provision)/ Number of ordinary shares Equation of earnings per share after tax (Rs.) (Net profit before taxes - Tax provision) Number of ordinary shares In 2014 = (1,959,355,962)−7,277,808 260,000,000 = -7.563976038461538 In 2015 = (1,591,049,422)−11,068,987 260,000,000 = -6.161993880769231 In 2016 = (1,514,360,541)−11,537,056 260,000,000 = -5.868836911538462
  • 24.
    5.1.17 Break- upvalue shares (Rs. /share) It is obtained by dividing the amount of shareholders equity by the number of ordinary shares. Break- up value shares (Rs. /share) = Shareholder’s equity/ Number of ordinary shares Equation of Break- up value shares (Rs. /share) Shareholder’s equity Number of ordinary shares In 2014Break- up value shares = 2,600,000,000 260,000,000 = (Rs.10 /share) In 2015 Break- up value shares = 2,600,000,000 260,000,000 = (Rs.10 /share) In 2016Break- up value shares = 2,600,000,000 260,000,000 = (Rs.10 /share) Vertical Analysis 2016 Rupees 2015 Rupees 2014 Rupees Sales 76.60 103.30 100 Cost of Sales 70.84 91.59 100 Gross loss 56.22 61.87 100 Other (loss) / income -13.63 57.36 100 61.85 62.24 100 Selling and distribution expenses 102.13 138.43 100 Administrative expenses 96.00 101.58 100 Finance cost 86.30 100.28 100 94.25 102.04 100 Loss before taxation 77.29 81.20 100 Provision for taxation 158.52 152.09 100 Net loss for the year 77.59 81.47 100 Loss per share - Basic and diluted 77.59 81.47 100
  • 25.
    Horizontal Analysis 2016 Rupees 2015 Rupees 2014 Rupees Sales 140.86100 100 Cost of Sales 128.92 123.60 139.41 Gross loss -28.92 -23.60 -39.41 Other (loss) / income -0.52 1.63 2.94 -29.45 -21.97 -36.47 Selling and distribution expenses 0.85 0.85 0.64 Administrative expenses 32.79 25.73 26.17 Finance cost 7.21 6.21 6.40 40.85 32.79 33.20 Loss before taxation -70.29 -54.77 -69.67 Provision for taxation 0.54 0.38 0.26 Net loss for the year -70.83 -55.15 -69.93 Loss per share - Basic and diluted -3E-07 -2.1E-07 -2.7E-07 -40.00 -20.00 0.00 20.00 40.00 60.00 80.00 100.00 120.00 140.00 160.00 180.00 2016 2015 2014
  • 26.
    Vertical Analysis 2016 Rupees 2015 Rupees 2014 Rupees EQUITY ANDLIABILITIES SHARE CAPITAL AND RESERVES Authorized capital 260,000,000 (2015: 260,000,000) ordinary shares of Rs.10/- each Issued, subscribed and paid up capital 24.80 21.80 19.27 Reserves -69.08 -48.68 -32.34 -44.28 -26.87 -13.07 SURPLUS ON REVALUATION OF 15.65 14.54 14.08 PROPERTY, PLANT AND EQUIPMENT NON-CURRENT LIABILITIES Redeemable capital Long term financing 15.11 13.09 13.59 Liabilities against assets subject to finance lease Deferred liabilities 7.46 5.23 4.28 22.57 18.33 17.86 -100.00 -50.00 0.00 50.00 100.00 150.00 200.00 2016 2015 2014
  • 27.
    CURRENT LIABILITIES Trade andother payables 3.69 3.25 3.02 Interest / markup payable 24.85 23.17 20.13 Short term borrowings 70.45 58.46 50.94 Current portion of non current liabilities 7.07 9.11 7.03 106.06 94.00 81.13 Contingencies and commitments 100 100 100 -80 -60 -40 -20 0 20 40 60 80 100 120 2016 2015 2014
  • 28.
    ASSETS 2016 20152014 NON-CURRENT ASSETS Rupees Rupees Rupees Property, plant and equipment 38.99 36.43 34.92 Long term deposits 0.59 0.47 0.27 39.58 36.89 35.18 CURRENT ASSETS Stores, spares and loose tools 6.35 5.87 5.57 Stock in trade 17.18 18.53 20.73 Trade debts 32.10 33.84 34.70 Loans and advances 0.20 0.35 0.21 Deposits and prepayments 0.10 0.06 0.08 Other receivables 0.91 0.85 0.82 Tax refunds due from the Government 2.19 2.16 1.58 Cash and bank balances 1.40 1.45 1.12 60.42 63.11 64.82 100 100 100 0 20 40 60 80 100 120 2016 2015 2014
  • 29.
    Horizontal Analysis 2016 Rupees 2015 Rupees 2014 Rupees EQUITY ANDLIABILITIES SHARE CAPITAL AND RESERVES Authorized capital 260,000,000 (2015: 260,000,000) ordinary shares of Rs.10/- each 100.00 100.00 100.00 Issued, subscribed and paid up capital 100.00 100.00 100.00 Reserves 166.02 133.04 100.00 263.39 181.77 100.00 SURPLUS ON REVALUATION OF 86.43 91.30 100.00 PROPERTY, PLANT AND EQUIPMENT NON-CURRENT LIABILITIES Redeemable capital Long term financing 86.45 85.20 100.00 Liabilities against assets subject to finance lease Deferred liabilities 135.58 108.20 100.00 98.21 90.71 100.00 CURRENT LIABILITIES Trade and other payables 94.80 95.16 100.00 Interest / markup payable 95.93 101.76 100.00 Short term borrowings 100.00 Current portion of non current liabilities 78.17 114.58 100.00 101.61 102.42 100.00 Contingencies and commitments 77.72 88.40 100.00
  • 30.
    ASSETS 2016 20152014 NON-CURRENT ASSETS Rupees Rupees Rupees Property, plant and equipment 86.79 92.22 100 Long term deposits 172.44 153.87 100 87.44 92.69 100 CURRENT ASSETS Stores, spares and loose tools 88.64 93.12 100 Stock in trade 64.41 79.00 100 Trade debts 71.88 86.19 100 Loans and advances 76.69 148.77 100 Deposits and prepayments 89.81 68.20 100 Other receivables 86.07 92.19 100 Tax refunds due from the Government 107.87 120.86 100 Cash and bank balances 96.57 113.97 100 72.45 86.07 100 77.72 88.40 100 0 50 100 150 200 250 300 2016 2015 2014
  • 31.
    NOTES OF FINANICALSTATEMENTS 2014 TO 2016 1. STATUS AND ACTIVITIES 1.1. Amtex Limited (the Company) is a public limited company incorporated in Punjab, Pakistan under the Companies Ordinance, 1984 and listed on Pakistan Stock Exchange Limited (formerly Karachi Stock Exchange Limited) in Pakistan. The registered office of the Company is situated at P-225, Tikka Gali No. 2, Montgomery Bazar, Faisalabad. The principal business of the Company is export of all kinds of value added fabrics, textile made-ups, casual and fashion garments duly processed. The Company is also engaged in the business of manufacturing and sale of yarn and fabrics on its own & conversion basis. The cloth processing unit and stitching units are located at 1 KM Jaranwala Road, Khurrianwala, District Faisalabad and spinning unit is located at 30 KM Sheikhupura Road, Khurrianwala, District Faisalabad, in the province of Punjab. 1.2. Pursuant to scheme of arrangement approved by the Honorable Lahore High Court, Lahore, assets, liabilities and reserves of Amtex Spinning Limited were merged with the assets, liabilities and reserves of the Company with effect from April 01, 2003. 1.3. The Company has incurred loss before taxation of Rs. 1,514,360,541/- and its sales have been slightly increased during the year as compared to previous corresponding year. The drop in the production and sale due to under utilization of production capacity because of continuous load management by the utility companies has resulted in higher operating cost. Further overall yarn prices faces significant downfall due to which spinning sector survival becomes very hard day by day. Due to slow turnover of stocks, worst ever textile market conditions, the Company is facing tight cash flow situation and has not been able to comply with the terms of certain loan agreements. The Company is in litigation with sukuk unit holders and 0 20 40 60 80 100 120 140 160 180 200 2016 2015 2014
  • 32.
    certain other banks/ financial institutions has also filed suit against the company for recovery of their outstanding debts. The management is hopeful that with the improvement textile market along with improvement in supply of energy, the production and operating results will improve. The management of the Company has already taken steps for extension and restructuring of loans. The major bankers of the Company have agreed to restructure the facilities (refer note 7.1.2) and negotiations with other banks are in process. There is material uncertainty related to events or conditions which may cast significant doubt about the Company’s ability to continue as a going concern and, therefore, it may be unable to realize its assets and discharge its liabilities in the normal course of business. The management is confident that it will be successful 2 SIGNIFICANT ACCOUNTING POLICIES 2.1. Statement of compliance These financial statements have been prepared in accordance with the requirements of the Companies Ordinance, 1984 (the Ordinance) and directives issued by the Securities and Exchange Commission of Pakistan and approved accounting standards as applicable in Pakistan. Approved accounting standards comprise of such International Financial Reporting Standards (IFRSs) as notified under the provisions of the Ordinance. Wherever, the requirements of the Ordinance or directives issued by the Securities and Exchange Commission of Pakistan differ with the requirements of these standards, the requirements of the Ordinance or the requirements of the said directives take precedence. 2.1.1. Standards, amendments to standards and interpretations becoming effective in current period IFRS 14 Regulatory 1-Jan-16 IAS 1 Presentation of Financial Statements (Amendments) 1-Jan-16 IAS 16 Property, Plant and Equipment (Amendments) 1-Jan-16 IAS 19 Employee Benefits (Amendments) 1-Jan-16 IAS 27 Separate Financial Statements (Amendments) 1-Jan-16 IAS 28 Investment in Associates and Joint Ventures (Amendments) 1-Jan-16 IAS 34 Interim Financial Reporting (Amendments) 1-Jan-16 IAS 38 Intangible Assets (Amendments) 1-Jan-16
  • 33.
    IAS 41 Agriculture(Amendments) 1-Jan-16 2.1.2. Standards, amendments to standards and interpretations becoming effective in current year but not relevant There are certain new standards, amendments and interpretations that are mandatory for accounting periods of the Company beginning on or after July 1, 2015 but are considered not to be relevant to the Company’s operations and are, therefore not disclosed in these financial statements & are not expected to have any material impact on the company’s financial statements. 2.1.3. Standards, amendments to standards and interpretations becoming effective in future periods 3. Issued, subscribed and paid up CAPITAL: 2016 2015 2014 2016 2015 2014 Number of shares Rupees Rupees Rupees 237,444,067 237,444,067 237,444,067 Ordinary shares of Rs. 10/- each fully paid in cash 2,374,440,670 2,374,440,670 2,374,440,670 4,046,067 4,046,067 4,046,067 Ordinary shares of Rs.10/- each issued as fully paid shares as per scheme of arrangement for 40,460,670 40,460,670 40,460,670 IFRS 5 Non-current Assets Held for Sale and Discontinued Operations (Amendments) 1-Jul-16 IFRS 7 Financial Instruments: Disclosures (Amendments) 1-Jul-16 IFRS 11 Joint Arrangements (Amendments) 1-Jan-17 IFRS 15 Revenue from Contracts with Customers 1-Jan-18 IFRS 16 Leases 1-Jan-19 IAS 7 Statement of Cash Flows (Amendments) 1-Jan-17 IAS 12 Income Taxes (Amendments) 1-Jan-17
  • 34.
    Amalgamation sanctioned bythe Court. 17,940,000 17,940,000 17,940,000 Ordinary shares of Rs. 10/- each issued as fully paid bonus shares. 179,400,000 179,400,000 179,400,000 259,430,134 259,430,134 259,430,134 2,594,301,340 2,594,301,340 2,594,301,340 4. Reserves Notes 2016 2015 2014 Rupees Rupees Rupees Reserves Capital Reserves Merger Reserve 98,039,330 98,039,330 98,039,330 Share premium 4.1 183,000,000 183,000,000 183,000,000 281,039,330 281,039,330 281,039,330 Revenue Reserves General reserve 4.2 250,000,000 250,000,000 250,000,000 Accumulated loss -7,758,480,753 -6,322,792,887 -4,884,410,253 -7,508,480,753 -6,072,792,887 -4,634,410,253 -7,227,441,423 -5,791,753,557 -4,353,370,923 4.1. This reserve can be utilized by the Company only for the purposes specified in section 83(2) of the Companies Ordinance, 1984. 4.2. This reserve can be utilized by the Company for various purposes including issue of bonus shares to shareholders, payment of dividend when profits are insufficient and further to meet sudden losses due to natural calamities. 5. SURPLUS ON REVALUATION OF PROPERTY, PLANT AND EQUIPMENT SURPLUS ON REVALUATION OF PROPERTY, PLANT AND EQUIPMENT 2016 2015 2014 Note Rupees Rupees Rupees Opening balance 5.1 1,894,881,582 2,076,922,720 2,076,922,720 Less: Transferred to Comprehensive Income for the year in respect of:
  • 35.
    Incremental depreciation forthe year 102,700,076 114,185,719 114,185,719 Surplus realized on disposal of assets during the year 62,072,441 67,855,419 67,855,419 164,772,517 182,041,138 182,041,138 1,730,109,065 1,894,881,582 1,894,881,582 5.1. This represents surplus on revaluation of freehold land, building on freehold land, plant and machinery, electric installations and factory equipment. Revaluation of freehold land on market value basis and building on freehold land, plant and machinery, electric installations and factory equipment on depreciated replacement values basis was carried out by independent valuers M/S Observers (Private) Limited as at June 03, 2004, by M/S BFA (Private) Limited as at June 30, 2009 and latest revaluation was carried out by independent valuers M/S Empire Enterprises (Pvt) Limited as at December 31, 2012 on depreciated replacement values basis. 6. Redeemable capital Note 2016 2015 2014 Rupees Rupees Rupees Redeemable capital Secured Sukuk certificates 6.1 379,166,665 379,166,665 379,166,665 Less Adjusted during the year - 379,166,665 - 379,166,665 379,166,665 Less : Current portion shown under current liabilities Installments over due - 379,166,665 379,166,665 Payable within one year - - - - 379,166,665 379,166,665 - 0 0 6.1. These represent balance out of 130,000 sukuk certificates of Rs. 5,000/- each privately placed with a banking company. During the musharika, the legal title to the musharika assets will remain with the Company, however, a trustee will hold the beneficial title on behalf of the investors.
  • 36.
    In addition, theseare secured against second charge on all the present and future fixed assets excluding freehold land and building on freehold land of the Company, bank guarantee of Rs. 740 million issued in favor of the trustee and by personal guarantee of two directors of the Company. Bank guarantee of Rs. 740 million is also secured. Securities are disclosed in Note 7.1. Sukuk certificates are redeemable in twelve equal quarterly installments commenced from January 10, 2010 and ending on October 10, 2012. The certificate holders will be entitled to rental payments for use of musharika assets. Rental payments shall be calculated to provide return equal to the base rate plus incremental rental plus service agency charges incurred by the trustee during the previous quarter. Base rate is defined as three months KIBOR and incremental rental is defined as margin of 2% per annum. The effective yield rate of rental ranges from 8.35% to 9.01% per annum (2015: 10% to 12.21% per anum). 6.2. The Company has filed suit under Financial Institutions (Recovery of Finances) Ordinance, 2001 against the sukuk unit holders in the Honorable Lahore High Court, Lahore and prayed for declaration of undertaking to purchase the sukuk units at a pre- agreed price as void, unlawful and satisfaction of obligations against the existing amounts paid. The Company has also sought relief of suspension of operation of the undertaking and the bank guarantee issued there under till the final decision of the suit. As per two different interim orders of The Honorable Lahore High Court, Lahore guarantor has deposited the amount of guarantee against all overdue rentals, as claimed by the sukuk unit holders amounting Rs. 529,734,801, in an escrow account opened by the Deputy Registrar (Judicial) to secure the payments due under sukuk arrangement. The payable sukuk rentals, as claimed by the sukuk holders, have been adjusted in these financial statements against the amounts paid by the guarantor, however, due to pending litigation, sukuk unit holders have not received these payments and sukuk unit holders have not acknowledged the adjustment of sukuk rentals. Further, in its final order The Honorable Lahore High Court, Lahore has dismissed the above referred suit, with no findings on the issue and prayer of the Company, stating that this Court lacks jurisdiction under Financial Institutions (Recovery of Finances) Ordinance, 2001 and the plaint is returned to the plaintiff (Company) to be presented to the court in which the suit should have been instituted. Being aggrieved Company has filed first appeal against this order before Division Bench of Honorable Lahore High Court, Lahore and same is pending for adjudication and in its interim order Division Bench has passed stay order that no amount will be withdrawn, paid by the guarantor, from escrow account opened by the Deputy Registrar (Judicial) up till further orders in this matter.
  • 37.
    7. Long termfinancing Note 2016 2015 2014 Rupees Rupees Rupees Secured From banking companies and financial institutions 7.1 Under mark up arrangements Demand finance 1,759,020,216 1,783,596,216 1,887,778,216 Term finance 150,000,000 150,000,000 155,000,000 Long term finances 19,176,163 19,176,163 19,176,163 Syndicated term finance 7,875,000 10,500,000 11,288,814 Morabaha finance 19,301,582 19,301,582 19,301,582 Morabaha finance II 160,095,500 169,441,764 189,537,904 Not subject to markup Demand finance 134,835,000 33,216,000 33,216,000 2,250,303,461 2,185,231,725 2,315,298,679 Less: Current portion Installments due / overdue 394,928,822 419,842,913 287,103,253 Payable within one year 274,435,022 207,278,979 199,466,604 669,363,844 627,121,892 486,569,857 1,580,939,617 1,558,109,833 1,828,728,822 8. Liabilities against assets subject to finance lease 2016 2015 2014 Rupees Rupees Rupees Opening balance 78,148,285 80,710,955 82,117,164 Paid / adjusted during the year -7,700,000 -2,562,670 -1,406,209 70,448,285 78,148,285 80,710,955 Current portion Installments due / overdue -70,448,285 -67,326,108 -80,710,955 Payable within one year - -10,822,177 - -70,448,285 -78,148,285 -80,710,955 0 0 0 These represent plant and machinery acquired under separate lease agreements.
  • 38.
    The purchase optionis available to the Company on payment of last installment and surrender of deposit at the end of the lease period. The principal plus financial charges are payable over the lease period in 48 monthly and 16, 24 and 16 quarterly installments. The liability represents the total minimum lease payments. Furthermore information / records were not made available by the financial institution to confirm the yearend balance of the outstanding amount due to pending litigation. The company has entered into restructuring agreement with the M/S First Punjab Modaraba in respect of inarch facility No. 199 as on September 04, 2015, as a result of which full and final liability of Rs. 11,260,347 has been decided against outstanding principle and markup, which will be paid in 10 monthly rentals starting from August 31, 2015. The terms of arrangement provide for payment of penalty in case of delayed payments. Reconciliation of minimum lease payment and their present value is given below: 2016 2015 2014 Minimum lease payments Finance cost for future periods Present Value of minimum lease payments Minimum lease payments Finance cost for future periods Present Value of minimum lease payments Minimum lease payments Finance cost for future periods Present Value of minimum lease payments Due within one year 90,067,391 19,619,106 70,448,285 98,494,284 20,345,999 78,148,285 101,470,997 20,760,042 80,710,955 Due after one year but not later than five years - - - - - - - - - 90,067,391 19,619,106 70,448,285 98,494,284 20,345,999 78,148,285 101,470,997 20,760,042 80,710,955 9. Deferred liabilities Note 2016 2015 2014 Rupees Rupees Rupees Deferred markup on: Demand finance I 7.1.1 679,472,369 537,961,054 468,688,756 Demand finance 7.1.6 49,816,216 Morabaha finance 58,820,643 45,539,783 23,538,637 738,293,012 583,500,837 542,043,609 Staff retirement gratuity 9.1 42,023,191 39,256,981 33,492,371 780,316,203 622,757,818 575,535,980
  • 39.
    2016 2015 2014 RupeesRupees Rupees 9.1.4 Expenses recognized in profit and loss account Current service cost 9,078,887 8,914,162 7,966,746 Interest cost 3,663,114 3,108,477 2,725,896 12,742,001 12,022,639 10,692,64 2 2016 2015 2014 Rupees Rupees Rupees 9.1.5 Principal actuarial assumptions Discount factor used 9.5 % Per annum 10% Per annum 13% Per annum Expected rate of increase in salaries 8.5% Per 9% Per 12% Per 2016 2015 2014 Rupees Rupees Rupees 9.1.2 Balance sheet reconciliation as at June 30, Present value of defined benefit obligation 42,023,191 39,256,981 33,492,371 2016 2015 2014 Rupees Rupees Rupees 9.1.3 Movement in net liability recognized Opening balance as at July 01, 39,256,981 33,492,371 32,108,575 Expenses recognized in profit and loss account 9.1.4 12,742,001 12,022,639 10,692,642 Paid during the year -12,132,411 -7,294,771 -4,501,150 Re measurement loss on obligation 2,156,620 1,036,742 -4,807,696 Closing balance as at June 30, 42,023,191 39,256,981 33,492,371
  • 40.
    annum annum annum Expectedaverage remaining working lives of participating employees 5 years 5 years 5 years 2016 2015 2014 Rupees Rupees Rupees 9.1.6 Yearend sensitivity analysis of the defined benefit obligation is as follows: Reworked defined benefit obligation Change in assumptio ns Increase in assumptions Decrease in assumptions Increase in assumptions Discount rate 100 bps 39,596,792 46,833,110 42,571,532 Salary increase rate 100 bps 45,052,697 41,069,759 37,497,475 10. Trade and other payables 2016 2015 2014 Rupees Rupees Rupees Creditors 273,977,617 279,166,242 333,070,943 Accrued liabilities 33,141,648 47,832,109 35,976,660 Advance from customers and others 73,506,715 56,431,072 35,904,415 Withholding tax payable 4,176,062 3,038,450 2,003,341 Sales tax withheld 990,088 770,899 385,792,130 387,238,772 406,955,359 10.1. Prior year figures have been reclassified for better presentation.(Refer note # 39.2) 2016 2015 2014 Rupees Rupees Rupees 11. Interest / markup payable Redeemable capital 88,882,946 100,031,748 100,031,748 Long term financing 104,270,586 246,509,030 197,438,479 Liabilities against assets subject to finance lease 19,619,106 20,345,999 20,760,042 Short term borrowings 2,386,843,617 2,390,651,264 2,391,723,618 2,599,616,255 2,757,538,041 2,709,953,887
  • 41.
    12. Short termborrowings Note 2016 2015 2014 Rupees Rupees Rupees Secured From banking companies and financial institutions Under mark up arrangements 12.2 Export finances 5,379,644,687 5,396,530,208 5,335,620,871 Running finance 215,241,005 215,241,005 215,241,005 Morabaha finances 12.3 457,629,841 416,011,426 401,450,753 Cash finances 217,472,910 217,472,910 192,472,910 Forced demand finance 12.4 529,734,801 139,419,334 139,419,334 Payment against documents 299,948,051 299,948,051 299,948,051 Not subject to markup Demand finance 12.5 271,405,000 271,405,000 271,405,000 Overdraft - - 1,571,890 7,371,076,295 6,956,027,934 6,857,129,814 12.1. The aggregate unveiled short term borrowing facilities available to the Company is Rs. 2.371 (2015: Rs. Nil). 12.2. Short term borrowings, excluding cash finances are secured against lien on export documents, hypothecation of current assets, first charge over current assets ranking pari passu with the charges created in respect of long term financing (Refer Note 7.1), and ranking charge over current assets of the Company. These are further secured against first charge over fixed assets ranking pari passu with the charges created in respect of long term financing (Refer Note 7.1), ranking charge over fixed assets and by personal guarantee of directors of the Company. Cash finances are secured against pledge of stocks and personal guarantee of directors / sponsor directors of the Company. The effective rate of mark up charged during the year ranges from 5.36 % to 23.725% per annum (2015: 7.28 % to 23.725 per annum). 12.3. Morabaha finances include Morabaha finance I and also include morabaha facilities availed. These finances are to be repaid from export proceeds realized or from own source and are for purchase of cotton,PSF, yarn, cloth, chemical, spares and other raw material. Collateral securities are same as detailed in Note 7.1.6. 12.4. It represents rentals of redeemable capital paid by the guarantor ( Refer Note 6.2). Securities are disclosed in Note 7.1. 12.5. Total amount of demand finance was Rs. 367.722 million. The securities are disclosed in Note 7.1. Rs.74.989 million was payable on June 29, 2010 as down payment, Rs. 127.876 million was payable till July 31, 2010 out of proceeds of sales tax refunds and remaining mark up balance of Rs 164.857 million was payable in 10
  • 42.
    equal monthly installmentscommenced from June 30, 2010 and ending on March 31, 2011. 12.6. Information / records were not made available by the banking companies to confirm the year end balances amounting to Rs. 1,397.435 million (2015: 99.969 million) out of total outstanding amount due to pending litigation. Note 2016 2015 2014 Rupees Rupees Rupees 13. Current portion of non current liabilities Redeemable capital 6 - 379,166,665 379,166,665 Long term financing 7 669,363,844 627,121,892 486,569,857 Liabilities against assets subject to finance lease 8 70,448,285 78,148,285 80,710,955 739,812,129 1,084,436,842 946,447,477 14. Contingencies and commitments 14.1. Contingencies a. Amtex Limited has filed suit in the Honorable Civil Court at Faisalabad against M/s S.A Rehmat Private Limited for recovery of Rs.28, 230,026/- and Rendition of account and cancellation of documents. Same is pending adjudication. b. M/S Bank Islami (Formerly KASB Bank Limited and now merged in to Bank Islami) instituted a suit for recovery of Rs.149,802,970/- under Financial institutions (Recovery of Finances) Ordinance, 2001 in the Honorable Lahore High Court, Lahore against the Company. The Bank restructured the outstanding finances as it claimed in referred suit for recovery and also offered to provide fresh export refinance working capital limits vide its offer letter. Based on such offer Letter Company entered in to a compromise agreement with the Bank and Honorable Lahore High Court, Lahore passed the consent decree. Now, the Bank is not fulfilling its contractual obligations and not providing the agreed fresh export refinance working capital limits and has filed Execution Petition for recovery of Rs.192,528,719/-. The company is filing its legal reply to Execution Petition filed by the Bank in the said matter is pending adjudication. c. Amtex Limited filed suit in the court of Honorable Senior Civil Judge Faisalabad against M/S. Pakistan Cargo Services Private Limited for recovery of Rs.12,019,087/-. The case has been dismissed for want of evidence. Being aggrieved, company has filed appeal which is pending for adjudication before Honorable Additional Session Judge, Faisalabad. d. M/S Zephyre Textile Limited has filed a suit for recovery of Rs. 2,916,762/- against the company before the Honorable District Judge Lahore. The company has duly filed its reply in the said matter and the same is pending adjudication. e. M/S. Pak Kuwait Investment Company Private Limited has instituted suit under Financial Institutions (Recovery of Finances) Ordinance, 2001 for
  • 43.
    recovery of Rs.97,903,568/- along with future markup in the Honorable High Court Sindh at Karachi against the company. The company has duly filed its petition for leave to defend in the said matter and the same is pending adjudication. f. Bank islami Pakistan Limited has instituted suit against the company in the Honorable Lahore High Court, Lahore under financial institutions (Recovery of Finance) Ordinance, 2001 for recovery of Rs. 660,473,859/-. The Company has duly filed its petition for leave to defend in the said matter and the same is pending adjudication. g. M/S National Bank of Pakistan (Islamic Banking Division) has instituted a suit for recovery of Rs. 106,924,484/- under Financial Institutions ( Recovery of finances) Ordinance, 2001 in the Honorable Lahore High Court, Lahore against the company. The company has duly filed its petition for leave to defend in the said matter and the same is pending adjudication. h. M/S National Bank of Pakistan has instituted a suit for recovery of Rs. 1,487,663,500/- under Financial Institutions (Recovery of finances) Ordinance, 2001 in the Honorable Lahore High Court, Lahore against the company. The company has duly filed its petition for leave to defend in the said matter and the same is pending adjudication. h. M/S Faysal Bank Ltd has instituted a suit for recovery of Rs. 6,061,867/- under Financial Institutions (Recovery of finances) Ordinance, 2001 in the Honorable Banking Court No. II, Faisalabad against the company. The company has filed its petition for leave to defend in the said matter and same is pending adjudication. i. M/S Saudi Pak Industrial & Agricultural Investment Company Ltd has instituted a suit for recovery of Rs. 19,122,367/- under Financial Institutions (Recovery of finances) Ordinance, 2001 in the Honorable Banking Court No. II, Lahore against the company. Court has passed the decree against the company and the company has filed an appeal against the court order before Honorable Lahore High Court, Lahore and same is pending adjudication. The Honorable Lahore High Court, Lahore has granted stay against the decree and in compliance of court order, the Company has deposited demand draft amounting to Rs. 2,625,000/- as at 12-Feb-2016 in the name of Judge Banking Court Lahore,. j. M/S Habib Bank Ltd has instituted a suit for recovery of Rs. 946,312,769/- under Financial Institutions (Recovery of finances) Ordinance, 2001 in the Honorable High Court Lahore against the company. The company has duly filed its petition for leave to defend in the said matter and the same is pending adjudication. k. The Bank of Punjab has instituted a suit for recovery of Rs. 6,373,121,000/- under Financial Institutions (Recovery of finances) Ordinance, 2001 in the Honorable High Court Lahore against the company. The company has filed its petition for leave to defend the said matter and same is pending adjudication. l. Askari Bank Ltd has instituted a suit for recovery of Rs. 619,486,166/- under Financial Institutions (Recovery of finances) Ordinance, 2001 in the Honorable High Court Lahore against the company. The company has filed its petition for leave to defend the said matter and same is pending adjudication.
  • 44.
    m. The companyhas filed writ petition in the Honorable Lahore High Court, Lahore against Federation of Pakistan and others, in the case of investigation of affairs of the company. The case is pending adjudication. n. Cases are pending before foreign exchange adjudication officer, State Bank of Pakistan, for no repatriation of export proceeds within prescribed times. The default may attract penalties. The financial impact cannot be determined at this stage. o. A recovery demand of Rs. 9.4 million has been raised as a result of an order passed by Additional Commissioner Inland Revenue u/s 122 (5A) of the Income Tax Ordinance 2001 regarding Tax Year 2012. Department has deducted Rs. 9 million from Company’s income tax and sales tax refunds. Said recovery deductions has not yet accounted for due to an appeal filed before Appellate Tribunal Inland Revenue (ATIR), Lahore. p. SNGPL in July 2014 has changed the Sui gas Tariff from Rs. 488.23 per MMBTU to Rs. 573.28 per MMBTU by transferring the category of our unit from General Industrial to Captive Power. Company has filed writ petition before the Honorable Lahore High Court, Lahore against the said illegal / unlawful captive power tariff application by taking plea that we are producing / generating electricity only for own consumption / use, moreover, we do not hold license which is pre-requisite for sale of electricity. Honorable Lahore High Court, Lahore has granted stay in favor of the company restraining the SNGPL from charging captive power tariff instead of general industrial tariff. The company is confident of a favorable outcome of the suit, therefore, provision amounting to Rs. 38,046,528/- has not been made in these financial statements. q. The company has filed suit in Honorable Lahore High Court Lahore challenging the illegal/ unlawful increase / levy of “Gas Infrastructure Development Cess” (GIDC) in Sui gas power bills by SNGPL. Honorable court has granted stay against recovery of enhanced GIDC hence the company has not paid the enhanced amount of GIDC. Further as the company is confident that the case will be decided in its favor, and due to impracticability, no provision in respect of enhanced GIDC is made in these financial statements. r. The Company has filed writ petition in Honorable Lahore High Court, Lahore against Commissioner Inland Revenue Regional Tax Office Faisalabad, Revenue Officer Faisalabad, Faisalabad Electric Supply Company and others regarding illegal and un-lawful levy of General Sales Tax on newly acquired electric connection / bill of spinning division. The court has granted interim relief for the month of January 2016 and further ordered the respondents to decide the issue within a period of one month. s. The Company has filed civil suit, against illegal demand by SNGPL to increase the security deposit / guarantee amount worked out on the basis of higher Captive Power Tariff, before Honorable Civil Judge Faisalabad. Honorable Court of Civil Judge Faisalabad has granted stay order against said impugned revision of security deposit / guarantee demand. t. The Company has filed petition and challenged the imposition of various surcharges on the consumption of electricity and obtained stay order from Honorable Lahore High Court. No any provision is made in these financial statements based on the opinion of the legal council that there is not likelihood of unfavorable outcome or any potential loss.
  • 45.
    u. The Companyis defendant in various legal proceedings initiated by ex- employees in labor / civil courts. The Company expects decisions in its favor based on grounds of case and legal opinion hence no provision has been made. v. The company has not fully recognized mark up on redeemable capital, long and short term financing due to aforementioned litigations and also due to settlements with other banks. Had the mark up been fully charged, net loss for the year would have been increased by Rs. 668.464 million (2015: 848.496 million) and accumulated loss and interest / markup payable would have been increased by Rs. 2,484.632 million (2015: 1,816.145 million). w. Delayed payment of income tax withheld may attract default surcharge and penal action. x. Financial impact, if any, of the above (a to x) has not been acknowledged in these financial statements because of pending litigations. Note 2016 2015 2014 Rupees Rupees Rupees 14.2 Commitments Bank guarantees issued in favour of Sui Northern Gas Pipelines Limited for supply of gas. 39,018,000 39,018,000 64,018,000 Claim of workers’ welfare fund not acknowledged. The Company is claiming exemption from the levy. 3,333,305 3,333,305 Bank guarantees issued in favor of Faisalabad Electric Supply Corporation for new connection. 8,940,000 8,940,000 8,940,000 Collector of Custom (2015 restated) 21,486,791 14,585,666 - 2016 2015 2014 Note Rupees Rupees Rupees 15. Property, plant and equipment Tangible Operating fixed assets 15.1 4,078,928,051 4,299,280,603 4,673,948,551 Capital work in progress 15.5 - 35,232,324 26,016,899 4,078,928,051 4,334,512,927 4,699,965,450
  • 46.
    2016 2015 2014 NoteRupees Rupees Rupees 15.2 Depreciation for the year has been allocated as under: Cost of sales 272,528,451 297,479,889 321,810,952 Administrative expenses 4,473,684 4,863,016 4,581,490 277,002,135 302,342,905 326,392,442 15.3. Had there been no revaluation, the related figures of freehold land, building on freehold land, plant and machinery, electric installations, factory equipment and laboratory equipment as at June 30, 2016, 2015 and 2014 would have been as follows: 2016 Cost Accumulated depreciation Written down value ……………..Rupees……………… Company owned Freehold land 143,605,403 143,605,403 Building on freehold land 1,742,753,222 532,063,285 1,210,689,937 Plant and machinery 3,149,040,481 2,179,251,457 969,789,024 Electric installations 92,087,323 62,297,779 29,789,544 Factory equipment 5,882,262 4,360,461 1,521,801 Laboratory equipment 844,749 369,836 474,913 Leasehold Plant and machinery 173,681,175 112,746,728 60,934,447 5,307,894,615 2,891,089,546 2,416,805,069 2015 Cost Accumulated depreciation Written down value ……………..Rupees……………… Company owned Freehold land 143,605,403 - 143,605,403 Building on freehold land 1,703,002,666 469,477,589 1,233,525,077 Plant and machinery 3,135,724,229 2,071,977,353 1,063,746,876 Electric installations 92,087,323 58,987,830 33,099,493 Factory equipment 5,882,262 4,191,372 1,690,890 Laboratory equipment 844,749 317,068 527,681 Leasehold Plant and machinery 173,681,175 105,976,234 67,704,941 5,254,827,807 2,710,927,446 2,543,900,361
  • 47.
    2014 Cost Accumulated depreciation Written down value ……………..Rupees……………… Company owned Freeholdland 168,093,535 168,093,535 Building on freehold land 1,703,002,666 403,685,256 1,299,317,409 Plant and machinery 3,122,962,932 1,954,424,651 1,168,538,281 Electric installations 92,087,323 55,310,109 36,777,214 Factory equipment 5,882,262 4,003,495 1,878,767 Laboratory equipment 724,749 270,659 454,090 Leasehold Plant and machinery 173,681,175 98,453,463 75,227,712 5,266,434,642 2,516,147,633 2,750,287,008 Note 2016 2015 2014 Rupees Rupees Rupees 16. Long term deposits Against utilities 52,646,928 45,968,371 26,593,371 Against TFC 9,374,497 9,374,497 9,374,497 62,021,425 55,342,868 35,967,868 Note 2016 2015 2014 Rupees Rupees Rupees 17. Stores, spares and loose tools Stores 650,538,521 680,151,461 730,330,711 Spares 12,131,200 15,485,125 17,412,110 Loose tools 1,875,409 2,475,840 1,985,969 664,545,130 698,112,426 749,728,790 17.1. Stores include items that may result in fixed capital expenditure but are not distinguishable. 17.2. Stores’ amounting to Rs. 193.453 million is at net realizable value as per valuation report given by an independent value.
  • 48.
    2016 2015 2014 NoteRupees Rupees Rupees 18. Stock in trade Raw material 747,365,908 867,057,440 1,061,226,051 Work in process 135,529,150 178,881,358 204,979,803 Finished goods 913,024,168 1,155,804,265 1,518,749,713 Waste 1,496,418 2,918,200 5,705,002 1,797,415,644 2,204,661,263 2,790,660,569 18.1. Stock in trade amounting to Rs. 184.375 million (2015 restated: Rs. 184.375 million) was pledged as security with the banks. Due to pending litigation with NBP & BOP latest pledged stocks sheets are not provided/ made available by the Banks. 18.2. Stock in trade amounting to Rs. 665.077 million (2015: Rs. 235.707 million) is at net realizable value as per valuation report given by an independent valuer. 19. Trade debts Note 2016 2015 2014 Rupees Rupees Rupees Considered good Unsecured Foreign 3,175,878,516 3,821,556,302 4,462,911,850 Local 181,957,408 204,847,263 208,481,080 3,357,835,924 4,026,403,565 4,671,392,930 Considered doubtful Unsecured Foreign 3,933,360,396 3,322,845,608 2,651,491,122 Less: Provision for doubtful debts 19.1 - 3,933,360,396 - 3,322,845,608 - 2,651,491,122 0 0 0 3,357,835,924 4,026,403,565 4,671,392,930 19.1 Provision for doubtful debts Note 2016 2015 2014 Rupees Rupees Rupees Opening balance 3,322,845,608 2,651,491,122 1,984,619,236 Created during the year 610,514,788 671,354,486 666,871,886 Closing balance 3,933,360,396 3,322,845,608 2,651,491,122
  • 49.
    19.2 The agingof trade debts as at balance sheet date is as under: Notes 2016 2015 2014 Rupees Rupees Rupees Not past due 213,859,849 262,186,968 220,116,249 Past due within one year 7,722,964 5,862,152 21,567,750 Past due more than one year 7,069,613,507 7,081,200,053 7,081,200,053 7,077,336,471 7,087,062,205 7,102,767,803 7,291,196,320 7,349,249,173 7,322,884,052 19.3. Past due balances which are considered good are not restated as at balance sheet date. Had this restatement been made, the loss for the year would have been decreased by Rs.117.417 million. 2016 2015 2014 Rupees Rupees Rupees 20. Loans and advances Considered good Advances Suppliers and others 21,333,830 41,387,533 27,819,296 2016 2015 2014 Notes Rupees Rupees Rupees 21 Deposits and prepayments Considered good Deposits Export margin 2,173,969 - 3,510,822 Lease deposits 7,251,662 7,251,662 7,251,662 Prepayments 573,151 340,512 370,322 9,998,782 7,592,174 11,132,806 22 Other receivables 2016 2015 2014 Note Rupees Rupees Rupees Considered good Export rebate / duty drawback 85,121,390 84,503,600 93,102,408 Federal excise duty 6,677,360 14,042,717 14,042,717
  • 50.
    Others 2,999,940 2,999,9402,999,940 94,798,690 101,546,257 110,145,065 2016 2015 2014 Note Rupees Rupees Rupees 23 Tax refunds due from Government Income tax 73,466,668 54,288,053 32,103,302 Sales tax 155,721,583 202,510,724 180,365,979 229,188,251 256,798,777 212,469,281 Note 2016 2015 2014 Rupees Rupees Rupees 24. Cash and bank balances Cash in hand 116,979,893 138,155,858 127,849,543 Cash at banks In current accounts 29,087,042 34,240,875 23,420,357 In PLS accounts 22,598 11,565 11,383 146,089,533 172,408,298 151,281,283 Note 2016 2015 2014 Rupees Rupees Rupees 25. Sales Export Fabrics / made ups / garments 25.1 853,325,060 787,752,047 506,413,207 Indirect export Yarn 25.2 57,532,100 101,977,800 79,758,900 Cloth 25.2 77,143,201 25,027,800 3,659,800 Processing and conversion 25.2 122,537,062 208,421,000 294,292,666 1,110,537,423 1,123,178,647 884,124,573 Local Yarn / cloth 25.2 707,193,943 1,508,719,748 1,703,792,269 Processing and conversion 25.2 164,880,703 110,315,361 88,220,766 Waste and left over 25.2 & 25.3 46,165,737 40,734,083 46,399,103 Printing screens 25.2 138,538,439 130,004,055 90,702,508 2,167,316,245 2,912,951,894 2,813,239,219 Add: Export rebate / duty drawback 6,856,214 6,499,912 3,997,902 2,174,172,459 2,919,451,806 2,817,237,121 Less: Commission 19,787,277 14,271,003 4,800,100 2,154,385,182 2,905,180,803 2,812,437,021
  • 51.
    25.2 Gross sales Note2016 2015 2014 Rupees Rupees Rupees Indirect export Yarn 59,258,063 104,017,356 81,354,078 Cloth 79,457,497 25,778,634 3,769,594 Processing and conversion 126,213,174 212,589,420 300,178,519 Local Yarn / cloth 728,409,761 1,544,244,342 1,742,748,741 Processing and conversion 169,827,124 112,521,668 89,985,181 Waste and left over 48,144,067 42,272,096 47,430,112 Printing screens 161,048,083 152,104,744 106,121,934 1,372,357,769 2,193,528,260 2,371,588,159 Less: Sales tax -58,366,585 -68,328,413 -64,762,147 1,313,991,184 2,125,199,847 2,306,826,012 25.3. It represents sale of left over / waste material out of goods manufactured. 26. Cost of sales 2016 2015 2014 Note Rupees Rupees Rupees Cost of goods manufactured 26.1 2,533,279,744 3,225,169,863 3,599,882,229 Finished goods Opening stock 1,158,722,465 1,524,454,715 1,845,311,935 Closing stock 26.2 -914,520,586 - 1,158,722,465 - 1,524,454,715 244,201,879 365,732,250 320,857,220 2,777,481,623 3,590,902,113 3,920,739,449 26.1 Cost of goods manufactured 2016 2015 2014 Note Rupees Rupees Rupees Raw material consumed 26.1.1 1,018,034,198 1,688,808,538 1,987,022,603 Salaries, wages and benefits 323,681,166 352,487,998 341,034,509 Staff retirement benefits 12,742,001 12,022,639 10,692,642 Stores and spares 69,647,728 98,975,504 103,815,446 Dyes and chemicals 282,425,392 222,766,261 228,710,063 Packing material 74,513,653 70,218,998 57,564,258 Conversion and processing charges 7,929,689 4,262,744 8,219,914 Engraving and wadding 14,052,919 18,404,030 16,939,584 Repairs and maintenance 9,752,879 19,649,941 17,039,381
  • 52.
    Fuel and power396,534,999 402,361,995 435,976,007 Insurance 1,066,134 618,891 1,496,767 Depreciation 15.2 272,528,451 297,479,889 321,810,952 Other 26.3 7,018,327 11,013,990 20,532,120 2,489,927,536 3,199,071,418 3,550,854,246 Work in process Opening stock 178,881,358 204,979,803 254,007,786 Closing stock -135,529,150 -178,881,358 -204,979,803 43,352,208 26,098,445 49,027,983 2,533,279,744 3,225,169,863 3,599,882,229 26.1.1 Raw material consumed 2016 2015 2014 Note Rupees Rupees Rupees Opening stock 867,057,440 1,061,226,051 1,628,065,176 Purchases including purchase expenses 898,342,666 1,494,639,927 1,420,183,478 1,765,400,106 2,555,865,978 3,048,248,654 Closing stock -747,365,908 -867,057,440 - 1,061,226,051 1,018,034,198 1,688,808,538 1,987,022,603 27. Other income Note 2016 2015 2014 Rupees Rupees Rupees Income from financial assets: Profit on deposit 23,447 209,653 - Income from assets other than financial assets: Markup waived off by banks 726,893 43,183,287 - Gain on disposal of property, plant and equipment 1,246,768 3,843,794 81,974,381 Rental income 180,000 180,000 695,001 Trading loss 27.1 -13,442,434 -11,265,326 47,416,734 82,669,382 27.1 Trading loss 2016 2015 2014 Rupees Rupees Rupees
  • 53.
    Sale 27.1.1 60,684,871- - Cost of sales - 74,127,305 - - - 13,442,434 - - 27.1.1 2016 2015 2014 Rupees Rupees Rupees Gross sales 62,505,417 - - Less: sales tax -1,820,546 - - 60,684,871 - - 28. Selling and distribution expenses 2016 2015 2014 Note Rupees Rupees Rupees Steamer freight 9,459,032 13,827,276 12,147,217 Freight and octroi 3,944,720 3,511,272 2,156,639 Clearing and forwarding 2,466,950 2,697,912 1,019,392 Export development surcharge 2,232,413 1,928,681 1,212,380 Other 207,688 2,854,046 1,393,449 18,310,803 24,819,187 17,929,077 29. Administrative expenses 2016 2015 2014 Note Rupees Rupees Rupees Directors’ remuneration 33 3,600,000 3,600,000 3,600,000 Salaries and benefits 28,839,663 30,432,761 27,407,163 Electricity and gas 1,048,616 1,409,543 1,928,004 Postage and telecommunication 8,521,241 7,247,594 4,418,970 Vehicles running and maintenance 4,495,832 5,237,151 3,946,702 Traveling and conveyance 6,448,804 9,844,561 8,862,899 Printing and stationery 1,186,649 1,404,031 1,133,404 Entertainment 4,334,302 3,370,687 2,498,852 Fees and subscriptions 1,172,232 450,910 2,067,161
  • 54.
    Legal and professional4,743,466 1,801,630 3,273,036 Auditor’s remuneration 29.1 1,500,000 1,500,000 1,500,000 Repairs and maintenance 444,650 1,377,731 951,919 Advertisement - 215,362 118,275 Amortisation - 1,189,176 Depreciation 15.2 4,473,684 4,863,016 4,581,490 Provision for doubtful debts 19.1 610,514,788 671,354,486 666,871,886 Sales tax written off 20,182,412 - - Further sales tax 1,800,483 - - Insurance - - 70,707 Other 3,120,772 3,397,298 1,467,558 706,427,594 747,506,761 735,887,202 2016 2015 2014 Rupees Rupees Rupees 29.1 Auditor’s remuneration Audit fee 1,000,000 1,000,000 1,000,000 Half yearly review 500,000 500,000 500,000 1,500,000 1,500,000 1,500,000 2016 2015 2014 Rupees Rupees Rupees 30. Finance cost Interest / mark up on: Long term financing 105,718,591 129,227,057 134,383,859 Liabilities against assets subject to finance lease - - 1,673,787 Short term borrowings 35,943,120 35,074,658 35,023,454 Bank charges and commission 13,598,666 16,117,183 8,825,537 155,260,377 180,418,898 179,906,637 31. Provision for taxation Note 2016 2015 2014 Rupees Rupees Rupees Current For the year 31.1 11,537,056 11,068,987 7,277,808 Deferred 31.2 - - - 11,537,056 11,068,987 7,277,808 32. Loss per share - Basic and diluted 2016 2015 2014 Note Rupees Rupees Rupees Net loss for the year (Rupees) - 1,525,897,597 - 1,602,118,409 - 1,966,633,770
  • 55.
    Weighted average numberof ordinary shares 259,430,134 259,430,134 259,430,134 Loss per share - Basic and diluted (Rupees) -5.88 -6.18 -7.58
  • 56.
    Chapter No 6 Conclusion Conclusionstypically relate to the present or past situation of the company financial and other activities. Based on the findings of the as a internee at Amtex Pvt LTD, we draw the following conclusions. 1. First of all we saw in this industry, this industry has multiples task like spinning, weaving, manufacturing and exports. 2. The Main purpose of Amtex is to provide the Product at Retail Person. 3. We find out in this company, its hierarchy system how this company work like one CEO and Two Directors One is related to Operation and second is related to marketing. 4. The Main products of the Amtex are three Fabric, home Textile or Garments. 5. Amtex has a Licensed to produce your own electricity. 6. Through Amtex SWOT Analysis we find out that company has a huge amount of technology capabilities and its weakness is lack of direct Relationship with non Managerial Employees so therefore company unable to understand the feeling of their employees or lack of transportation facility to employees so therefore employee unable to came on time, but he has opportunity to introduced new products and services in to market or increase income level is at a constant, and increase new markets access, reduced the cost of product scarification of quality, and for the purpose of best utilization of work force provides out sourcing Services. Amtex also has Threats of growing competition and lower profitability government regulations, rising cost of raw materials financial capacity price changes, technological problems, increasing rates of interest, increasing costs 7. 3 years Financial Documents of Amtex shows that company run in loss side, but year by year going to improvement side. 8. Company Ratio Analysis also informed to us about the financial position of the company in the shape of summary, most of the ratio informed to us about insolvent condition of the company.
  • 57.
    Chapter No 7 Suggestions& Recommendation Suggestions & Recommendations are oriented to the future: what changes are recommended, or what actions are recommended for the future? They are specific, action-oriented suggestions to solve the report problem. 1. There should be a Direct Relationship with Top level Management to non-Managerial Employees. 2. You should gave the social benefits to the employees like old age benefit, health facilities, Transportation facility and also solve their problem related to work. 3. There should be flexibility in the labor force; you gave weekly holiday to every employee, its effect show that your employee would work hard. 4. To improve he financial position of the company there are some points which kept in mind by the company. 4.1. Company issued sales tax invoiced to every person who purchased the products and services from company its affects show that company inventory reduced and automatically sales increased and company loss converted into profit.