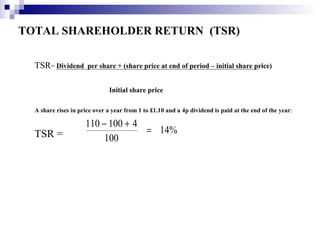
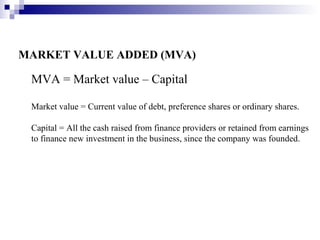
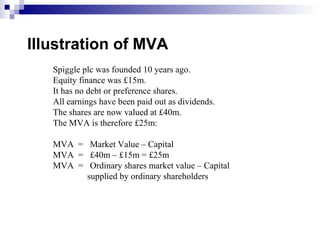
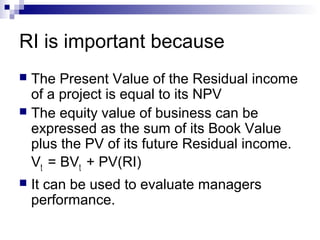
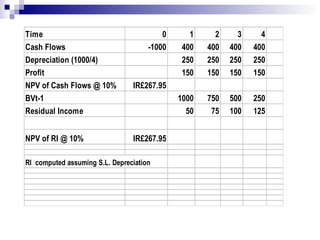
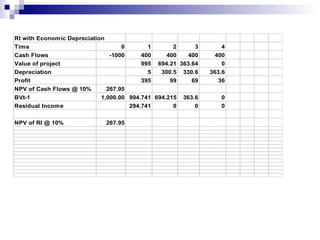
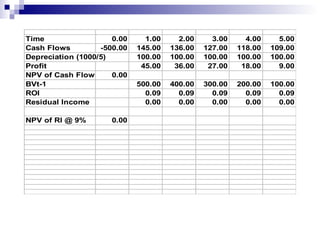
Residual Income
and NPV
The ex-post evaluation of
project selection
Two important questions
 How do we motivate managers to create
  shareholder value?
 How do we evaluate their performance in
  terms of value creation.
TOTAL SHAREHOLDER RETURN (TSR)

  TSR= Dividend per share + (share price at end of period – initial share price)

                              Initial share price

  A share rises in price over a year from 1 to £1.10 and a 4p dividend is paid at the end of the year:

                     110 − 100 + 4
  TSR =                            = 14%
                          100
Issues to be borne in mind when making use of
TSR:

1 Relate return to risk class
2 It measures in percentage not absolute terms
3 TSR is dependant on the time period chosen
Illustration of TSR
 Year             TSR       Value of €1m investment at t0
 1                +6%       1.06m

 2                -40%      0.636m
 3                +50%      0.954m
 4                +4.822%   1.0m
 Sum of Annual    20.8%
 Returns
 Holding Period   0%
 Return                     1.06 x 0.6 x 1.5 x 1.04822 = 1.0
MARKET VALUE ADDED (MVA)

 MVA = Market value – Capital

 Market value = Current value of debt, preference shares or ordinary shares.

 Capital = All the cash raised from finance providers or retained from earnings
 to finance new investment in the business, since the company was founded.
Illustration of MVA
   Spiggle plc was founded 10 years ago.
   Equity finance was £15m.
   It has no debt or preference shares.
   All earnings have been paid out as dividends.
   The shares are now valued at £40m.
   The MVA is therefore £25m:

   MVA = Market Value – Capital
   MVA = £40m – £15m = £25m
   MVA = Ordinary shares market value – Capital
         supplied by ordinary shareholders
Creating Shareholder Wealth -
Performance Evaluation
   Stock Market Returns
     Affected  by more than manager’s
      performance
     Not useful at divisional level or when a
      company’s stock is not publicly traded
     Cannot be used for the performance of a
      division in the company
Call in the Accountant
   Earnings Per Share
     Rob  the future to pay the present
     The cost of funds is ignored
     The level of investment ignored
   Accounting Rate of Return
     Same  problems as above
     Scale difference can cause problems
The Solution ?

   Economic Profit
The Terms

• Economic Profit
• Residual Income
• Abnormal Earnings
• EVA®

are more or less synonymous
Residual Income is:

RIt = Xt - rBVt-1

RIt = Residual   Income

Xt = Equity Profit

r   = Cost of Equity Capital
Alternative Formula

              Xt       
       RI t =
              BV    −r BVt −
                             1
                t−1    

       =( ROE −r )BVt −1
RI is important because
 The Present Value of the Residual income
  of a project is equal to its NPV
 The equity value of business can be
  expressed as the sum of its Book Value
  plus the PV of its future Residual income.
  Vt = BVt + PV(RI)
   It can be used to evaluate managers
    performance.
Time                                     0      1     2     3     4
Cash Flows                           -1000    400   400   400   400
Depreciation (1000/4)                         250   250   250   250
Profit                                        150   150   150   150
NPV of Cash Flows @ 10%         IR£267.95
BVt-1                                        1000   750   500   250
Residual Income                                50    75   100   125


NPV of RI @ 10%                 IR£267.95

RI computed assuming S.L. Depreciation
RI with Economic Depreciation
Time                               0       1       2     3       4
Cash Flows                     -1000     400     400   400     400
Value of project                         995 694.21 363.64       0
Depreciation                               5   300.5 330.6   363.6
Profit                                   395      99    69      36
NPV of Cash Flows @ 10%       267.95
BVt-1                       1,000.00 994.741 694.215 363.6      0
Residual Income                      294.741       0     0      0

NPV of RI @ 10%             267.95
Illustration of why Profitable
Projects don’t always create value
   Let us assume that a company needs to
    invest €500M in a project that lasts 5
    years. The table below shows the
    project to be profitable. However, the
    ROR is just equal to the cost of capital and
    RI is therefore zero. This means that the
    project just earns a fair rate of return and
    its NPV is zero.
Time                  0.00     1.00     2.00     3.00     4.00     5.00
Cash Flows         -500.00   145.00   136.00   127.00   118.00   109.00
Depreciation (1000/5)        100.00   100.00   100.00   100.00   100.00
Profit                        45.00    36.00    27.00    18.00     9.00
NPV of Cash Flows @ 9%0.00
BVt-1                        500.00   400.00   300.00   200.00   100.00
ROI                            0.09     0.09     0.09     0.09     0.09
Residual Income                0.00     0.00     0.00     0.00     0.00

NPV of RI @ 9%        0.00
A profitable profit that destroys
value!
 The next slide shows how a profitable
  project may destroy value.
 If the profits are not sufficient to cover the
  cost of capital NPV will be <0.
 Take the previous example and reduce
  profits – note no losses are made. ROE is
  sometimes < cost of capital
Time                    0.00   1.00   2.00   3.00   4.00   5.00
Cash Flows           -500.00 140.00 130.00 120.00 110.00 101.00
Depreciation (1000/5)        100.00 100.00 100.00 100.00 100.00
Profit                        40.00 30.00 20.00 10.00      1.00
NPV of Cash Flows @-25.91
                       9%
BVt-1                        500.00 400.00 300.00 200.00 100.00
ROI                            0.08   0.08   0.07   0.05   0.01
Residual Income               -5.00  -6.00 -7.00 -8.00 -8.00

NPV of RI @ 9%      -25.91
Advantages of RI
 It is clearly linked to value creation (NPV)
 It makes managers aware that capital is
  not free
Limitations of RI
   Book values are not equal to market values so the
    anticipated RI will be greater than zero. Thus if a
    positive RI is achieved it could mean that book value
    understates true value or that wealth is created. Put
    another way RI suffers from the same allocation
    problems as Accounting. How do you accurately
    measure value created over a short period of when value
    depends on what is going to happen over a much longer
    time frame.
Limitations Continued
   Thus, while the PV of all the RI s over a
    period is the measure of wealth created.

    RI s for any individual period can be
    seriously biased.

Profitability&npv

  • 1.
    Residual Income and NPV Theex-post evaluation of project selection
  • 2.
    Two important questions How do we motivate managers to create shareholder value?  How do we evaluate their performance in terms of value creation.
  • 3.
    TOTAL SHAREHOLDER RETURN(TSR) TSR= Dividend per share + (share price at end of period – initial share price) Initial share price A share rises in price over a year from 1 to £1.10 and a 4p dividend is paid at the end of the year: 110 − 100 + 4 TSR = = 14% 100
  • 4.
    Issues to beborne in mind when making use of TSR: 1 Relate return to risk class 2 It measures in percentage not absolute terms 3 TSR is dependant on the time period chosen
  • 5.
    Illustration of TSR Year TSR Value of €1m investment at t0 1 +6% 1.06m 2 -40% 0.636m 3 +50% 0.954m 4 +4.822% 1.0m Sum of Annual 20.8% Returns Holding Period 0% Return 1.06 x 0.6 x 1.5 x 1.04822 = 1.0
  • 6.
    MARKET VALUE ADDED(MVA) MVA = Market value – Capital Market value = Current value of debt, preference shares or ordinary shares. Capital = All the cash raised from finance providers or retained from earnings to finance new investment in the business, since the company was founded.
  • 7.
    Illustration of MVA Spiggle plc was founded 10 years ago. Equity finance was £15m. It has no debt or preference shares. All earnings have been paid out as dividends. The shares are now valued at £40m. The MVA is therefore £25m: MVA = Market Value – Capital MVA = £40m – £15m = £25m MVA = Ordinary shares market value – Capital supplied by ordinary shareholders
  • 8.
    Creating Shareholder Wealth- Performance Evaluation  Stock Market Returns  Affected by more than manager’s performance  Not useful at divisional level or when a company’s stock is not publicly traded  Cannot be used for the performance of a division in the company
  • 9.
    Call in theAccountant  Earnings Per Share  Rob the future to pay the present  The cost of funds is ignored  The level of investment ignored  Accounting Rate of Return  Same problems as above  Scale difference can cause problems
  • 10.
    The Solution ? Economic Profit
  • 11.
    The Terms • EconomicProfit • Residual Income • Abnormal Earnings • EVA® are more or less synonymous
  • 12.
    Residual Income is: RIt= Xt - rBVt-1 RIt = Residual Income Xt = Equity Profit r = Cost of Equity Capital
  • 13.
    Alternative Formula  Xt  RI t =  BV −r BVt −  1  t−1  =( ROE −r )BVt −1
  • 14.
    RI is importantbecause  The Present Value of the Residual income of a project is equal to its NPV  The equity value of business can be expressed as the sum of its Book Value plus the PV of its future Residual income. Vt = BVt + PV(RI)  It can be used to evaluate managers performance.
  • 15.
    Time 0 1 2 3 4 Cash Flows -1000 400 400 400 400 Depreciation (1000/4) 250 250 250 250 Profit 150 150 150 150 NPV of Cash Flows @ 10% IR£267.95 BVt-1 1000 750 500 250 Residual Income 50 75 100 125 NPV of RI @ 10% IR£267.95 RI computed assuming S.L. Depreciation
  • 16.
    RI with EconomicDepreciation Time 0 1 2 3 4 Cash Flows -1000 400 400 400 400 Value of project 995 694.21 363.64 0 Depreciation 5 300.5 330.6 363.6 Profit 395 99 69 36 NPV of Cash Flows @ 10% 267.95 BVt-1 1,000.00 994.741 694.215 363.6 0 Residual Income 294.741 0 0 0 NPV of RI @ 10% 267.95
  • 17.
    Illustration of whyProfitable Projects don’t always create value  Let us assume that a company needs to invest €500M in a project that lasts 5 years. The table below shows the project to be profitable. However, the ROR is just equal to the cost of capital and RI is therefore zero. This means that the project just earns a fair rate of return and its NPV is zero.
  • 18.
    Time 0.00 1.00 2.00 3.00 4.00 5.00 Cash Flows -500.00 145.00 136.00 127.00 118.00 109.00 Depreciation (1000/5) 100.00 100.00 100.00 100.00 100.00 Profit 45.00 36.00 27.00 18.00 9.00 NPV of Cash Flows @ 9%0.00 BVt-1 500.00 400.00 300.00 200.00 100.00 ROI 0.09 0.09 0.09 0.09 0.09 Residual Income 0.00 0.00 0.00 0.00 0.00 NPV of RI @ 9% 0.00
  • 19.
    A profitable profitthat destroys value!  The next slide shows how a profitable project may destroy value.  If the profits are not sufficient to cover the cost of capital NPV will be <0.  Take the previous example and reduce profits – note no losses are made. ROE is sometimes < cost of capital
  • 20.
    Time 0.00 1.00 2.00 3.00 4.00 5.00 Cash Flows -500.00 140.00 130.00 120.00 110.00 101.00 Depreciation (1000/5) 100.00 100.00 100.00 100.00 100.00 Profit 40.00 30.00 20.00 10.00 1.00 NPV of Cash Flows @-25.91 9% BVt-1 500.00 400.00 300.00 200.00 100.00 ROI 0.08 0.08 0.07 0.05 0.01 Residual Income -5.00 -6.00 -7.00 -8.00 -8.00 NPV of RI @ 9% -25.91
  • 21.
    Advantages of RI It is clearly linked to value creation (NPV)  It makes managers aware that capital is not free
  • 22.
    Limitations of RI  Book values are not equal to market values so the anticipated RI will be greater than zero. Thus if a positive RI is achieved it could mean that book value understates true value or that wealth is created. Put another way RI suffers from the same allocation problems as Accounting. How do you accurately measure value created over a short period of when value depends on what is going to happen over a much longer time frame.
  • 23.
    Limitations Continued  Thus, while the PV of all the RI s over a period is the measure of wealth created. RI s for any individual period can be seriously biased.