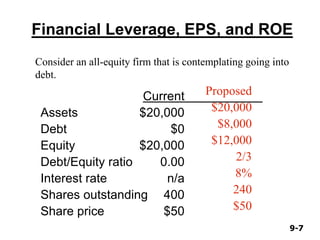
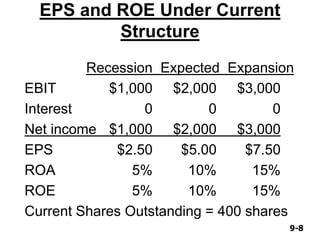
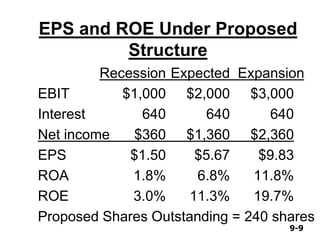
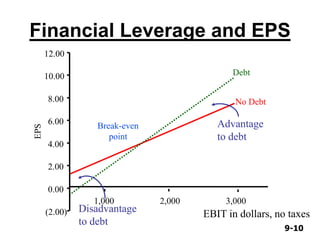
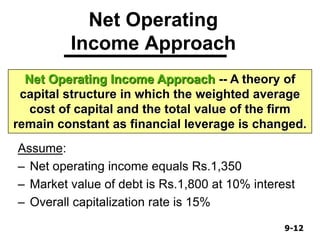
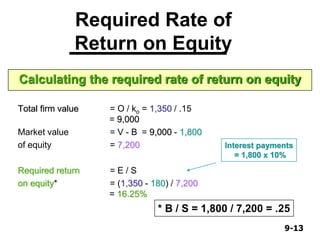
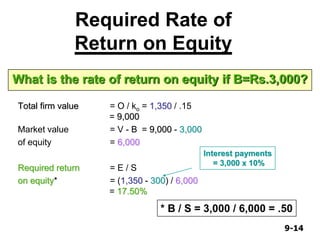
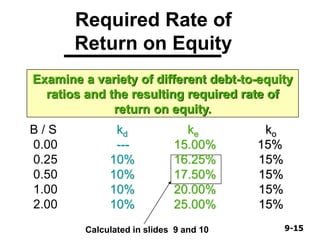
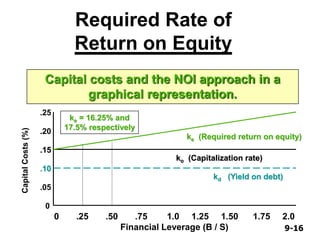
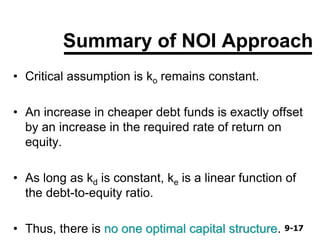
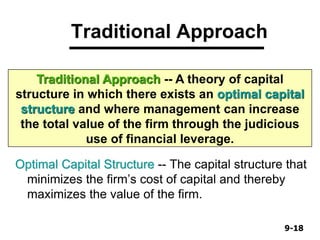
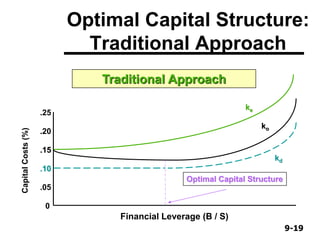
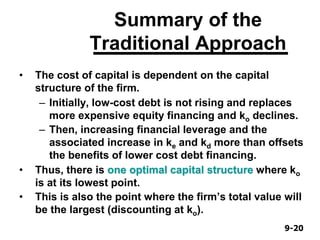
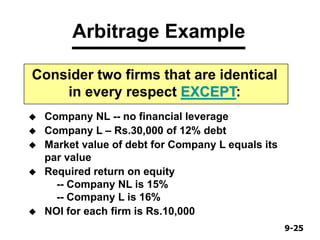
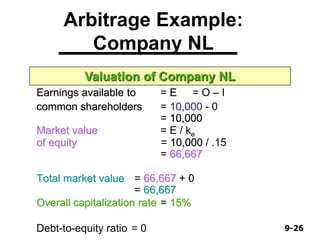
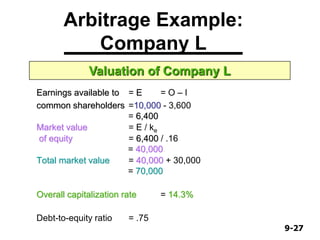
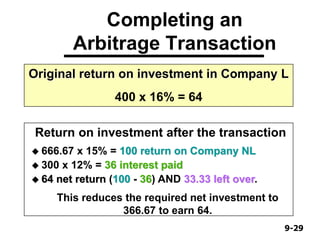
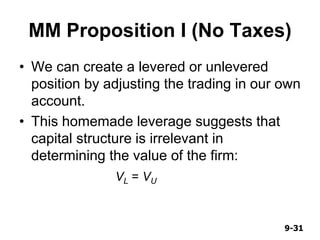
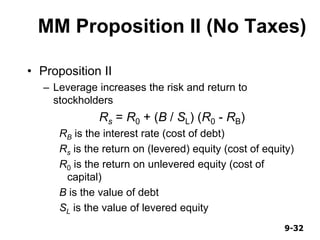
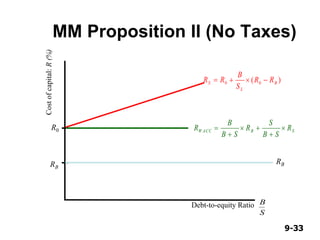
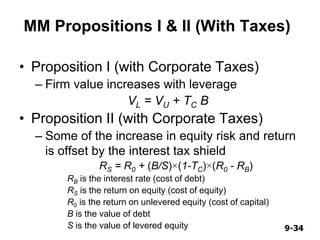
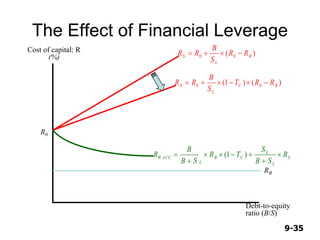
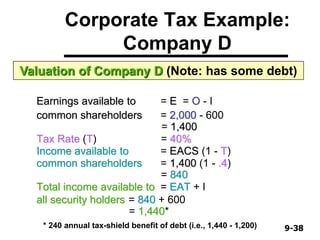
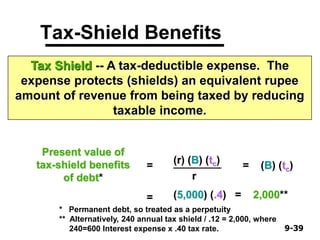
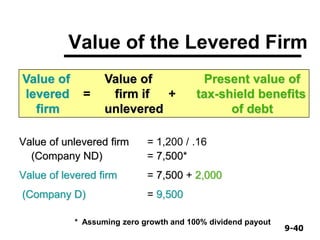
The document provides information on capital structure and the Modigliani-Miller (M&M) theories. It discusses the Net Operating Income (NOI) approach, Traditional approach, and M&M propositions. The NOI approach assumes the weighted average cost of capital and total firm value remain constant as leverage changes. The Traditional approach suggests an optimal capital structure that minimizes the cost of capital. M&M proposition I states that the total market value of a firm is unaffected by its capital structure if markets are perfect. Proposition II shows how leverage impacts the risk and return of equity holders. The document also provides an example of how corporate taxes can increase firm value through the use of debt.
Watch out full video on youtube-
https://youtu.be/Suf9NAMW6Jg
Net Operating Income Approach
It proposes that -
Capital structure does not matter in determining the value of firm
It suggests that the value of firm remains same and is not affected by the change in debt composition of financing
Increase in debt composition results in increased risk perception by investors
Thus, firm appears to be more risky with more debt as capital which results in higher required rate of return by investors
The weighted average cost of capital and market value of firm remains same with increased cost of equity
Assumptions -
There are only two sources of financing – Debt & Equity
Value of equity is calculated by deducting the value of debt from total value of firm
Value of firm is EBIT / Overall cost of capital
WACC remains constant and with an increase in debt, the cost of equity increases
Dividend payout ratio is 1
No taxes & No retained earning
Thank you for Watching
Subscribe to DevTech Finance
The ppt speaks about the term 'Capital Structure', its factors influencing, the theories and its basic assumptions which make the topic easy to decode and understand.
Watch out full video on Youtube -
https://youtu.be/VP2ZqqWmUvM
It suggests that the firm value is maximum with right proportion of debt and equity mix
As per this approach, debt funding should exist in the capital structure only up to a certain level, after which, any increase in debt funding would result in the reduction in value of the firm by increasing cost of equity
It advocates that there exists an optimum level of debt and equity at which the WACC is the lowest and the market value of the firm is the highest
Assumptions
There are only two sources of financing – Debt and Equity
The interest rate on debt remains constant to a certain level after which it increases with an increase in debt financing
The expected rate of return on equity increases gradually to a certain level after which it increases speedily with increase in debt because of the financial risk involved
WACC first decreases and then starts increasing with increased interest rate on debt and increased required rate of return on equity
No taxes & transaction cost
Thank you for Watching
Subscribe to DevTech Finance
This presentation is an overview of Capital Structure Theories.
Dr. Soheli Ghose ( Ph.D (University of Calcutta), M.Phil, M.Com, M.B.A., NET (JRF), B. Ed).
Assistant Professor, Department of Commerce,St. Xavier's College, Kolkata.
Guest Faculty, M.B.A. Finance, University of Calcutta, Kolkata
Read| The latest issue of The Challenger is here! We are thrilled to announce that our school paper has qualified for the NATIONAL SCHOOLS PRESS CONFERENCE (NSPC) 2024. Thank you for your unwavering support and trust. Dive into the stories that made us stand out!
This is a presentation by Dada Robert in a Your Skill Boost masterclass organised by the Excellence Foundation for South Sudan (EFSS) on Saturday, the 25th and Sunday, the 26th of May 2024.
He discussed the concept of quality improvement, emphasizing its applicability to various aspects of life, including personal, project, and program improvements. He defined quality as doing the right thing at the right time in the right way to achieve the best possible results and discussed the concept of the "gap" between what we know and what we do, and how this gap represents the areas we need to improve. He explained the scientific approach to quality improvement, which involves systematic performance analysis, testing and learning, and implementing change ideas. He also highlighted the importance of client focus and a team approach to quality improvement.
2024.06.01 Introducing a competency framework for languag learning materials ...Sandy Millin
http://sandymillin.wordpress.com/iateflwebinar2024
Published classroom materials form the basis of syllabuses, drive teacher professional development, and have a potentially huge influence on learners, teachers and education systems. All teachers also create their own materials, whether a few sentences on a blackboard, a highly-structured fully-realised online course, or anything in between. Despite this, the knowledge and skills needed to create effective language learning materials are rarely part of teacher training, and are mostly learnt by trial and error.
Knowledge and skills frameworks, generally called competency frameworks, for ELT teachers, trainers and managers have existed for a few years now. However, until I created one for my MA dissertation, there wasn’t one drawing together what we need to know and do to be able to effectively produce language learning materials.
This webinar will introduce you to my framework, highlighting the key competencies I identified from my research. It will also show how anybody involved in language teaching (any language, not just English!), teacher training, managing schools or developing language learning materials can benefit from using the framework.
The Art Pastor's Guide to Sabbath | Steve ThomasonSteve Thomason
What is the purpose of the Sabbath Law in the Torah. It is interesting to compare how the context of the law shifts from Exodus to Deuteronomy. Who gets to rest, and why?
The Indian economy is classified into different sectors to simplify the analysis and understanding of economic activities. For Class 10, it's essential to grasp the sectors of the Indian economy, understand their characteristics, and recognize their importance. This guide will provide detailed notes on the Sectors of the Indian Economy Class 10, using specific long-tail keywords to enhance comprehension.
For more information, visit-www.vavaclasses.com
The French Revolution, which began in 1789, was a period of radical social and political upheaval in France. It marked the decline of absolute monarchies, the rise of secular and democratic republics, and the eventual rise of Napoleon Bonaparte. This revolutionary period is crucial in understanding the transition from feudalism to modernity in Europe.
For more information, visit-www.vavaclasses.com
How to Split Bills in the Odoo 17 POS ModuleCeline George
Bills have a main role in point of sale procedure. It will help to track sales, handling payments and giving receipts to customers. Bill splitting also has an important role in POS. For example, If some friends come together for dinner and if they want to divide the bill then it is possible by POS bill splitting. This slide will show how to split bills in odoo 17 POS.
How to Make a Field invisible in Odoo 17Celine George
It is possible to hide or invisible some fields in odoo. Commonly using “invisible” attribute in the field definition to invisible the fields. This slide will show how to make a field invisible in odoo 17.
Students, digital devices and success - Andreas Schleicher - 27 May 2024..pptxEduSkills OECD
Andreas Schleicher presents at the OECD webinar ‘Digital devices in schools: detrimental distraction or secret to success?’ on 27 May 2024. The presentation was based on findings from PISA 2022 results and the webinar helped launch the PISA in Focus ‘Managing screen time: How to protect and equip students against distraction’ https://www.oecd-ilibrary.org/education/managing-screen-time_7c225af4-en and the OECD Education Policy Perspective ‘Students, digital devices and success’ can be found here - https://oe.cd/il/5yV
Synthetic Fiber Construction in lab .pptxPavel ( NSTU)
Synthetic fiber production is a fascinating and complex field that blends chemistry, engineering, and environmental science. By understanding these aspects, students can gain a comprehensive view of synthetic fiber production, its impact on society and the environment, and the potential for future innovations. Synthetic fibers play a crucial role in modern society, impacting various aspects of daily life, industry, and the environment. ynthetic fibers are integral to modern life, offering a range of benefits from cost-effectiveness and versatility to innovative applications and performance characteristics. While they pose environmental challenges, ongoing research and development aim to create more sustainable and eco-friendly alternatives. Understanding the importance of synthetic fibers helps in appreciating their role in the economy, industry, and daily life, while also emphasizing the need for sustainable practices and innovation.
1. 9-19-1
Institute of Human Resource Advancement
University of Colombo
• Lecturer: Dr. A. A. Azeez
• Program: MBM
• Subject : MBM 14-Financial Management
• Topic : Capital Structure Policy
• Date : 02. 05.2015
2. 9-29-2
Capital Structure
Capital Structure -- The mix (or proportion) of a
firm’s permanent long-term financing represented
by debt, preferred stock, and common stock
equity.
3. 9-39-3
Capital Structure and the Pie
• The value of a firm is defined to be the sum of
the value of the firm’s debt and the firm’s equity.
V = B + S
• If the goal of the firm’s
management is to make the
firm as valuable as possible,
then the firm should pick the
debt-equity ratio that makes
the pie as big as possible.
Value of the Firm
S BS BS BS B
4. 9-49-4
Capital Restructuring
• We are going to look at how changes in capital
structure affect the value of the firm, all else equal
• Capital restructuring involves changing the amount of
leverage a firm has without changing the firm’s assets
• The firm can increase leverage by issuing debt and
repurchasing outstanding shares
• The firm can decrease leverage by issuing new shares
and retiring outstanding debt
16-4
5. 9-59-5
Choosing a Capital Structure
• What is the primary goal of financial managers?
– Maximize stockholder wealth
• We want to choose the capital structure that will
maximize stockholder wealth
• We can maximize stockholder wealth by
maximizing the value of the firm or minimizing
the WACC
16-5
6. 9-69-6
The Effect of Leverage
• How does leverage affect the EPS and ROE of a firm?
• When we increase the amount of debt financing, we
increase the fixed interest expense
• If we have a really good year, then we pay our fixed cost
and we have more left over for our stockholders
• If we have a really bad year, we still have to pay our fixed
costs and we have less left over for our stockholders
• Leverage amplifies the variation in both EPS and ROE
16-6
7. 9-79-7
Financial Leverage, EPS, and ROE
Current
Assets $20,000
Debt $0
Equity $20,000
Debt/Equity ratio 0.00
Interest rate n/a
Shares outstanding 400
Share price $50
Proposed
$20,000
$8,000
$12,000
2/3
8%
240
$50
Consider an all-equity firm that is contemplating going into
debt.
8. 9-89-8
EPS and ROE Under Current
Structure
Recession Expected Expansion
EBIT $1,000 $2,000 $3,000
Interest 0 0 0
Net income $1,000 $2,000 $3,000
EPS $2.50 $5.00 $7.50
ROA 5% 10% 15%
ROE 5% 10% 15%
Current Shares Outstanding = 400 shares
10. 9-109-10
Financial Leverage and EPS
(2.00)
0.00
2.00
4.00
6.00
8.00
10.00
12.00
1,000 2,000 3,000
EPS
Debt
No Debt
Break-even
point
EBIT in dollars, no taxes
Advantage
to debt
Disadvantage
to debt
11. 9-119-11
Debt-equity Mix and the Value
of the Firm
Capital structure theories:
• Net operating income (NOI) approach.
• Traditional approach.
• MM hypothesis with and without corporate
tax.
• Trade-off theory: costs and benefits of
leverage.
• Pecking-order theory
12. 9-129-12
Net Operating
Income Approach
Assume:
– Net operating income equals Rs.1,350
– Market value of debt is Rs.1,800 at 10% interest
– Overall capitalization rate is 15%
Net Operating Income Approach -- A theory of
capital structure in which the weighted average
cost of capital and the total value of the firm
remain constant as financial leverage is changed.
13. 9-139-13
Required Rate of
Return on Equity
Total firm value = O / ko = 1,350 / .15
= 9,000
Market value = V - B = 9,000 - 1,800
of equity = 7,200
Required return = E / S
on equity* = (1,350 - 180) / 7,200
= 16.25%
Calculating the required rate of return on equity
* B / S = 1,800 / 7,200 = .25
Interest payments
= 1,800 x 10%
14. 9-149-14
Total firm value = O / ko = 1,350 / .15
= 9,000
Market value = V - B = 9,000 - 3,000
of equity = 6,000
Required return = E / S
on equity* = (1,350 - 300) / 6,000
= 17.50%
Required Rate of
Return on Equity
What is the rate of return on equity if B=Rs.3,000?
* B / S = 3,000 / 6,000 = .50
Interest payments
= 3,000 x 10%
15. 9-159-15
B / S kd ke ko
0.00 --- 15.00% 15%
0.25 10% 16.25% 15%
0.50 10% 17.50% 15%
1.00 10% 20.00% 15%
2.00 10% 25.00% 15%
Required Rate of
Return on Equity
Examine a variety of different debt-to-equity
ratios and the resulting required rate of
return on equity.
Calculated in slides 9 and 10
16. 9-169-16
Required Rate of
Return on Equity
Capital costs and the NOI approach in a
graphical representation.
0 .25 .50 .75 1.0 1.25 1.50 1.75 2.0
Financial Leverage (B / S)
.25
.20
.15
.10
.05
0
CapitalCosts(%)
ke = 16.25% and
17.5% respectively
kd (Yield on debt)
ko (Capitalization rate)
ke (Required return on equity)
17. 9-179-17
Summary of NOI Approach
• Critical assumption is ko remains constant.
• An increase in cheaper debt funds is exactly offset
by an increase in the required rate of return on
equity.
• As long as kd is constant, ke is a linear function of
the debt-to-equity ratio.
• Thus, there is no one optimal capital structure.
18. 9-189-18
Traditional Approach
Optimal Capital Structure -- The capital structure that
minimizes the firm’s cost of capital and thereby
maximizes the value of the firm.
Traditional Approach -- A theory of capital
structure in which there exists an optimal capital
structure and where management can increase
the total value of the firm through the judicious
use of financial leverage.
20. 9-209-20
Summary of the
Traditional Approach
• The cost of capital is dependent on the capital
structure of the firm.
– Initially, low-cost debt is not rising and replaces
more expensive equity financing and ko declines.
– Then, increasing financial leverage and the
associated increase in ke and kd more than offsets
the benefits of lower cost debt financing.
• Thus, there is one optimal capital structure where ko
is at its lowest point.
• This is also the point where the firm’s total value will
be the largest (discounting at ko).
21. 9-219-21
Total Value Principle:
Modigliani and Miller (M&M)
• Advocate that the relationship between financial
leverage and the cost of capital is explained by
the NOI approach.
• Provide behavioral justification for a constant ko
over the entire range of financial leverage
possibilities.
• Total risk for all security holders of the firm is not
altered by the capital structure.
• Therefore, the total value of the firm is not altered
by the firm’s financing mix.
22. 9-229-22
Market value
of debt (65M)
Market value
of equity (35M)
Total firm market
value (100M)
Total Value Principle:
Modigliani and Miller
• M&M assume an absence of taxes and market
imperfections.
• Investors can substitute personal for corporate
financial leverage.
Market value
of debt (35M)
Market value
of equity (65M)
Total firm market
value (100M)
Total market value is not altered by the capital
structure (the total size of the pies are the same).
23. 9-239-23
Assumptions of the M&M
Model
• Homogeneous Expectations
• Homogeneous Business Risk Classes
• Perpetual Cash Flows
• Perfect Capital Markets:
– Perfect competition
– Firms and investors can borrow/lend at the same rate
– Equal access to all relevant information
– No transaction costs
– No taxes
24. 9-249-24
Arbitrage and Total
Market Value of the Firm
Arbitrage -- Finding two assets that are
essentially the same and buying the cheaper and
selling the more expensive.
Two firms that are alike in every respect
EXCEPT capital structure MUST have
the same market value.
Otherwise, arbitrage is possible.
25. 9-259-25
Arbitrage Example
Consider two firms that are identical
in every respect EXCEPT:
Company NL -- no financial leverage
Company L – Rs.30,000 of 12% debt
Market value of debt for Company L equals its
par value
Required return on equity
-- Company NL is 15%
-- Company L is 16%
NOI for each firm is Rs.10,000
26. 9-269-26
Earnings available to = E = O – I
common shareholders = 10,000 - 0
= 10,000
Market value = E / ke
of equity = 10,000 / .15
= 66,667
Total market value = 66,667 + 0
= 66,667
Overall capitalization rate = 15%
Debt-to-equity ratio = 0
Arbitrage Example:
Company NL
Valuation of Company NL
27. 9-279-27
Arbitrage Example:
Company L
Earnings available to = E = O – I
common shareholders =10,000 - 3,600
= 6,400
Market value = E / ke
of equity = 6,400 / .16
= 40,000
Total market value = 40,000 + 30,000
= 70,000
Overall capitalization rate = 14.3%
Debt-to-equity ratio = .75
Valuation of Company L
28. 9-289-28
Completing an
Arbitrage Transaction
Assume you own 1% of the stock of
Company L (equity value = Rs.400).
You should:
1. Sell the stock in Company L for 400.
2. Borrow 300 at 12% interest (equals 1% of debt
for Company L).
3. Buy 1% of the stock in Company NL for 666.67.
This leaves you with 33.33 for other
investments (400 + 300 - 666.67).
29. 9-299-29
Completing an
Arbitrage Transaction
Original return on investment in Company L
400 x 16% = 64
Return on investment after the transaction
666.67 x 15% = 100 return on Company NL
300 x 12% = 36 interest paid
64 net return (100 - 36) AND 33.33 left over.
This reduces the required net investment to
366.67 to earn 64.
30. 9-309-30
Summary of the
Arbitrage Transaction
• The equity share price in Company NL rises
based on increased share demand.
• The equity share price in Company L falls
based on selling pressures.
• Arbitrage continues until total firm values are
identical for companies NL and L.
• Therefore, all capital structures are equally as
acceptable.
The investor uses “personal” rather than
corporate financial leverage.
31. 9-319-31
MM Proposition I (No Taxes)
• We can create a levered or unlevered
position by adjusting the trading in our own
account.
• This homemade leverage suggests that
capital structure is irrelevant in
determining the value of the firm:
VL = VU
32. 9-329-32
MM Proposition II (No Taxes)
• Proposition II
– Leverage increases the risk and return to
stockholders
Rs = R0 + (B / SL) (R0 - RB)
RB is the interest rate (cost of debt)
Rs is the return on (levered) equity (cost of equity)
R0 is the return on unlevered equity (cost of
capital)
B is the value of debt
SL is the value of levered equity
33. 9-339-33
MM Proposition II (No Taxes)
Debt-to-equity Ratio
Costofcapital:R(%)
R0
RB
SBW ACC R
SB
S
R
SB
B
R
)( 00 B
L
S RR
S
B
RR
RB
S
B
34. 9-349-34
MM Propositions I & II (With Taxes)
• Proposition I (with Corporate Taxes)
– Firm value increases with leverage
VL = VU + TC B
• Proposition II (with Corporate Taxes)
– Some of the increase in equity risk and return
is offset by the interest tax shield
RS = R0 + (B/S)×(1-TC)×(R0 - RB)
RB is the interest rate (cost of debt)
RS is the return on equity (cost of equity)
R0 is the return on unlevered equity (cost of capital)
B is the value of debt
S is the value of levered equity
35. 9-359-35
The Effect of Financial Leverage
Debt-to-equity
ratio (B/S)
Cost of capital: R
(%)
R0
RB
)()1( 00 BC
L
S RRT
S
B
RR
S
L
L
CB
L
W ACC R
SB
S
TR
SB
B
R
)1(
)( 00 B
L
S RR
S
B
RR
36. 9-369-36
Example of the Effects
of Corporate Taxes
Consider two identical firms EXCEPT:
– Company ND -- no debt, 16% required return
– Company D -- 5,000 of 12% debt
– Corporate tax rate is 40% for each company
– NOI for each firm is 2,000
The judicious use of financial leverage
(i.e., debt) provides a favorable impact
on a company’s total valuation.
37. 9-379-37
Earnings available to = E = O - I
common shareholders = 2,000 - 0
= 2,000
Tax Rate (T) = 40%
Income available to = EACS (1 - T)
common shareholders = 2,000 (1 - .4)
= 1,200
Total income available to = EAT + I
all security holders = 1,200 + 0
= 1,200
Corporate Tax Example:
Company ND
Valuation of Company ND (Note: has no debt)
38. 9-389-38
Earnings available to = E = O - I
common shareholders = 2,000 - 600
= 1,400
Tax Rate (T) = 40%
Income available to = EACS (1 - T)
common shareholders = 1,400 (1 - .4)
= 840
Total income available to = EAT + I
all security holders = 840 + 600
= 1,440*
Corporate Tax Example:
Company D
Valuation of Company D (Note: has some debt)
* 240 annual tax-shield benefit of debt (i.e., 1,440 - 1,200)
39. 9-399-39
Tax-Shield Benefits
Tax Shield -- A tax-deductible expense. The
expense protects (shields) an equivalent rupee
amount of revenue from being taxed by reducing
taxable income.
Present value of
tax-shield benefits
of debt*
=
(r) (B) (tc)
r
= (B) (tc)
* Permanent debt, so treated as a perpetuity
** Alternatively, 240 annual tax shield / .12 = 2,000, where
240=600 Interest expense x .40 tax rate.
= (5,000) (.4) = 2,000**
40. 9-409-40
Value of the Levered Firm
Value of unlevered firm = 1,200 / .16
(Company ND) = 7,500*
Value of levered firm = 7,500 + 2,000
(Company D) = 9,500
Value of Value of Present value of
levered = firm if + tax-shield benefits
firm unlevered of debt
* Assuming zero growth and 100% dividend payout
41. 9-419-41
Summary of
Corporate Tax Effects
• The greater the financial leverage, the lower
the cost of capital of the firm.
• The adjusted M&M proposition suggests an
optimal strategy is to take on the maximum
amount of financial leverage.
The greater the amount of debt, the greater the
tax-shield benefits and the greater the value of
the firm.
42. 9-429-42
Financial Distress
• Financial distress arises when a firm is not able to
meet its obligations to debt-holders.
• For a given level of debt, financial distress occurs
because of the business (operating) risk . with higher
business risk, the probability of financial distress
becomes greater. Determinants of business risk are:
– Operating leverage (fixed and variable
costs)
– Cyclical variations
– Intensity of competition
– Price fluctuations
– Firm size and diversification
43. 9-439-43
Consequences of Financial Distress
– Bankruptcy costs
Specific bankruptcy costs include legal and
administrative costs along with the sale of assets at
“distress” prices to meet creditor claims. Lenders
build into their required interest rate the expected
costs of bankruptcy which reduces the market value
of equity by a corresponding amount.
– Indirect costs
• Investing in risky projects.
• Reluctance to undertake profitable projects.
• Premature liquidation.
• Short-term orientation.
44. 9-449-44
Agency Costs
• Monitoring includes bonding of agents, auditing
financial statements, and explicitly restricting
management decisions or actions.
• Monitoring costs, like bankruptcy costs, tend to rise
at an increasing rate with financial leverage.
Agency Costs -- Costs associated with monitoring
management to ensure that it behaves in ways
consistent with the firm’s contractual agreements with
creditors and shareholders.
45. 9-459-45
Bankruptcy Costs,
Agency Costs, and Taxes
As financial leverage increases, tax-shield
benefits increase as do bankruptcy and
agency costs.
Value of levered firm
= Value of firm if unlevered
+ Present value of tax-shield benefits
of debt
- Present value of bankruptcy and
agency costs
46. 9-469-46
Tax Effects and Financial Distress
Debt (B)
Value of firm (V)
0
Present value of tax
shield on debt
Present value of
financial distress costs
Value of firm under
MM with corporate
taxes and debt
VL = VU + TCB
V = Actual value of firm
VU = Value of firm with no debt
B*
Maximum
firm value
Optimal amount of debt
47. 9-479-47
Optimum Capital Structure:
Trade-off Theory
• The optimum capital structure is a
function of:
– Agency costs associated with debt
– The costs of financial distress
– Interest tax shield
• The value of a levered firm is:
Value of unlevered firm
+ PV of tax shield
– PV of financial distress (bankruptcy and
agency costs)
48. 9-489-48
The Pecking-Order Theory
• Theory stating that firms prefer to issue
debt rather than equity if internal financing
is insufficient.
– Rule 1
• Use internal financing first
– Rule 2
• Issue debt next, new equity last
• The pecking-order theory is at odds with
the tradeoff theory:
– There is no target D/E ratio
– Profitable firms use less debt
– Companies like financial slack 16-48