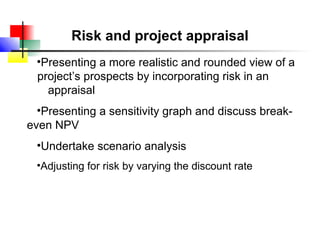
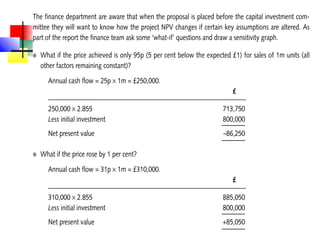
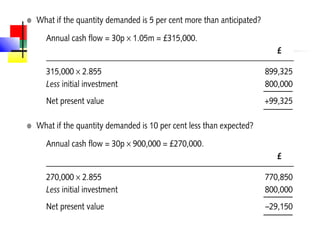
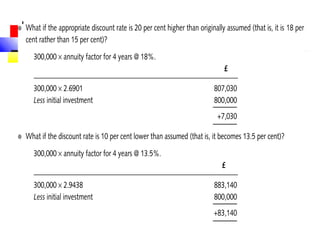
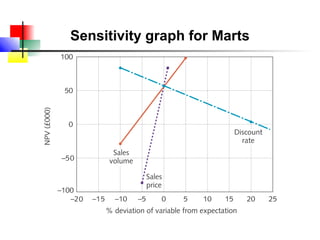
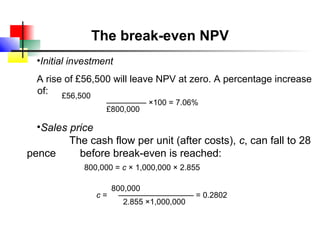
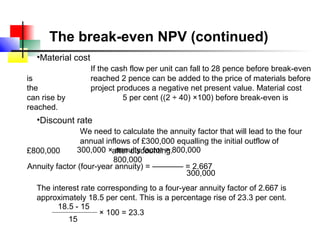
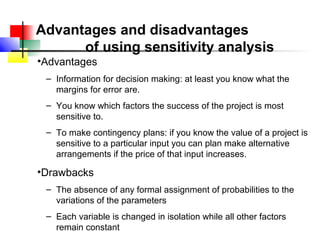
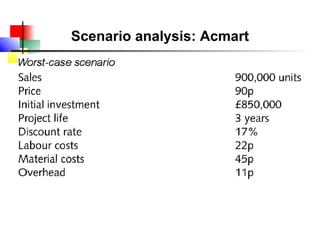
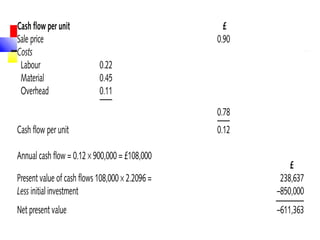
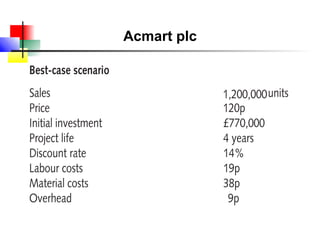
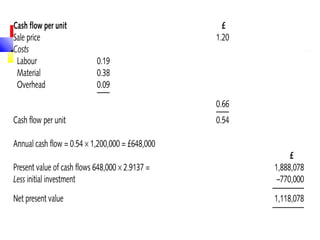
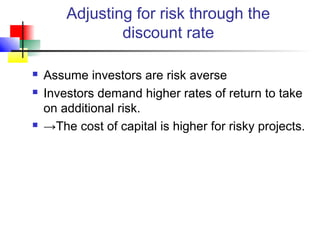
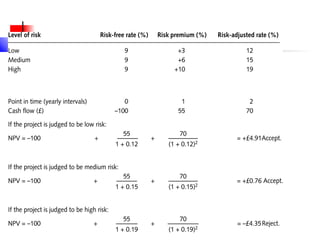
Risk


 When is more than one possible
outcome for an investment there is
              risk.
Risk and project appraisal
 •Presenting a more realistic and rounded view of a
 project’s prospects by incorporating risk in an
   appraisal
  •Presenting a sensitivity graph and discuss break-
even NPV
 •Undertake scenario analysis
 •Adjusting for risk by varying the discount rate
   Three types of expectations about the future:
       1 Certainty
       2 Risk
       3. Uncertainty
   Objective probabilities
       Estimated from historical data
       E.g. a supermarket chain has 100 existing supermarkets what
        is the probability of a new one being profitable.
   Subjective
Objective Probabilities
Frequency distribution of
    supermarket profitability
Sensitivity analysis
                       Acmart plc
•Acmart plc has developed a new product line called Marts
•Likely demand for Marts is 1,000,000 per year, at a price of £1,
   for the four-year life of the project
Acmarts plc (continued)
  •Required rate of return on a project of this risk
class is 15 per cent
 •Expected net present value:
Sensitivity graph for Marts
The break-even NPV
  •Initial investment
  A rise of £56,500 will leave NPV at zero. A percentage increase
  of: £56,500
                   ––––––––– ×100 = 7.06%
                   £800,000

  •Sales price
         The cash flow per unit (after costs), c, can fall to 28
pence      before break-even is reached:
             800,000 = c × 1,000,000 × 2.855

                   800,000
                c = ––––––––––––––––– = 0.2802
                      2.855 ×1,000,000
The break-even NPV (continued)
  •Material cost
                   If the cash flow per unit can fall to 28 pence before break-even
is                 reached 2 pence can be added to the price of materials before
the                project produces a negative net present value. Material cost
can rise by                  5 per cent ((2 ÷ 40) ×100) before break-even is
reached.
  •Discount rate
                We need to calculate the annuity factor that will lead to the four
                annual inflows of £300,000 equalling the initial outflow of
£800,000      300,000 ×after discounting.800,000
                          annuity factor =
                         800,000
Annuity factor (four-year annuity) = ––––––– = 2.667
                                             300,000
  The interest rate corresponding to a four-year annuity factor of 2.667 is
  approximately 18.5 per cent. This is a percentage rise of 23.3 per cent.
        18.5 - 15
                     × 100 = 23.3
           15
Advantages and disadvantages
      of using sensitivity analysis
•Advantages
 – Information for decision making: at least you know what the
   margins for error are.
 – You know which factors the success of the project is most
   sensitive to.
 – To make contingency plans: if you know the value of a project is
   sensitive to a particular input you can plan make alternative
   arrangements if the price of that input increases.

•Drawbacks
 – The absence of any formal assignment of probabilities to the
   variations of the parameters
 – Each variable is changed in isolation while all other factors
   remain constant
Scenario analysis: Acmart
        Acmart plc:
Acmart plc
Adjusting for risk through the
                discount rate

   Assume investors are risk averse
   Investors demand higher rates of return to take
    on additional risk.
   →The cost of capital is higher for risky projects.
How do we estimate the risk
                premium?

   We need to know how investors price risk in the
    market.
   As a first step we need to understand how
    investors manage the risk of their investments.

Npvrisk

  • 1.
    Risk When ismore than one possible outcome for an investment there is risk.
  • 2.
    Risk and projectappraisal •Presenting a more realistic and rounded view of a project’s prospects by incorporating risk in an appraisal •Presenting a sensitivity graph and discuss break- even NPV •Undertake scenario analysis •Adjusting for risk by varying the discount rate
  • 3.
    Three types of expectations about the future:  1 Certainty  2 Risk  3. Uncertainty  Objective probabilities  Estimated from historical data  E.g. a supermarket chain has 100 existing supermarkets what is the probability of a new one being profitable.  Subjective
  • 4.
  • 5.
    Frequency distribution of supermarket profitability
  • 6.
    Sensitivity analysis Acmart plc •Acmart plc has developed a new product line called Marts •Likely demand for Marts is 1,000,000 per year, at a price of £1, for the four-year life of the project
  • 8.
    Acmarts plc (continued) •Required rate of return on a project of this risk class is 15 per cent •Expected net present value:
  • 13.
  • 14.
    The break-even NPV •Initial investment A rise of £56,500 will leave NPV at zero. A percentage increase of: £56,500 ––––––––– ×100 = 7.06% £800,000 •Sales price The cash flow per unit (after costs), c, can fall to 28 pence before break-even is reached: 800,000 = c × 1,000,000 × 2.855 800,000 c = ––––––––––––––––– = 0.2802 2.855 ×1,000,000
  • 15.
    The break-even NPV(continued) •Material cost If the cash flow per unit can fall to 28 pence before break-even is reached 2 pence can be added to the price of materials before the project produces a negative net present value. Material cost can rise by 5 per cent ((2 ÷ 40) ×100) before break-even is reached. •Discount rate We need to calculate the annuity factor that will lead to the four annual inflows of £300,000 equalling the initial outflow of £800,000 300,000 ×after discounting.800,000 annuity factor = 800,000 Annuity factor (four-year annuity) = ––––––– = 2.667 300,000 The interest rate corresponding to a four-year annuity factor of 2.667 is approximately 18.5 per cent. This is a percentage rise of 23.3 per cent. 18.5 - 15 × 100 = 23.3 15
  • 16.
    Advantages and disadvantages of using sensitivity analysis •Advantages – Information for decision making: at least you know what the margins for error are. – You know which factors the success of the project is most sensitive to. – To make contingency plans: if you know the value of a project is sensitive to a particular input you can plan make alternative arrangements if the price of that input increases. •Drawbacks – The absence of any formal assignment of probabilities to the variations of the parameters – Each variable is changed in isolation while all other factors remain constant
  • 17.
  • 19.
  • 21.
    Adjusting for riskthrough the discount rate  Assume investors are risk averse  Investors demand higher rates of return to take on additional risk.  →The cost of capital is higher for risky projects.
  • 23.
    How do weestimate the risk premium?  We need to know how investors price risk in the market.  As a first step we need to understand how investors manage the risk of their investments.