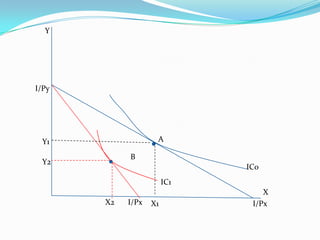
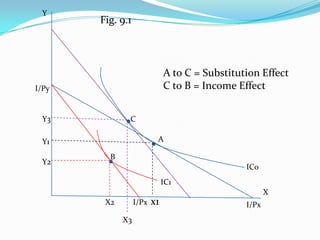
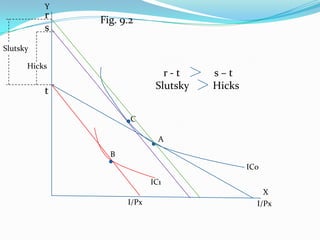
1. Academic Year: 2012/2013
Instructors: Brenda Lynch and PJ Hunt
Contact: brendalynch@ucc.ie
p.hunt@ucc.ie
2. Fig 9.1 Two goods, X and Y. Income fixed. Original
consumer equilibrium is at X1, Y1 (Point A).
Price of X increases, the budget line rotates
inward on the X axis and the new consumer
equilibrium is at X2, Y2 (point B).
4. This drop in utility is caused by;
(a) The income effect and
(b) The substitution effect.
(a) An increase in the price of X is like a
drop in real income.
(b) The substitution effect is the adjustment
of demand to a change in the relative prices
of goods as a result of a change in the price
of one of the goods.
5. To isolate the substitution effect, remove the
income effect by compensating the consumer just
enough income to put him back on the original
IC0.
Do this by drawing a line tangential to IC0
and parallel to new budget line. New
intersect is at X3, Y3 (Point C).
The income effect reduces consumption of
X from X3 to X2; the substitution effect
reduces consumption from X1 to X3.
6. Y
Fig. 9.1
A to C = Substitution Effect
I/Py C to B = Income Effect
Y3 C
Y1 A
B
Y2
IC0
IC1
X
X2 I/Px x1 I/Px
X3
7. Hicks and Slutsky.
Inflation increases, how much do you
compensate workers?
Two ways (we only look at one way);
1. Compensation Variation in Income
Hicks, compensate workers at new prices to
allow them obtain original level of utility.
Slutsky, compensate workers at new prices
to obtain original bundle of goods.
8. Fig. 9.2 – Compensation Variation
Original consumer equilibrium at point A.
Price of one good doubles, budget line
pivots inward. New consumer equilibrium is
at point B.
9. Hicks. Draw line parallel to new budget line and
tangential to IC0 i.e. original utility on original IC.
Compensation Variation = S –T
Slutsky. Draw line parallel to new budget
line and tangential original consumer
equilibrium i.e. original bundle of goods.
Compensation Variation = R-T
10. Y
r Fig. 9.2
s
Slutsky
Hicks
r-t s–t
t Slutsky Hicks
C
A
B
IC0
IC1
X
I/Px I/Px