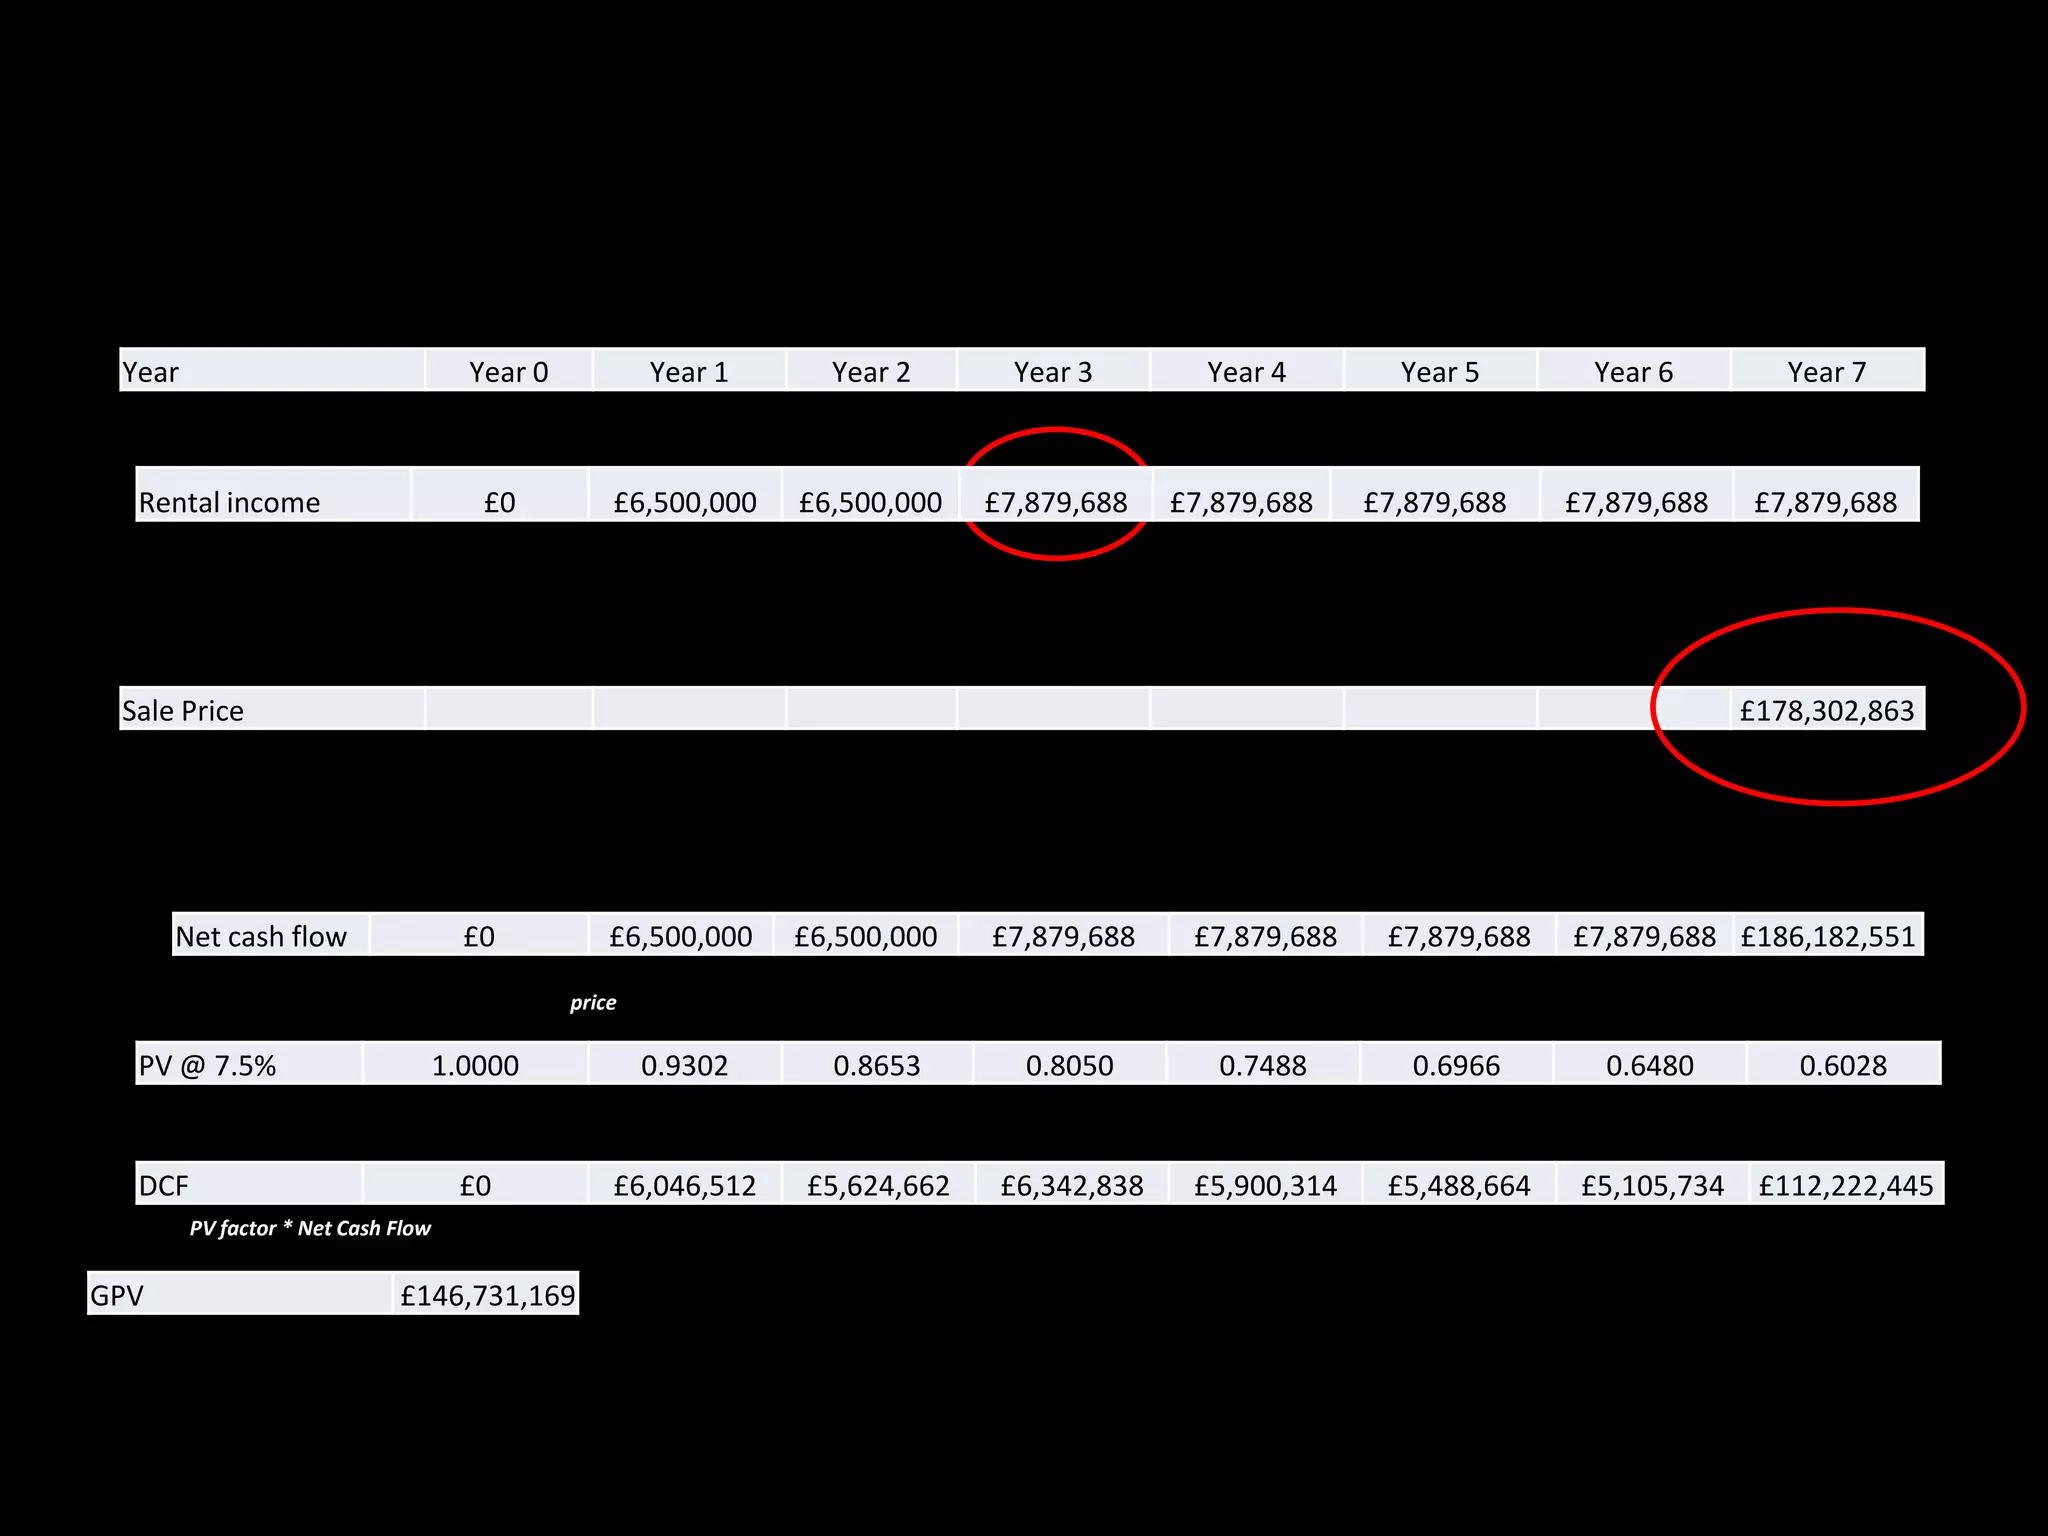
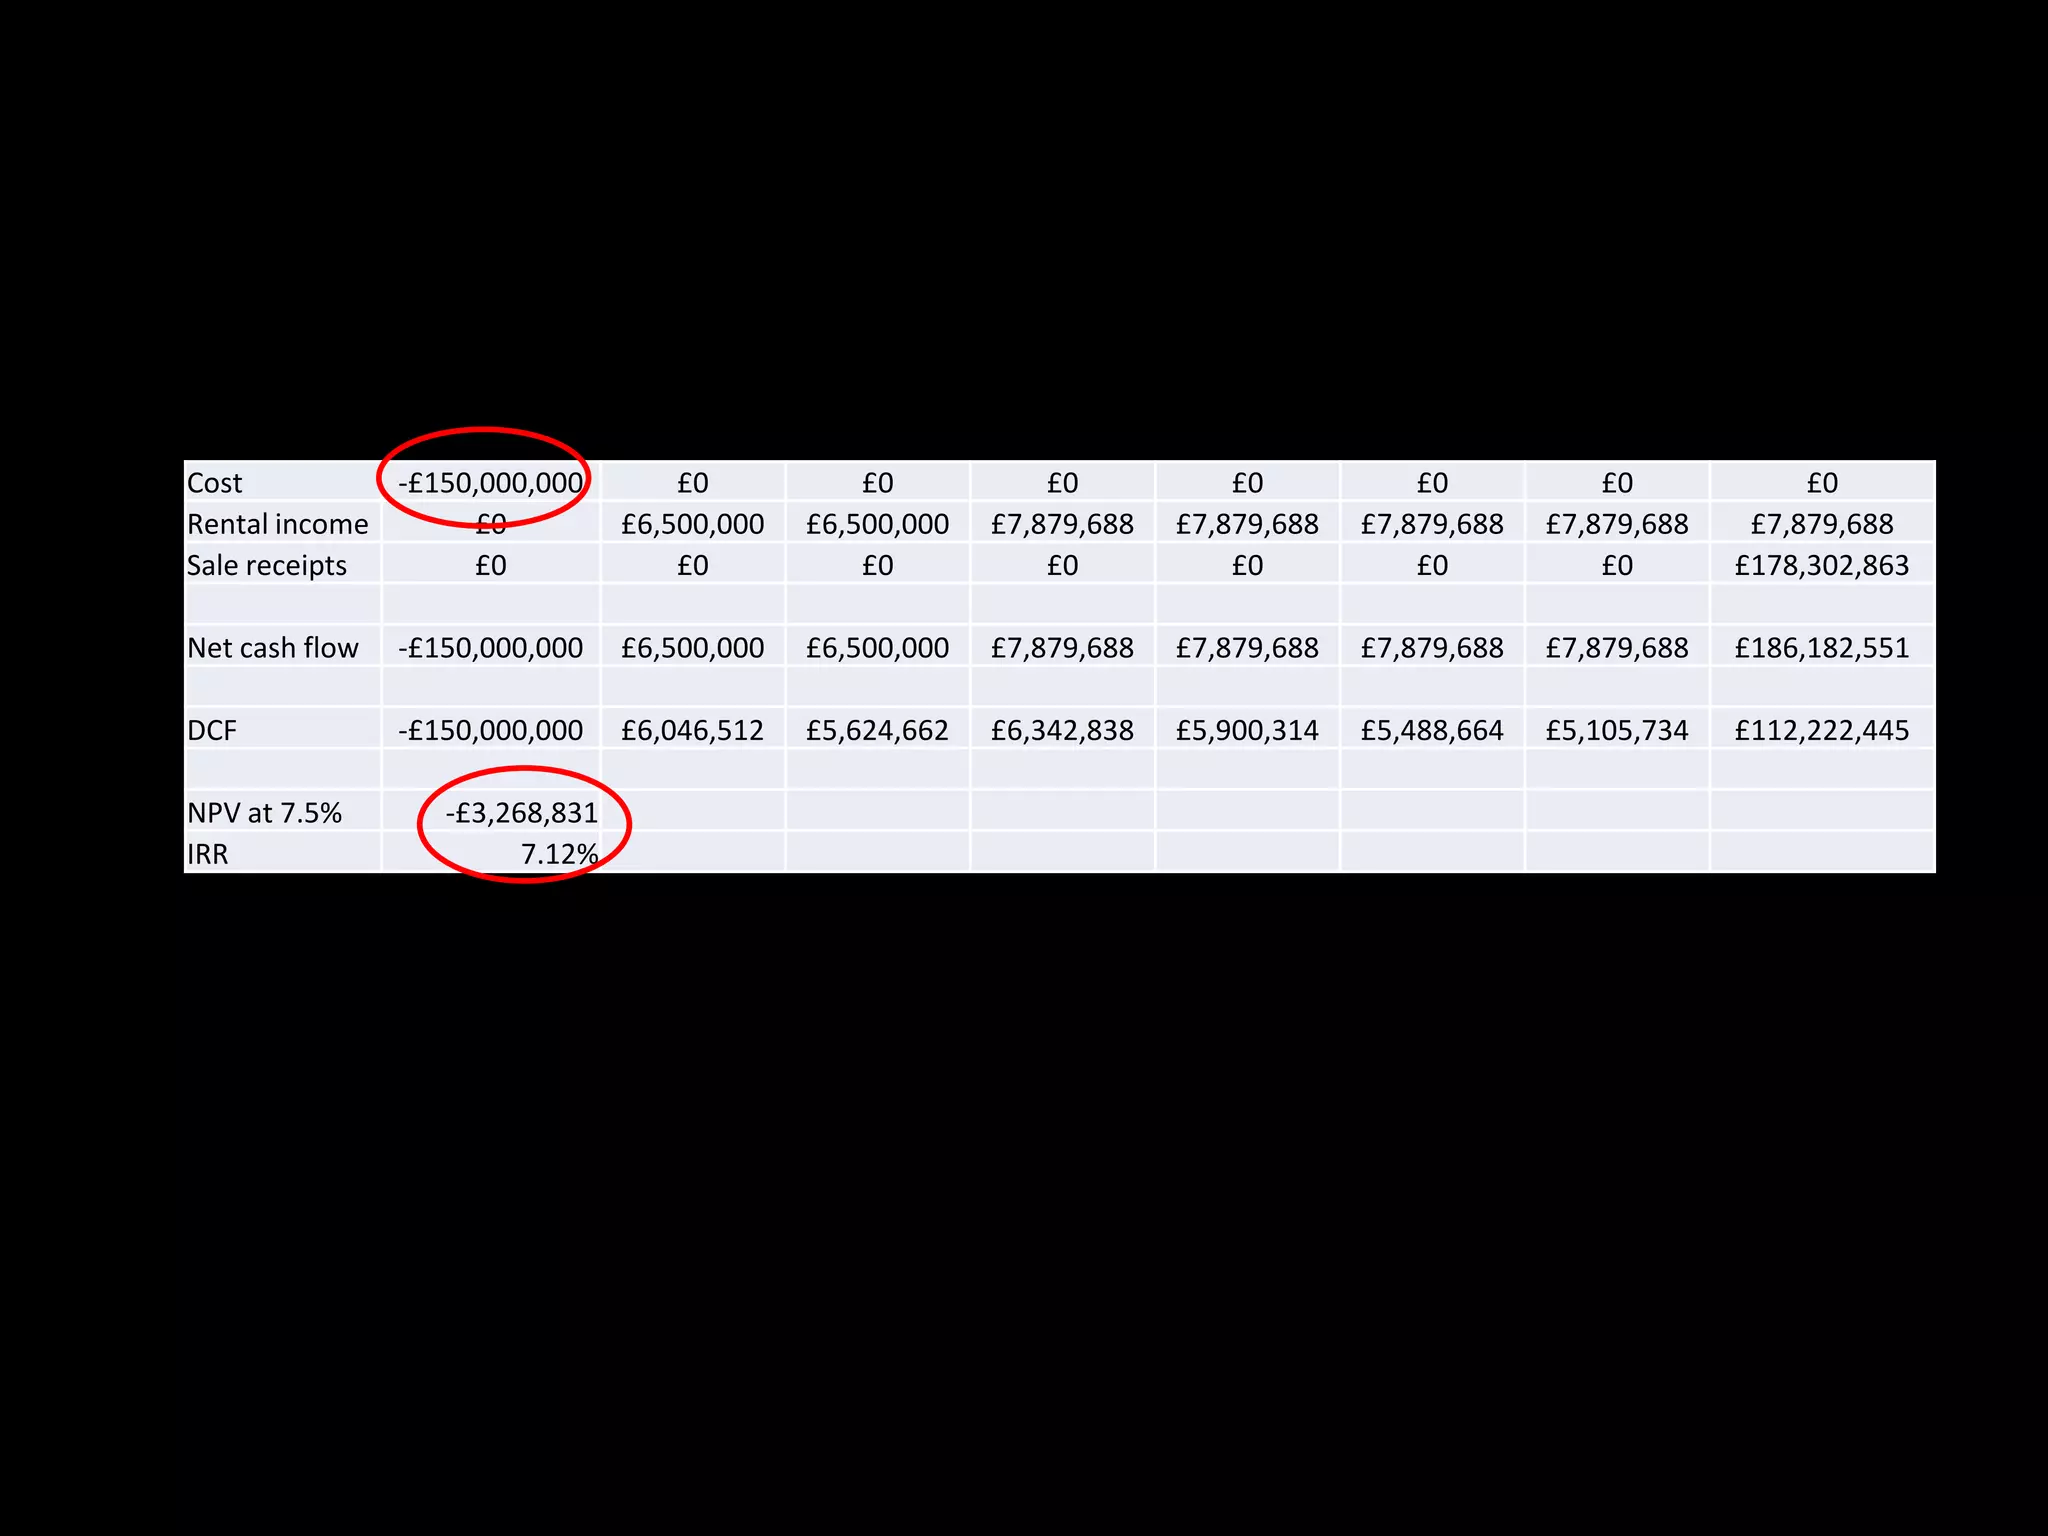
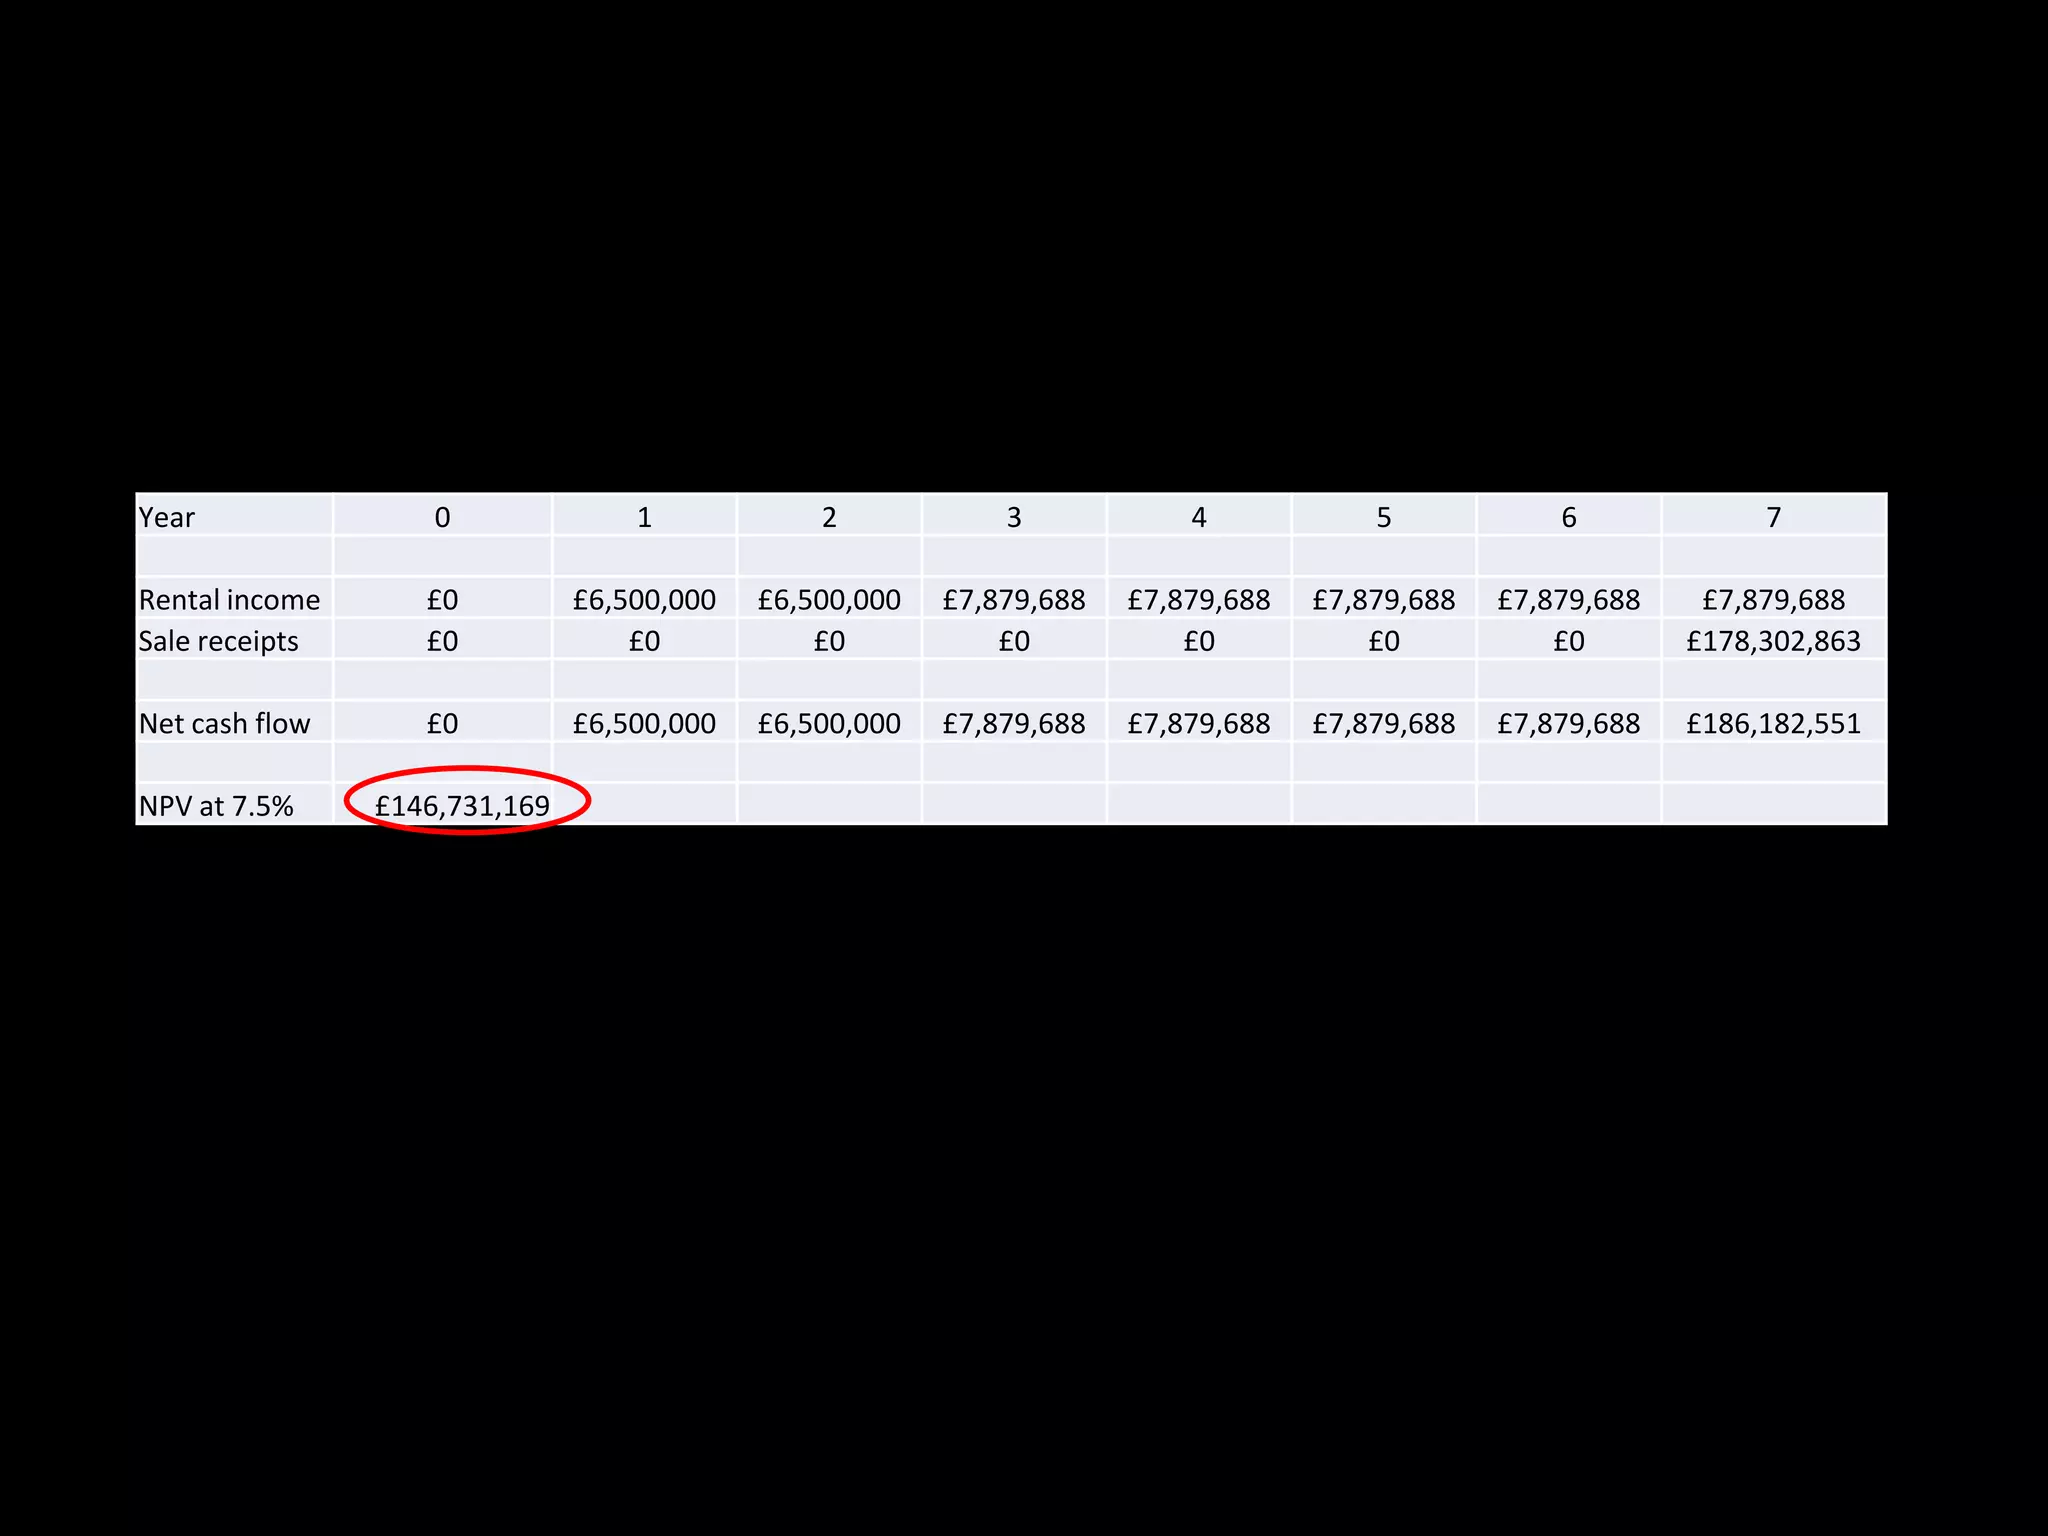
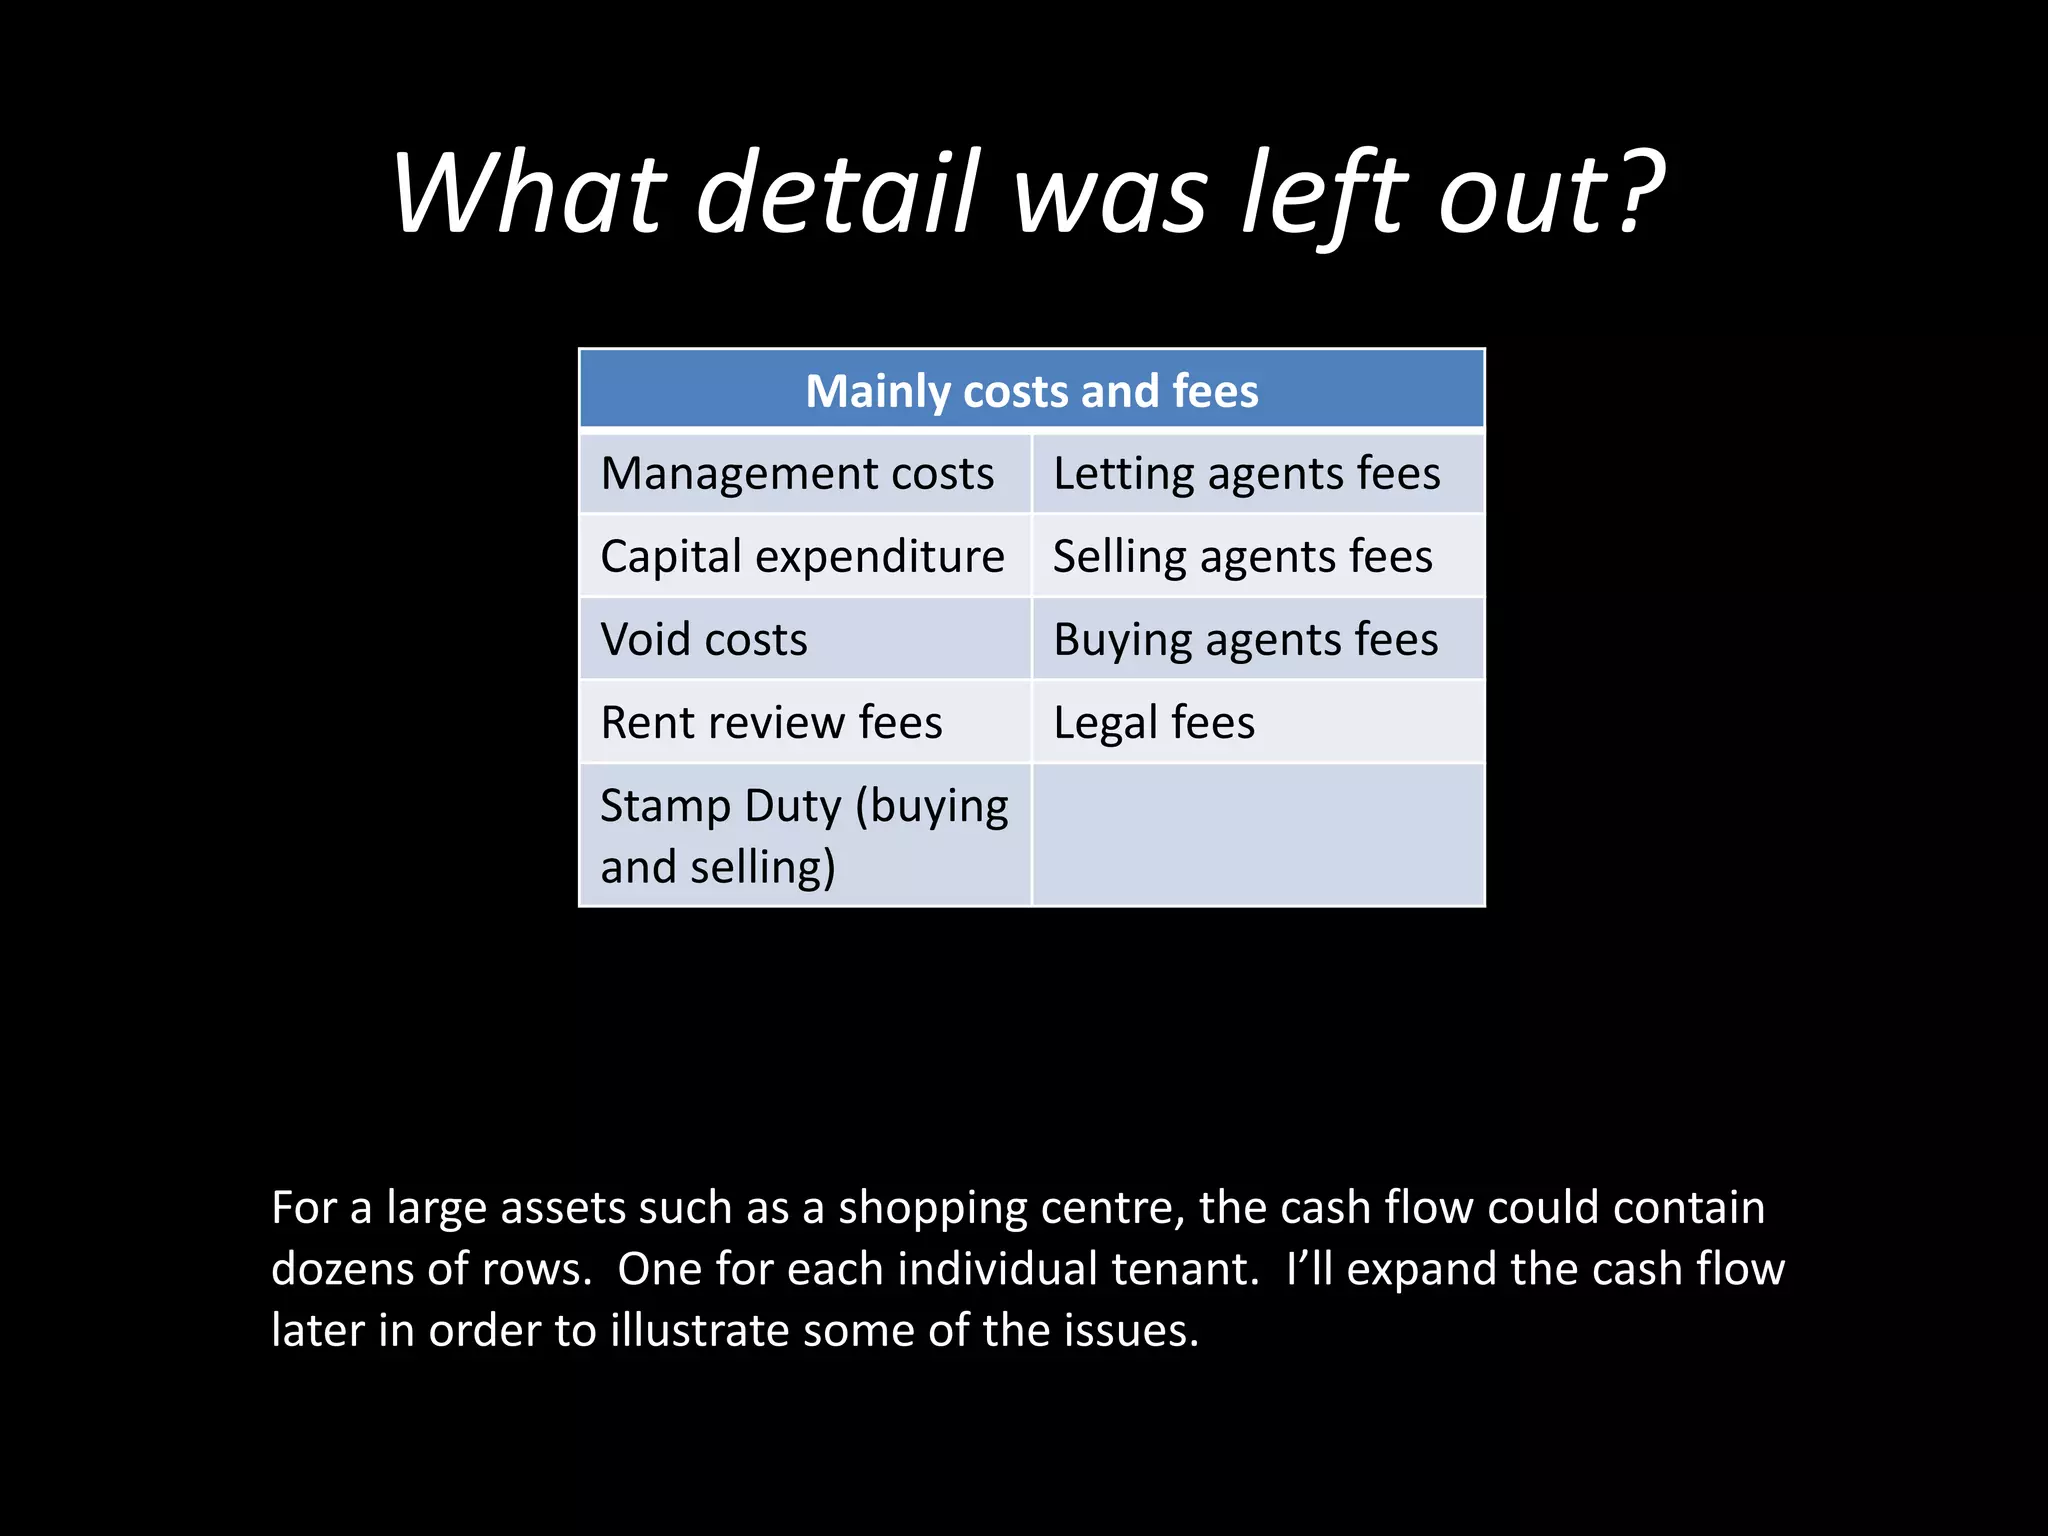
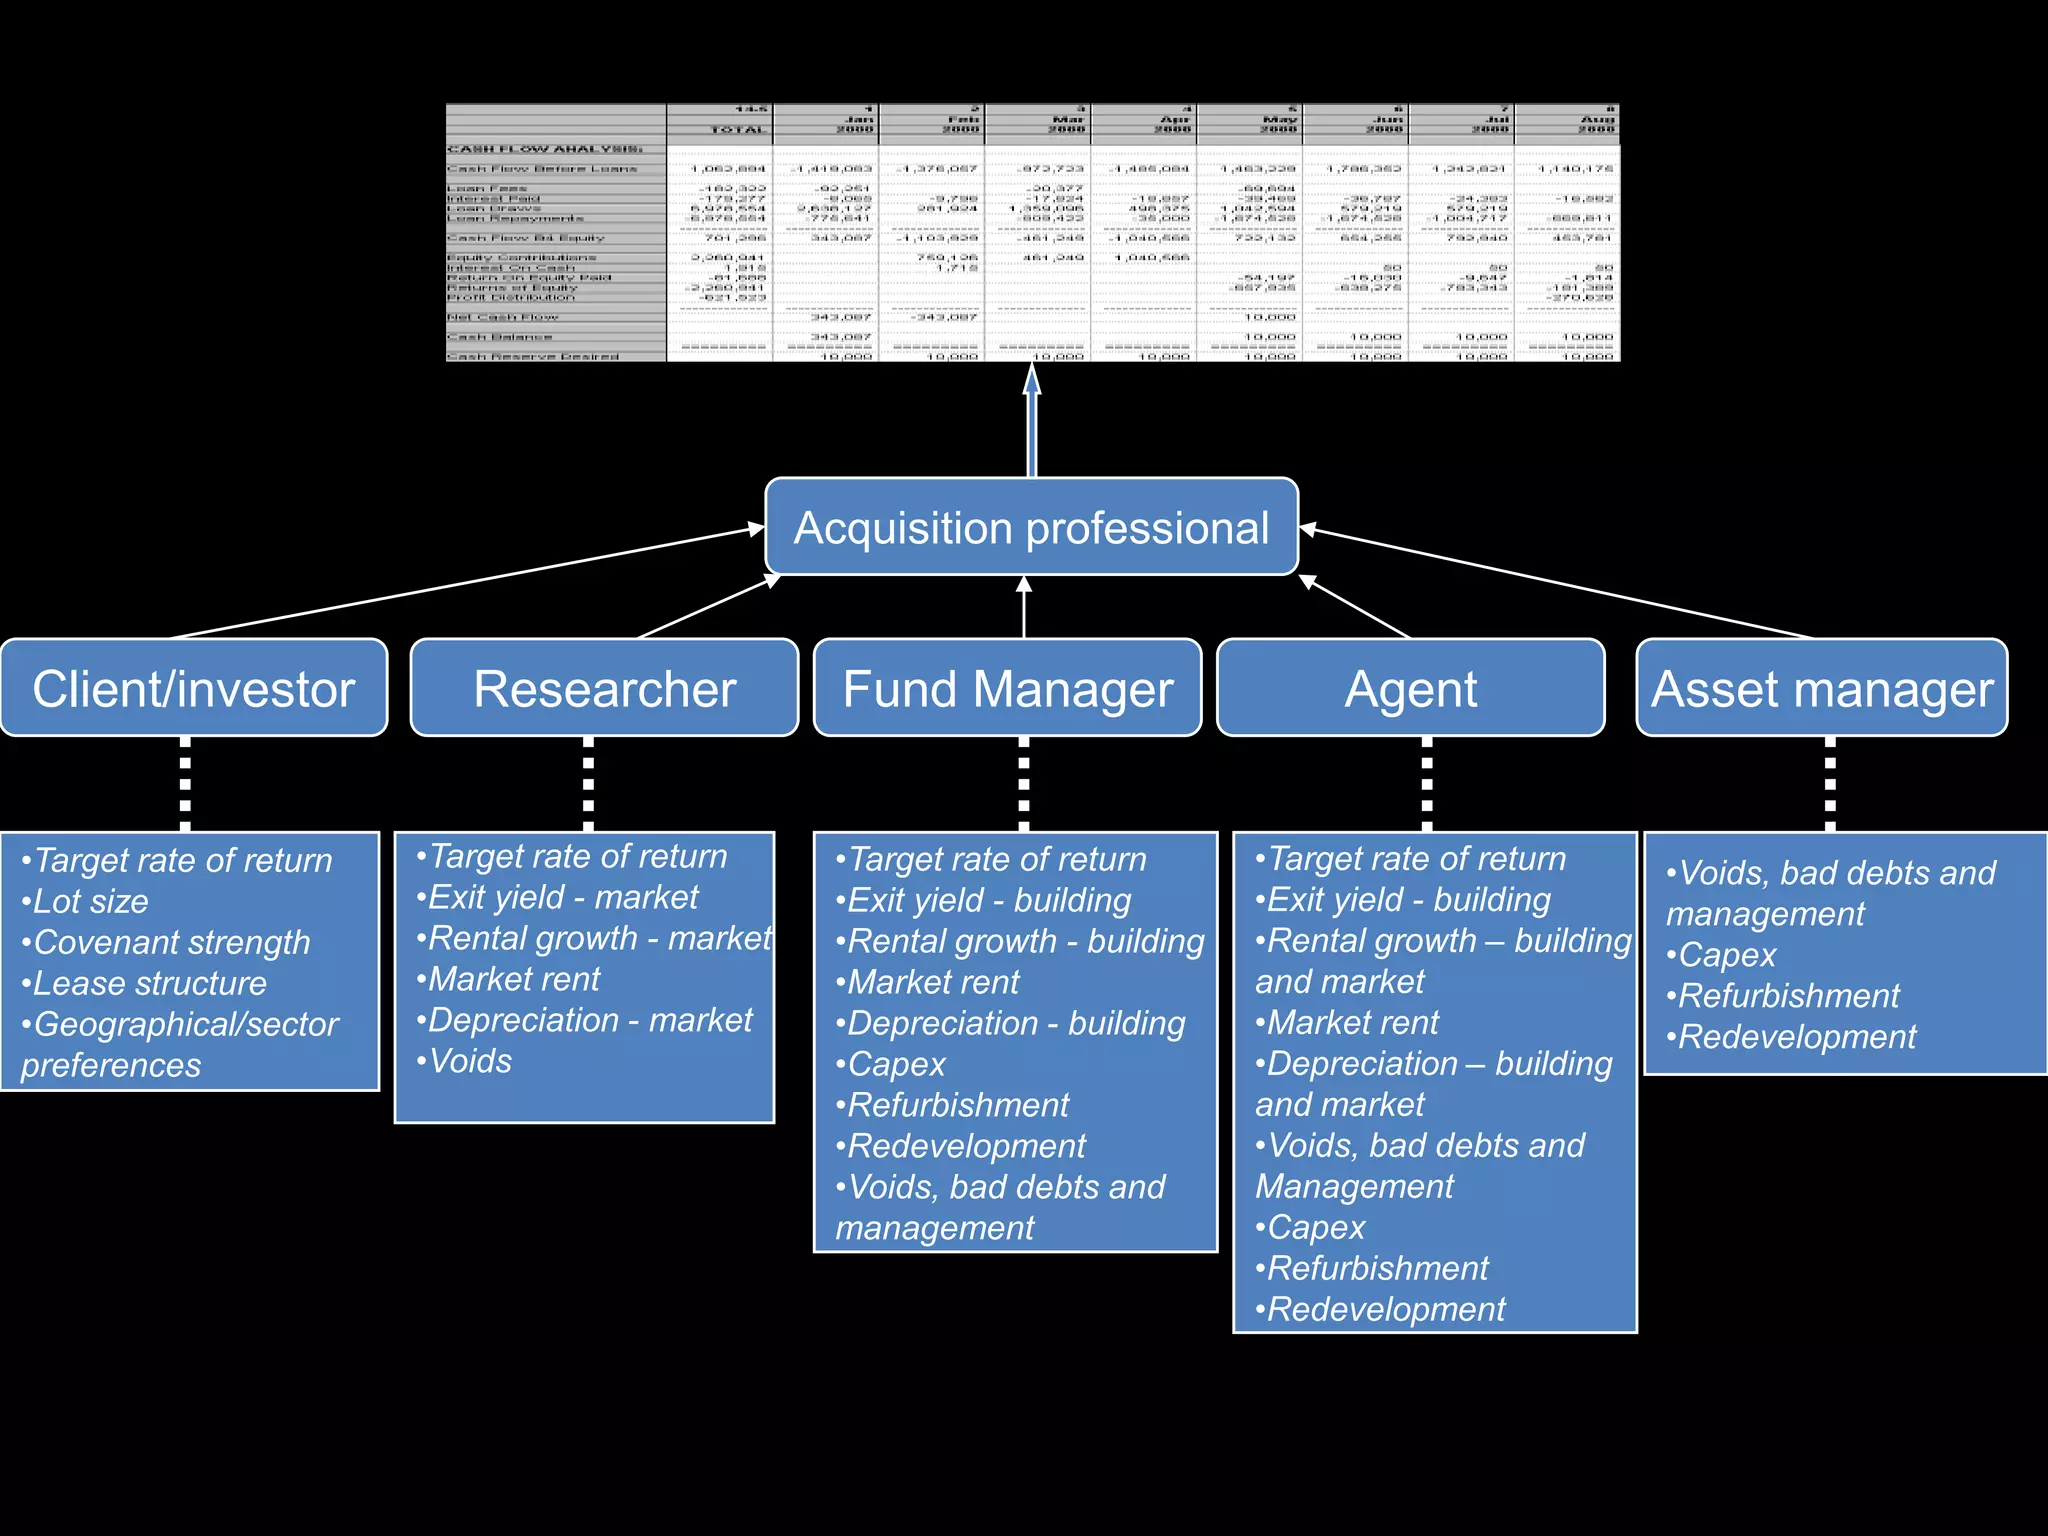
TOPIC 3
CALCULATING THE INVESTMENT VALUE
OF REAL ESTATE ASSETS: THE PROCESS
AND CORE INFORMATION NEEDS
Topics covered
•
•
•
•
•

Rationale, required knowledge and rough approach
A hypothetical example
The hypothetical cash flow
The missing detail
The Key Inputs
–
–
–
–
–

Forecasting rents
Forecasting sale prices
Forecasting depreciation
Forecasting void costs
Setting the target rate of return
Why?
• BECAUSE MOST MAJOR INVESTORS
UNDERTAKE FINANCIAL MODELLING OF REAL
ESTATE ASSETS IN ORDER TO
– TO WORK OUT HOW MUCH THEY CAN
PAY FOR AN ASSET THAT THEY ARE
CONSIDERING BUYING
– TO WORK OUT WHETHER AN ASSET THAT THEY
OWN WILL DELIVER THEIR REQUIRED

RETURNS
Some basic concepts
•

AN ASSET’S VALUE IS TAKEN AS THE PRESENT VALUE OF ITS FUTURE

REVENUE STREAMS.
•

THIS IS A FUNCTION OF THREE THINGS

– THE REVENUE STREAM
– THE TARGET RATE OF RETURN
– TIME
•

“INVESTMENT VALUE” IS THE WORTH

OF AN ASSET TO AN
INVESTOR OR A CLASS OF INVESTORS

•

You can think of Investment Value as similar to equity analysts trying to establish
whether companies’ share prices are overvalued or undervalued. Equity analysts
often estimate the future cash flows of the companies to estimate the present
value of the dividend flows. You see phrases like “intrinsic”, “fundamental” or
“fair” value being used to mean the same thing as IV. They then compare this
estimate of value to the actual price at which companies’ shares are trading .
A common approach is to
• Set out on an annual (but could be quarterly or
monthly) basis
–
–
–
–

How much cash (do we estimate) will be paid out?
When (do we estimate that) it will be paid out?
How much cash (do we estimate) will be received?
When (do we estimate that) it will be received?

• You need to estimate a target rate of return
• Then estimate the Gross Present Value of the net
cash flow produced by the asset
2.

A HYPOTHETICAL EXAMPLE
An example
• Let’s take a hypothetical example – and strip out
some of the detail for now
• Where? A real estate asset in London’s West End
• What? 10,000 sq m of office space
• Who? It was let three years ago to a tenant on a
15 year lease with rent reviews to Market Rent
every five years.
• How long? The investor has a seven year

holding horizon
How much? Just the basic inputs for now
•

How much (1)? The tenant is paying £6,500,000 rent per annum

•

How much (2)? Recent deals suggest that if let today the Market

£7,500,000
•
•
•

Rent is

How much (3)? The research department estimate that Market Rents will
grow at 3.5% per annum for the next seven years.
How much (4)? The research department also estimate that offices experience
rental depreciation at 1% per annum – i.e. loses value
How much (5)? The research department also think that the asset will sell for 20
times its rent in seven year’s time – that’s an (exit) yield or cap

rate of 5%
•

How much (6)? The investor has a target

per annum
•

How much (7)? The existing owner wants

rate of return of 7.5%

£150,000,000 for it.
3.

THE CASH FLOW
Here goes
Year

Year 0

Year 2

Year 3

Year 4

Year 5

Year 6

Year 7

£0

Rental income

Year 1

£6,500,000

£6,500,000

£7,879,688

£7,879,688

£7,879,688

£7,879,688

£7,879,688

This is the rent review five years into the lease. The lease started three years ago. The Market Rent is currently
£7,500,000. However, the research department are forecasting Market Rents to grow at 3.5% per annum.
However, this asset is also expected to depreciate at 1% per annum. £7,879,688 represents £7,500,000 grown at
2.5% per annum for two years. This stays fixed for five years until the next rent review.

Sale Price

£178,302,863
The sale price is a product of the rent at sale and the rental multiplier
(exit yield at sale). The rent at sale is expected to be £7,500,000 grown at
2.5% per annum for seven years. This is £8,915,143. The expected exit
yield is 5% or the multiplier is 20. This gives £178,302,863.

Net cash flow

£0

£6,500,000

£6,500,000

£7,879,688

£7,879,688

£7,879,688

£7,879,688 £186,182,551

Total revenues from rental income and sale price

PV @ 7.5%

1.0000

0.9302

0.8653

0.8050

0.7488

0.6966

0.6480

0.6028

£0

£6,046,512

£5,624,662

£6,342,838

£5,900,314

£5,488,664

£5,105,734

£112,222,445

(1+i)-n

DCF
PV factor * Net Cash Flow

GPV

£146,731,169

This the sum of the discounted cash
flows.
It is how much the investor should pay
if they require a 7.5% return
As you should realise, if they pay the £150 million, they
won’t receive their target rate of return of 7.5% per
annum.
Cost
-£150,000,000
Rental income
£0
Sale receipts
£0

£0
£6,500,000
£0

£0
£6,500,000
£0

£0
£7,879,688
£0

£0
£7,879,688
£0

£0
£7,879,688
£0

£0
£7,879,688
£0

£0
£7,879,688
£178,302,863

Net cash flow

-£150,000,000

£6,500,000

£6,500,000

£7,879,688

£7,879,688

£7,879,688

£7,879,688

£186,182,551

DCF

-£150,000,000

£6,046,512

£5,624,662

£6,342,838

£5,900,314

£5,488,664

£5,105,734

£112,222,445

NPV at 7.5%
IRR

-£3,268,831
7.12%

The IRR is below the target
rate of return and the NPV
is negative
Alternatively, if they are trying to work out how much
to pay, there is no initial cost – and the surplus is what
the asset is worth to them
Year

0

1

2

3

4

5

6

7

Rental income
Sale receipts

£0
£0

£6,500,000
£0

£6,500,000
£0

£7,879,688
£0

£7,879,688
£0

£7,879,688
£0

£7,879,688
£0

£7,879,688
£178,302,863

Net cash flow

£0

£6,500,000

£6,500,000

£7,879,688

£7,879,688

£7,879,688

£7,879,688

£186,182,551

NPV at 7.5%

£146,731,169
4.

THE MISSING DETAIL
What detail was left out?
Mainly costs and fees
Management costs

Letting agents fees

Capital expenditure Selling agents fees
Void costs

Buying agents fees

Rent review fees

Legal fees

Stamp Duty (buying
and selling)

For a large assets such as a shopping centre, the cash flow could contain
dozens of rows. One for each individual tenant. I’ll expand the cash flow
later in order to illustrate some of the issues.
5.

THE KEY INPUTS
5.1 FORECASTING RENTS
5.2 FORECASTING SALE PRICES
5.3 FORECASTING DEPRECIATION
5.4 FORECASTING VOID COSTS
5.4 SETTING THE TARGET RATE OF
RETURN
Acquisition professional

Client/investor
•Target rate of return
•Lot size
•Covenant strength
•Lease structure
•Geographical/sector
preferences

Researcher
•Target rate of return
•Exit yield - market
•Rental growth - market
•Market rent
•Depreciation - market
•Voids

Fund Manager
•Target rate of return
•Exit yield - building
•Rental growth - building
•Market rent
•Depreciation - building
•Capex
•Refurbishment
•Redevelopment
•Voids, bad debts and
management

Agent
•Target rate of return
•Exit yield - building
•Rental growth – building
and market
•Market rent
•Depreciation – building
and market
•Voids, bad debts and
Management
•Capex
•Refurbishment
•Redevelopment

Asset manager

•Voids, bad debts and
management
•Capex
•Refurbishment
•Redevelopment
Garbage In-Garbage Out!
Lots to look at on Moodle.

Week 3 slides (1)

  • 1.
    TOPIC 3 CALCULATING THEINVESTMENT VALUE OF REAL ESTATE ASSETS: THE PROCESS AND CORE INFORMATION NEEDS
  • 2.
    Topics covered • • • • • Rationale, requiredknowledge and rough approach A hypothetical example The hypothetical cash flow The missing detail The Key Inputs – – – – – Forecasting rents Forecasting sale prices Forecasting depreciation Forecasting void costs Setting the target rate of return
  • 3.
    Why? • BECAUSE MOSTMAJOR INVESTORS UNDERTAKE FINANCIAL MODELLING OF REAL ESTATE ASSETS IN ORDER TO – TO WORK OUT HOW MUCH THEY CAN PAY FOR AN ASSET THAT THEY ARE CONSIDERING BUYING – TO WORK OUT WHETHER AN ASSET THAT THEY OWN WILL DELIVER THEIR REQUIRED RETURNS
  • 4.
    Some basic concepts • ANASSET’S VALUE IS TAKEN AS THE PRESENT VALUE OF ITS FUTURE REVENUE STREAMS. • THIS IS A FUNCTION OF THREE THINGS – THE REVENUE STREAM – THE TARGET RATE OF RETURN – TIME • “INVESTMENT VALUE” IS THE WORTH OF AN ASSET TO AN INVESTOR OR A CLASS OF INVESTORS • You can think of Investment Value as similar to equity analysts trying to establish whether companies’ share prices are overvalued or undervalued. Equity analysts often estimate the future cash flows of the companies to estimate the present value of the dividend flows. You see phrases like “intrinsic”, “fundamental” or “fair” value being used to mean the same thing as IV. They then compare this estimate of value to the actual price at which companies’ shares are trading .
  • 5.
    A common approachis to • Set out on an annual (but could be quarterly or monthly) basis – – – – How much cash (do we estimate) will be paid out? When (do we estimate that) it will be paid out? How much cash (do we estimate) will be received? When (do we estimate that) it will be received? • You need to estimate a target rate of return • Then estimate the Gross Present Value of the net cash flow produced by the asset
  • 6.
  • 7.
    An example • Let’stake a hypothetical example – and strip out some of the detail for now • Where? A real estate asset in London’s West End • What? 10,000 sq m of office space • Who? It was let three years ago to a tenant on a 15 year lease with rent reviews to Market Rent every five years. • How long? The investor has a seven year holding horizon
  • 8.
    How much? Justthe basic inputs for now • How much (1)? The tenant is paying £6,500,000 rent per annum • How much (2)? Recent deals suggest that if let today the Market £7,500,000 • • • Rent is How much (3)? The research department estimate that Market Rents will grow at 3.5% per annum for the next seven years. How much (4)? The research department also estimate that offices experience rental depreciation at 1% per annum – i.e. loses value How much (5)? The research department also think that the asset will sell for 20 times its rent in seven year’s time – that’s an (exit) yield or cap rate of 5% • How much (6)? The investor has a target per annum • How much (7)? The existing owner wants rate of return of 7.5% £150,000,000 for it.
  • 9.
  • 10.
    Here goes Year Year 0 Year2 Year 3 Year 4 Year 5 Year 6 Year 7 £0 Rental income Year 1 £6,500,000 £6,500,000 £7,879,688 £7,879,688 £7,879,688 £7,879,688 £7,879,688 This is the rent review five years into the lease. The lease started three years ago. The Market Rent is currently £7,500,000. However, the research department are forecasting Market Rents to grow at 3.5% per annum. However, this asset is also expected to depreciate at 1% per annum. £7,879,688 represents £7,500,000 grown at 2.5% per annum for two years. This stays fixed for five years until the next rent review. Sale Price £178,302,863 The sale price is a product of the rent at sale and the rental multiplier (exit yield at sale). The rent at sale is expected to be £7,500,000 grown at 2.5% per annum for seven years. This is £8,915,143. The expected exit yield is 5% or the multiplier is 20. This gives £178,302,863. Net cash flow £0 £6,500,000 £6,500,000 £7,879,688 £7,879,688 £7,879,688 £7,879,688 £186,182,551 Total revenues from rental income and sale price PV @ 7.5% 1.0000 0.9302 0.8653 0.8050 0.7488 0.6966 0.6480 0.6028 £0 £6,046,512 £5,624,662 £6,342,838 £5,900,314 £5,488,664 £5,105,734 £112,222,445 (1+i)-n DCF PV factor * Net Cash Flow GPV £146,731,169 This the sum of the discounted cash flows. It is how much the investor should pay if they require a 7.5% return
  • 11.
    As you shouldrealise, if they pay the £150 million, they won’t receive their target rate of return of 7.5% per annum. Cost -£150,000,000 Rental income £0 Sale receipts £0 £0 £6,500,000 £0 £0 £6,500,000 £0 £0 £7,879,688 £0 £0 £7,879,688 £0 £0 £7,879,688 £0 £0 £7,879,688 £0 £0 £7,879,688 £178,302,863 Net cash flow -£150,000,000 £6,500,000 £6,500,000 £7,879,688 £7,879,688 £7,879,688 £7,879,688 £186,182,551 DCF -£150,000,000 £6,046,512 £5,624,662 £6,342,838 £5,900,314 £5,488,664 £5,105,734 £112,222,445 NPV at 7.5% IRR -£3,268,831 7.12% The IRR is below the target rate of return and the NPV is negative
  • 12.
    Alternatively, if theyare trying to work out how much to pay, there is no initial cost – and the surplus is what the asset is worth to them Year 0 1 2 3 4 5 6 7 Rental income Sale receipts £0 £0 £6,500,000 £0 £6,500,000 £0 £7,879,688 £0 £7,879,688 £0 £7,879,688 £0 £7,879,688 £0 £7,879,688 £178,302,863 Net cash flow £0 £6,500,000 £6,500,000 £7,879,688 £7,879,688 £7,879,688 £7,879,688 £186,182,551 NPV at 7.5% £146,731,169
  • 13.
  • 14.
    What detail wasleft out? Mainly costs and fees Management costs Letting agents fees Capital expenditure Selling agents fees Void costs Buying agents fees Rent review fees Legal fees Stamp Duty (buying and selling) For a large assets such as a shopping centre, the cash flow could contain dozens of rows. One for each individual tenant. I’ll expand the cash flow later in order to illustrate some of the issues.
  • 15.
  • 16.
  • 17.
  • 18.
  • 19.
  • 20.
    5.4 SETTING THETARGET RATE OF RETURN
  • 21.
    Acquisition professional Client/investor •Target rateof return •Lot size •Covenant strength •Lease structure •Geographical/sector preferences Researcher •Target rate of return •Exit yield - market •Rental growth - market •Market rent •Depreciation - market •Voids Fund Manager •Target rate of return •Exit yield - building •Rental growth - building •Market rent •Depreciation - building •Capex •Refurbishment •Redevelopment •Voids, bad debts and management Agent •Target rate of return •Exit yield - building •Rental growth – building and market •Market rent •Depreciation – building and market •Voids, bad debts and Management •Capex •Refurbishment •Redevelopment Asset manager •Voids, bad debts and management •Capex •Refurbishment •Redevelopment
  • 22.
  • 23.
    Lots to lookat on Moodle.