Download as PDF, PPTX


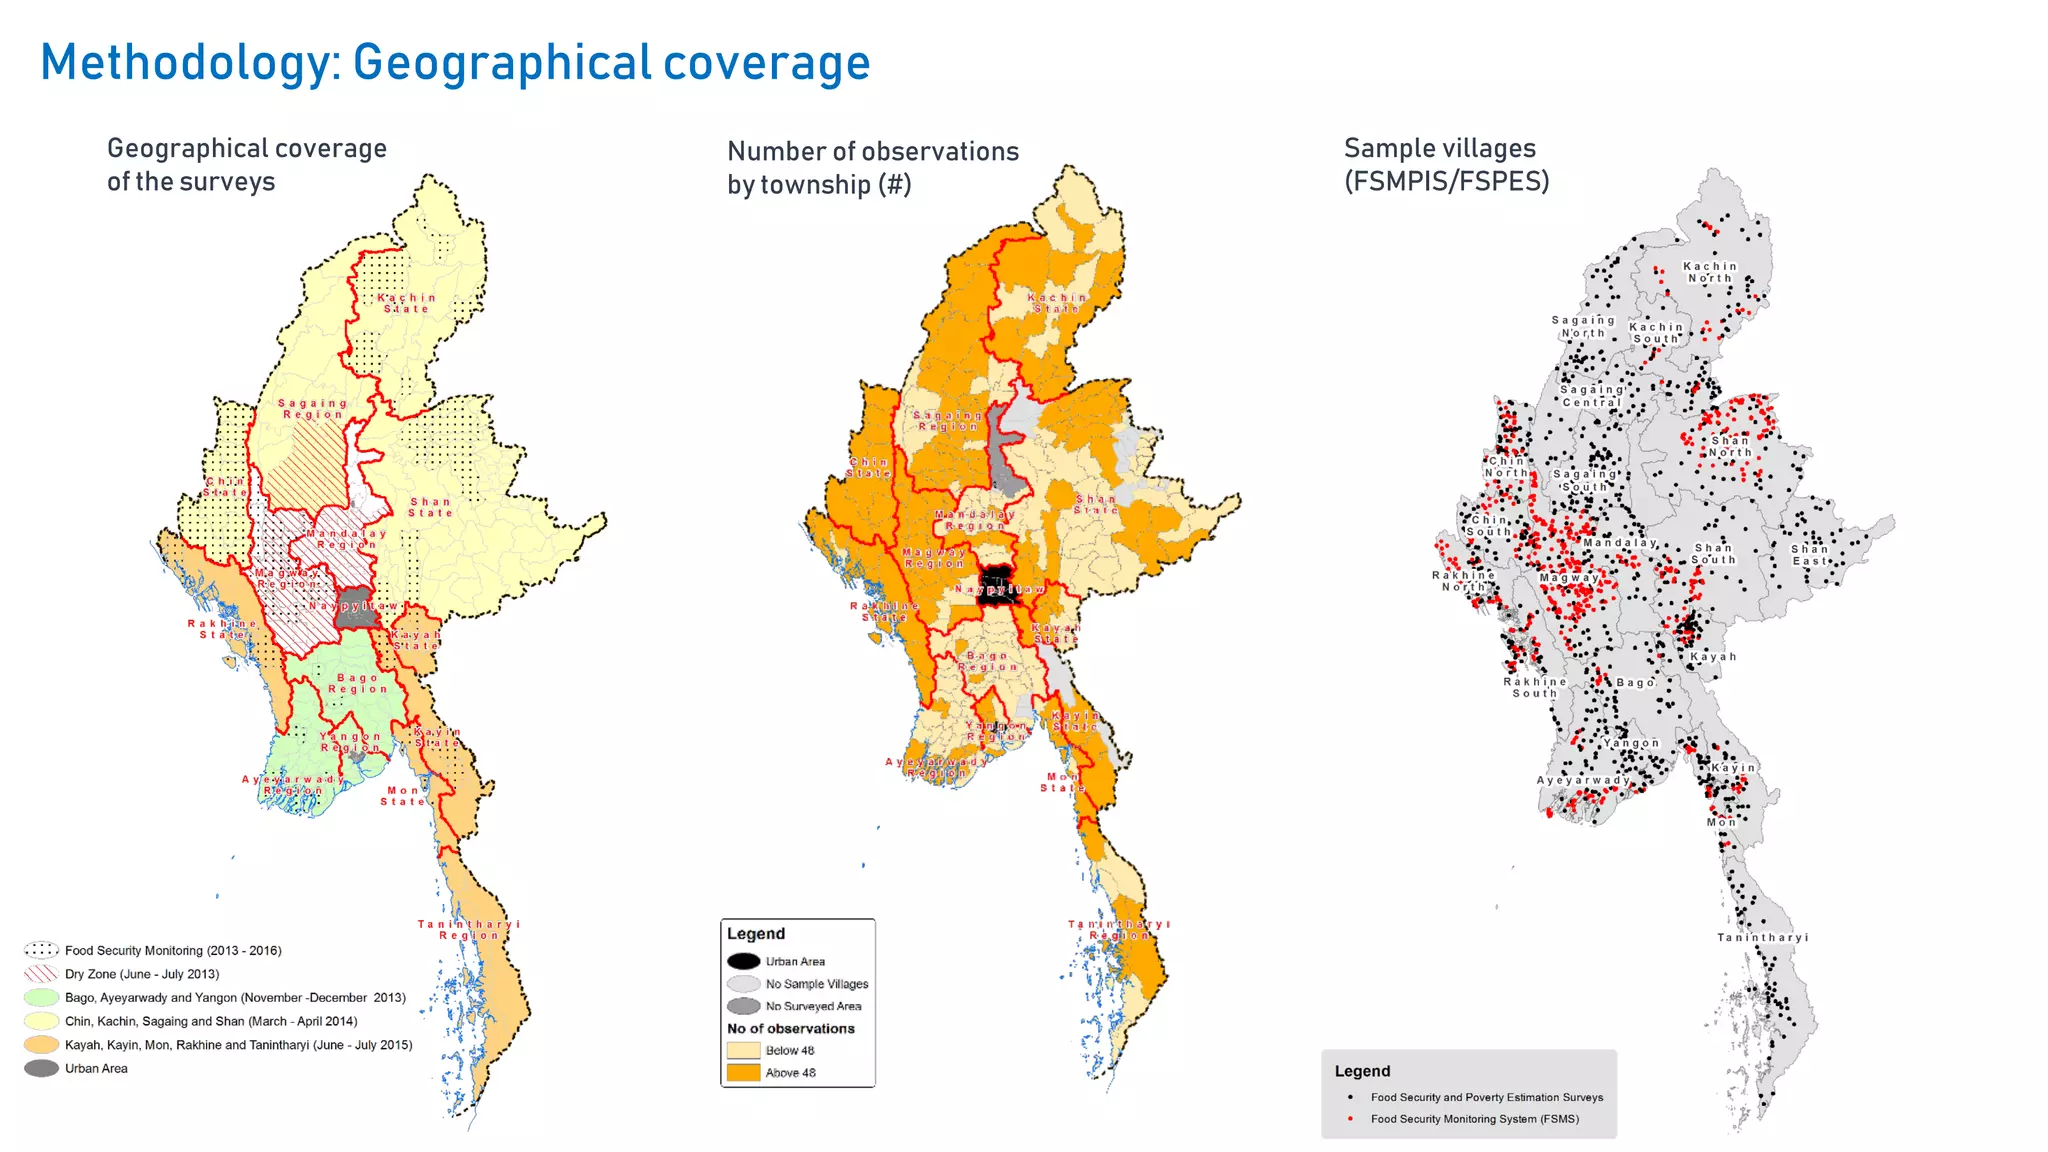


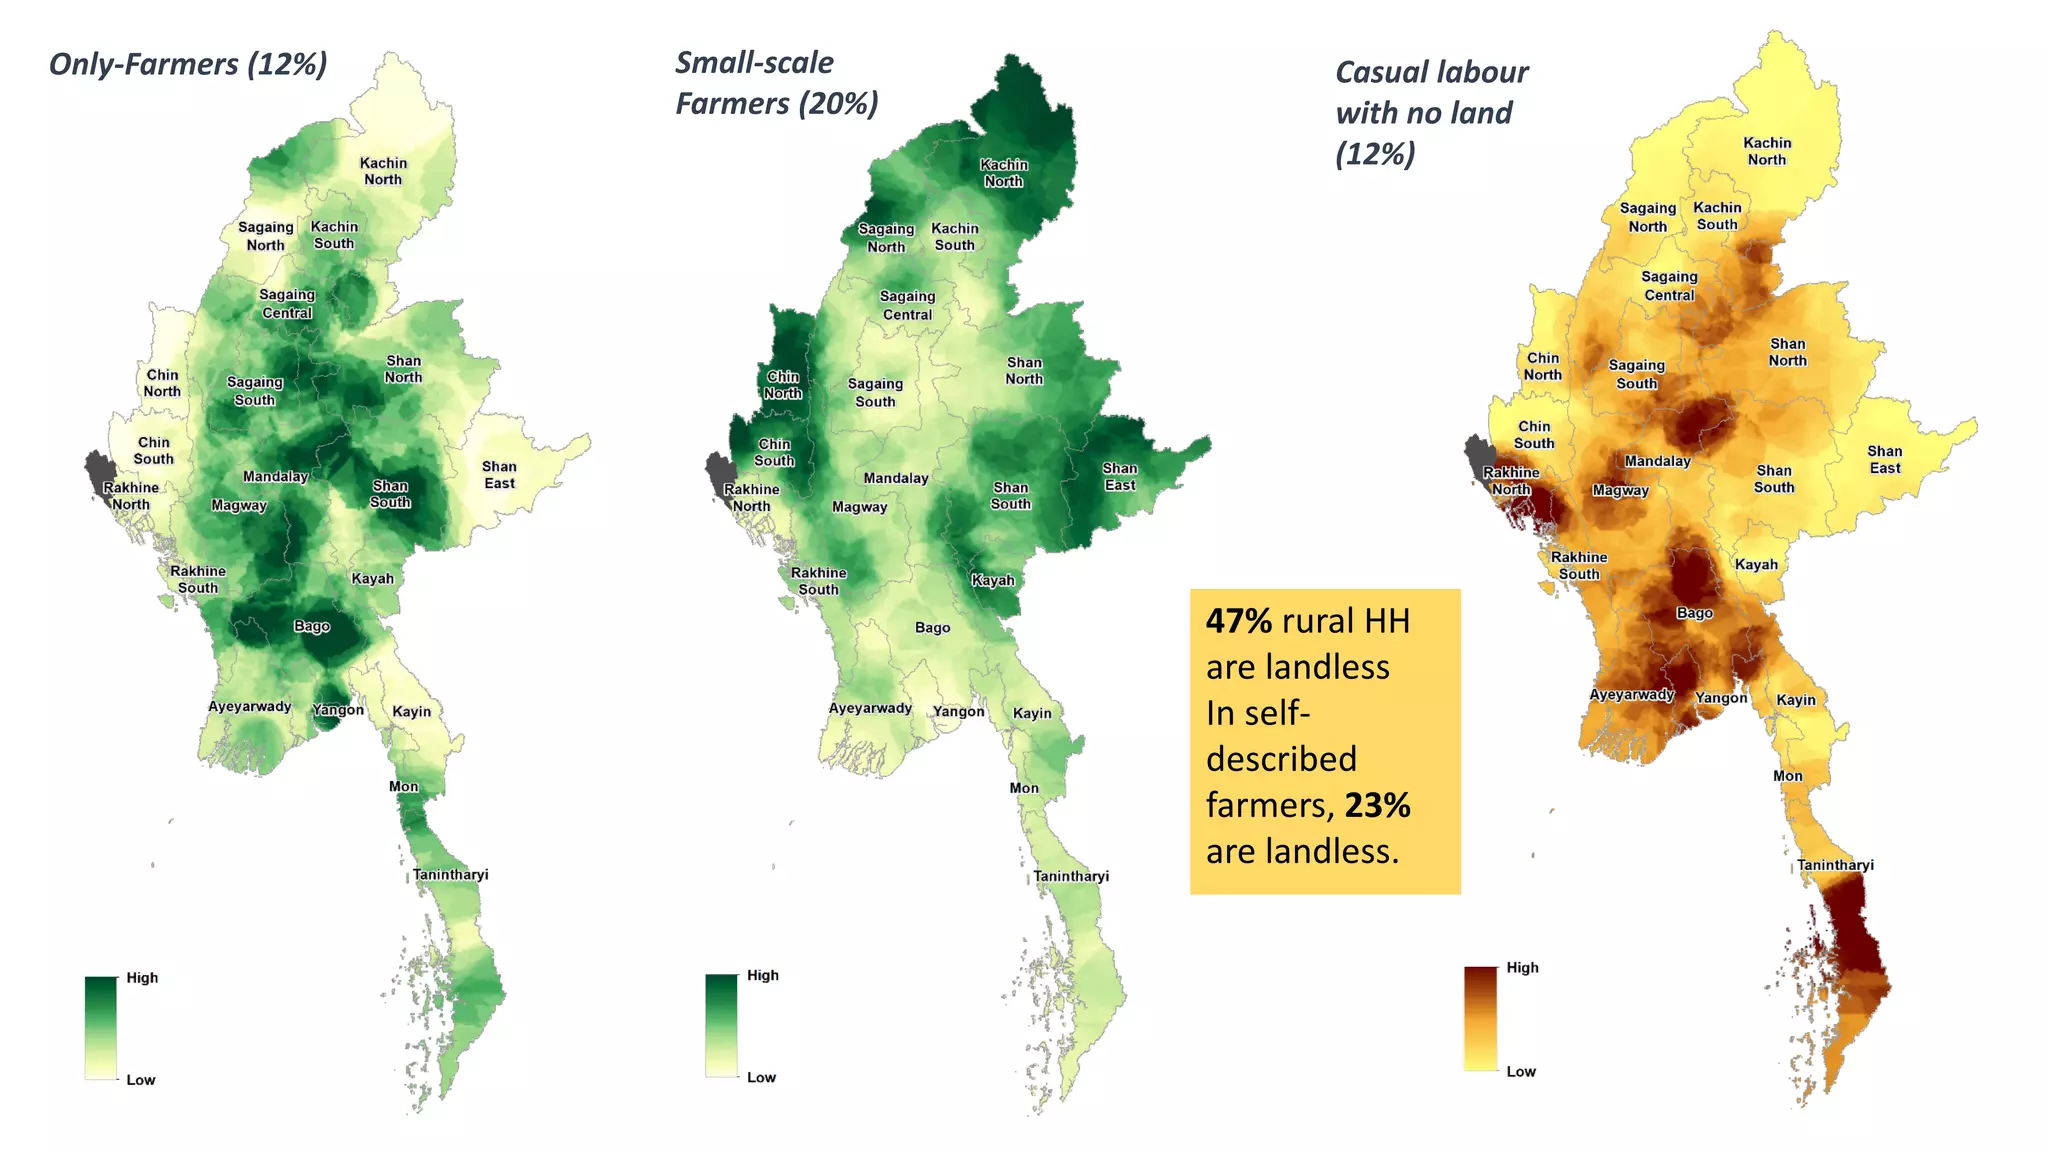


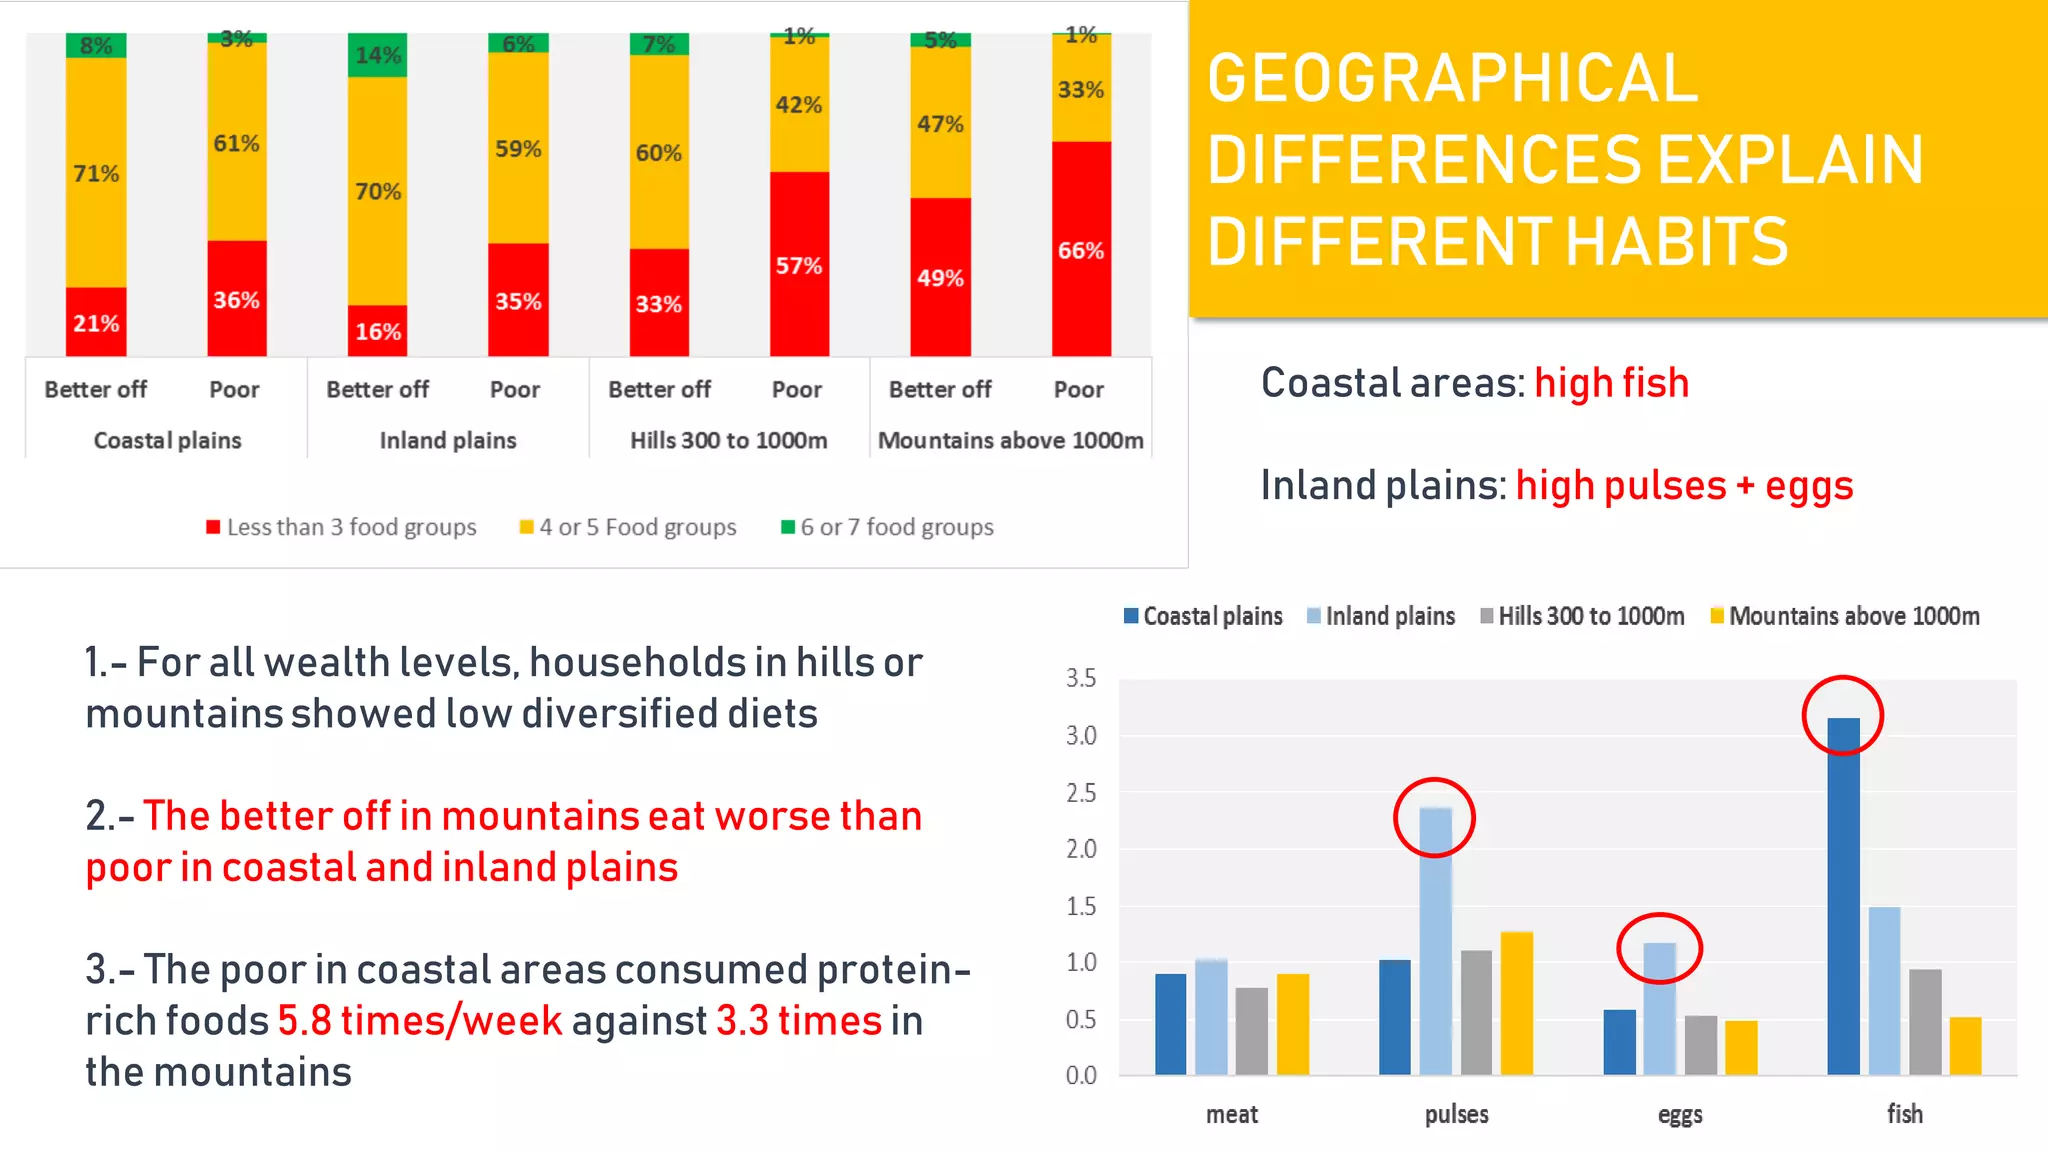

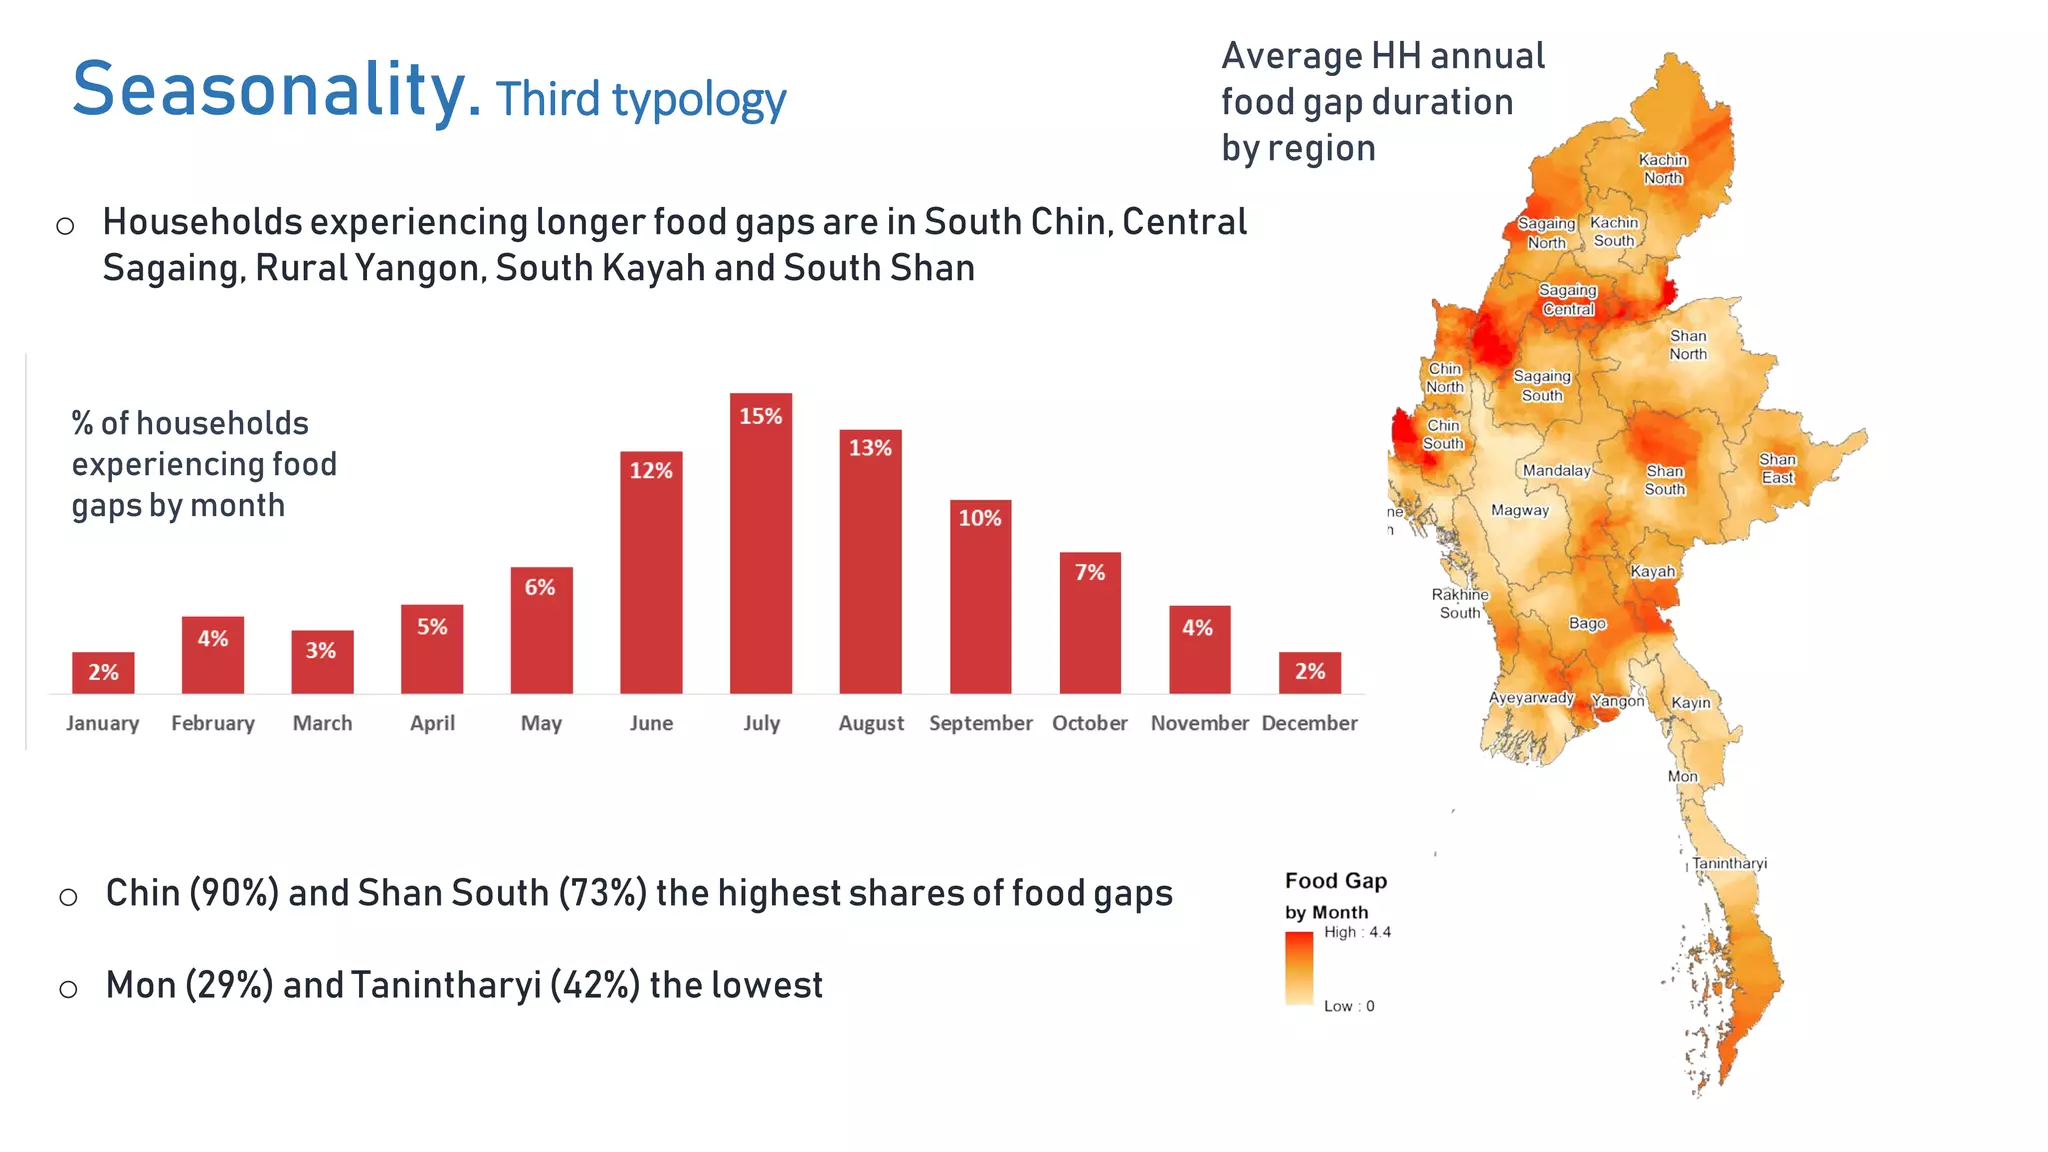
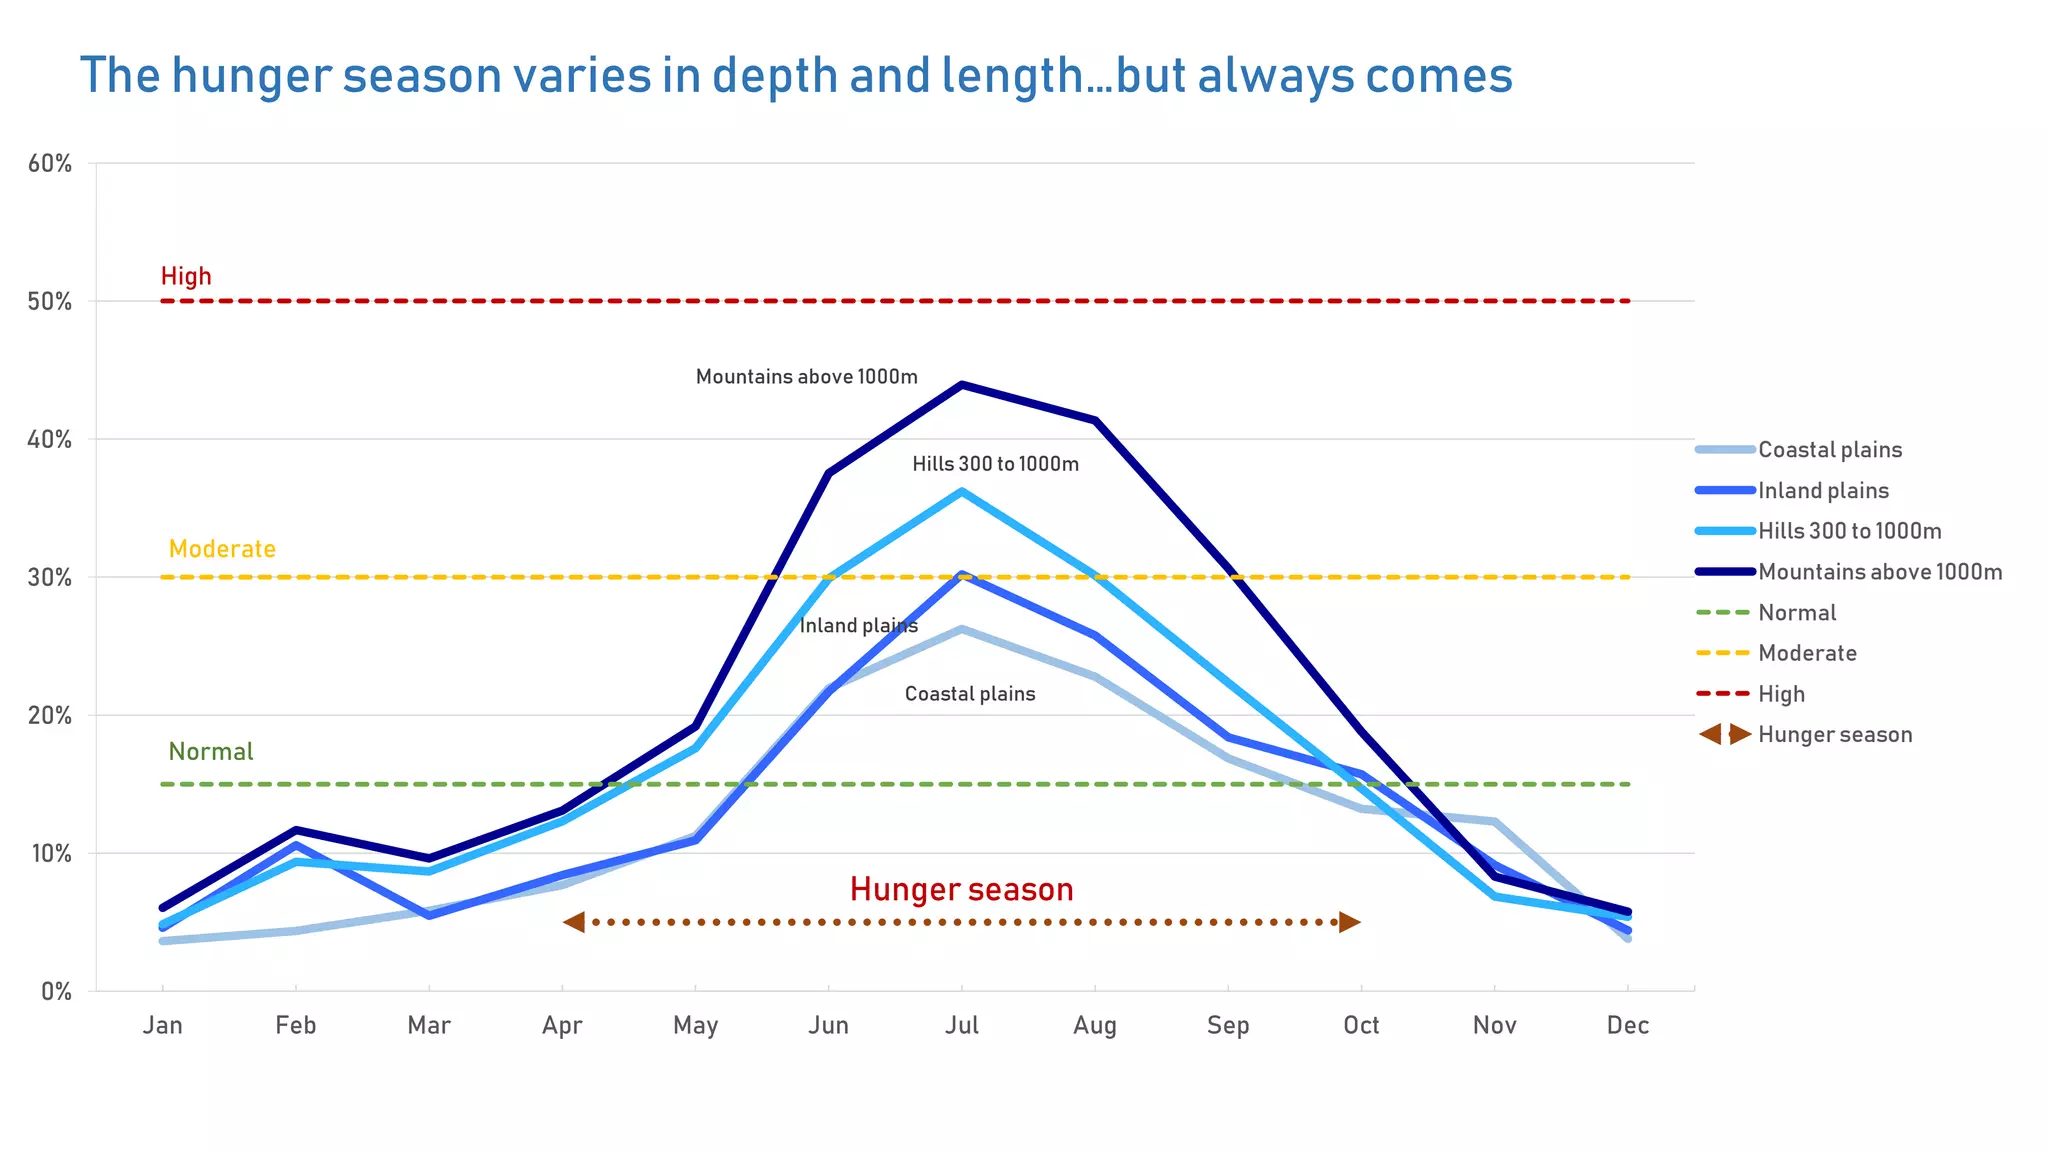


The document analyzes food insecurity and rural diets in Myanmar, utilizing extensive surveys from over 27,000 households conducted between 2013 and 2017. It highlights the significant cost disparity between nutritious and energy-only diets, with many households unable to afford the former, particularly in mountainous and coastal regions. Additionally, it identifies various factors influencing food insecurity, including agricultural practices, seasonality, and socio-economic conditions, while emphasizing the need for policy recommendations tailored to the unique characteristics of different regions.


