Download as PDF, PPTX

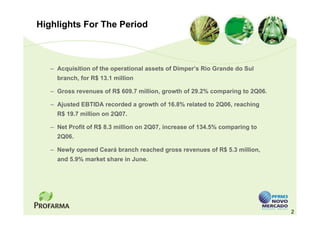
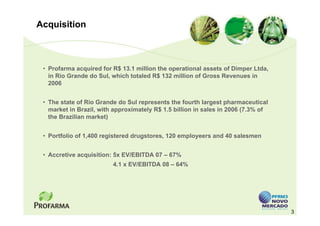
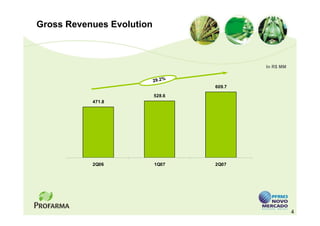
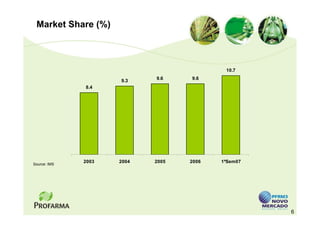
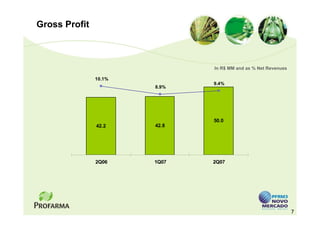
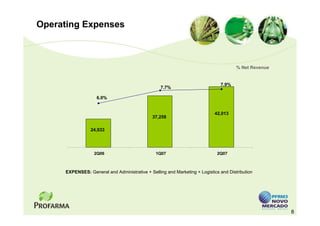
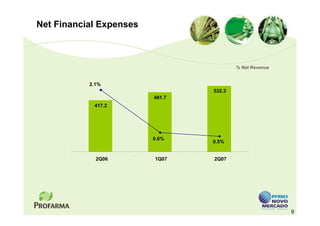
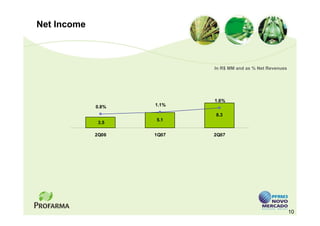
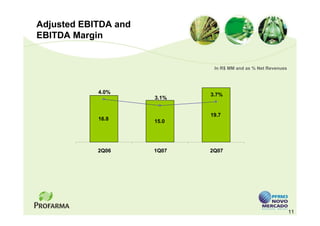

This earnings release from Profarma highlights their financial results for the second quarter of 2007, including revenue growth of 29.2% and net profit growth of 134.5%. A key event was the acquisition of Dimper's assets in Rio Grande do Sul for R$13.1 million, expanding their market share. Adjusted EBITDA grew 16.8% and their new Ceará branch achieved 5.9% market share, contributing to continued financial performance.


