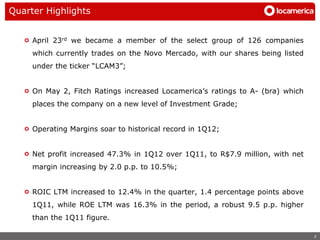
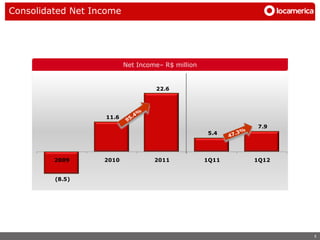
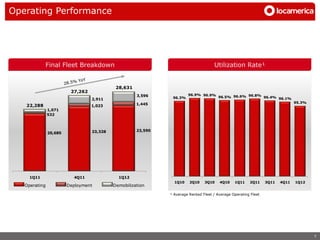
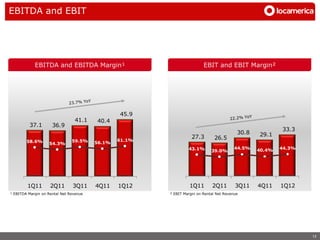
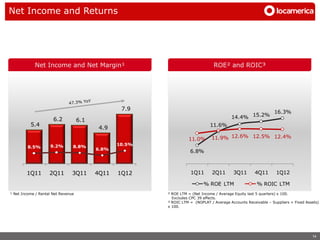
1. Locamerica reported record operating margins and a 47.3% increase in net profit in 1Q12 compared to 1Q11.
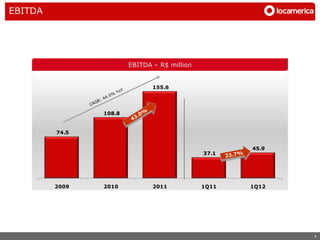
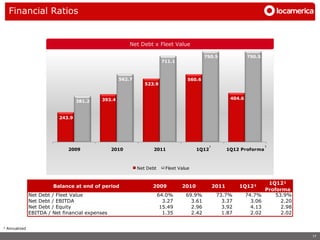
2. Key financial metrics like ROIC, ROE, and EBITDA margins increased significantly from strong performance.
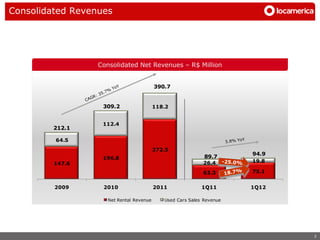
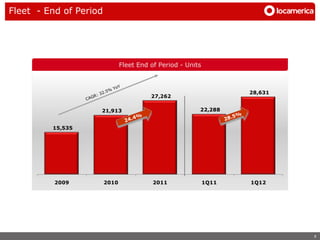
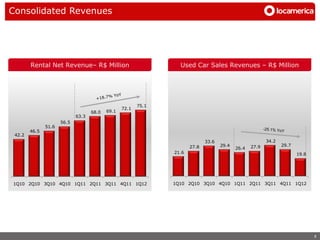
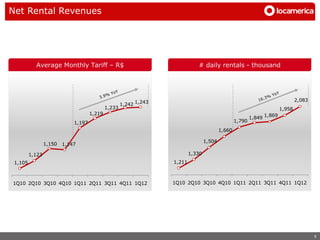
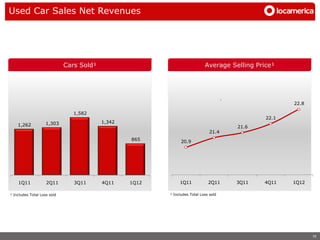
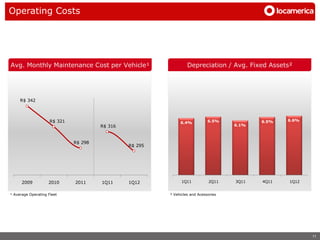
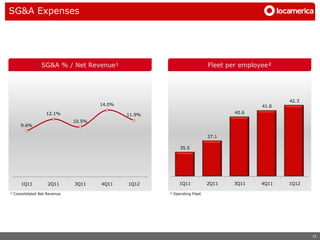
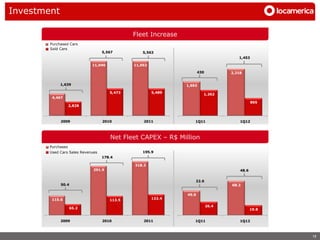
3. Revenues increased due to growth in the rental fleet size and daily rentals, while operating costs were well controlled.