Download to read offline


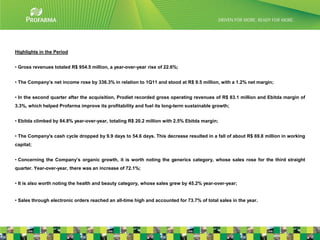


Profarma reported financial results for the first quarter of 2012, with the following highlights: - Gross revenues increased 22.6% year-over-year to R$954.5 million. - Net income increased 336.3% year-over-year to R$9.5 million, with a net margin of 1.2%. - EBITDA increased 84.8% year-over-year to R$20.2 million, with an EBITDA margin of 2.5%.


