Highlights For ThePeriod
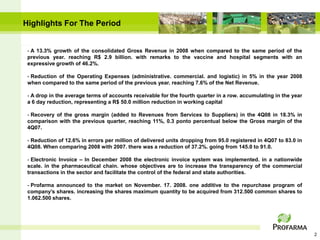
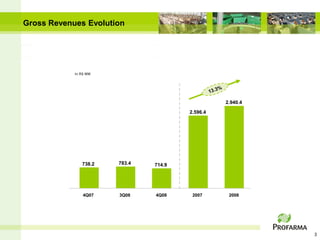
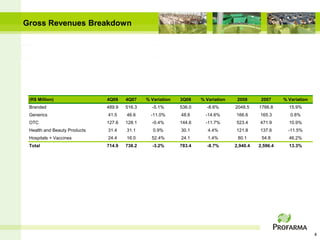
- A 13.3% growth of the consolidated Gross Revenue in 2008 when compared to the same period of the
previous year. reaching R$ 2.9 billion. with remarks to the vaccine and hospital segments with an
expressive growth of 46.2%.
- Reduction of the Operating Expenses (administrative. commercial. and logistic) in 5% in the year 2008
when compared to the same period of the previous year. reaching 7.6% of the Net Revenue.
- A drop in the average terms of accounts receivable for the fourth quarter in a row. accumulating in the year
a 6 day reduction, representing a R$ 50.0 million reduction in working capital
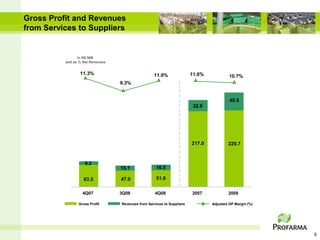
- Recovery of the gross margin (added to Revenues from Services to Suppliers) in the 4Q08 in 18.3% in
comparison with the previous quarter, reaching 11%, 0.3 ponto percentual below the Gross margin of the
4Q07.
- Reduction of 12.6% in errors per million of delivered units dropping from 95.0 registered in 4Q07 to 83.0 in
4Q08. When comparing 2008 with 2007. there was a reduction of 37.2%. going from 145.0 to 91.0.
- Electronic Invoice – In December 2008 the electronic invoice system was implemented. in a nationwide
scale. in the pharmaceutical chain. whose objectives are to increase the transparency of the commercial
transactions in the sector and facilitate the control of the federal and state authorities.
- Profarma announced to the market on November. 17. 2008. one additive to the repurchase program of
company’s shares. increasing the shares maximum quantity to be acquired from 312.500 common shares to
1.062.500 shares.
2
Gross Profit andRevenues
from Services to Suppliers
In R$ MM
and as % Net Revenues
11.3% 11.0% 11.0% 10.7%
9.3%
49.5
32.8
217.0 220.7
9.2
15.1 16.5
63.5 47.0 51.0
4Q07 3Q08 4Q08 2007 2008
Gross Profit Revenues from Services to Suppliers Adjusted GP Margin (%)
6
7.
Operating Expenses
In R$ MM
and as % Net Revenues
8.4%
7.9% 8.0%
7.6%
7.0%
193.6
181.8
53.9
46.7 48.1
4Q07 3Q08 4Q08 2007 2008
EXPENSES: General and Administrative + Selling and Marketing + Logistics and Distribution
7
8.
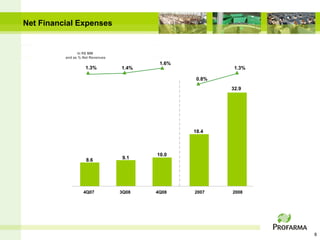
Net Financial Expenses
In R$ MM
and as % Net Revenues
1.6%
1.3% 1.4% 1.3%
0.8%
32.9
18.4
10.0
8.6 9.1
4Q07 3Q08 4Q08 2007 2008
8
9.
Net Income
In R$ MM
and as % Net Revenues
2.6%
2.1%
1.2%
1.1%
0.7% 47.0
31.6
16.9
6.5
5.0
4Q07 3Q08 4Q08 2007 2008
9
10.
Adjusted EBITDA
and EBITDAMargin
In R$ MM
and as % Net Revenues
3.9%
3.5% 3.5%
3.1%
2.3%
80.1 78.7
25.2
21.5
15.5
4Q07 3Q08 4Q08 2007 2008
10
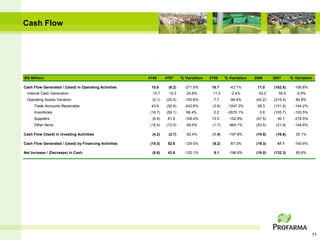
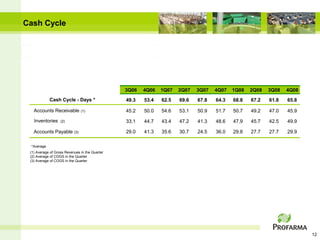
Cash Cycle
3Q06 4Q06 1Q07 2Q07 3Q07 4Q07 1Q08 2Q08 3Q08 4Q08
Cash Cycle - Days * 49.3 53.4 62.5 69.6 67.8 64.3 68.8 67.2 61.8 65.8
Accounts Receivable (1) 45.2 50.0 54.6 53.1 50.9 51.7 50.7 49.2 47.0 45.9
Inventories (2) 33.1 44.7 43.4 47.2 41.3 48.6 47.9 45.7 42.5 49.9
Accounts Payable (3) 29.0 41.3 35.6 30.7 24.5 36.0 29.8 27.7 27.7 29.9
*Average
(1) Average of Gross Revenues in the Quarter
(2) Average of COGS in the Quarter
(3) Average of COGS in the Quarter
12
13.
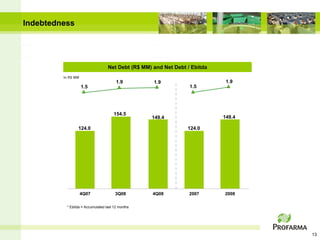
Indebtedness
Net Debt (R$ MM) and Net Debt / Ebitda
In R$ MM
1.9 1.9 1.9
1.5 1.5
154.5
149.4 149.4
124.0 124.0
4Q07 3Q08 4Q08 2007 2008
* Ebitda = Accumulated last 12 months
13
14.
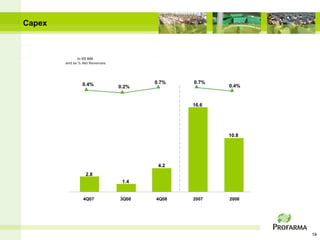
Capex
In R$ MM
and as % Net Revenues
0.4% 0.7% 0.7%
0.2% 0.4%
16.6
10.8
4.2
2.8
1.4
4Q07 3Q08 4Q08 2007 2008
14
15.
Operating Indicators
Service Level Logistics E.P.M
(units served / units requested) (Errors per Million)
145.0
91.7%
90.9% 91.3%
90.8%
90.2% 95.0 91.0
86.0 83.0
4Q07 3Q08 4Q08 2007 2008 4Q07 3Q08 4Q08 2007 2008
15
16.
25
-o
15
25
35
45
55
65
75
85
95
105
115
125
135
145
155
165
175
185
u
9- t
no
24 v
-n
o
9- v
d
24 ez
-d
ez
8-
ja
23 n
-ja
n
7-
fe
22 v
-fe
9- v
m
24 ar
-m
a
8- r
ab
23 r
-a
b
Share Performance
8- r
m
23 ai
-m
a
7- i
ju
22 n
-ju
n
* 100 pts basis on 26/oct/2006
7-
ju
22 l
-ju
6- l
a
21 go
-a
go
5-
se
20 t
-s
e
5- t
ou
20 t
-o
u
4- t
n
19 ov
-n
o
Ibovespa
4- v
de
19 z
-d
ez
3-
ja
18 n
-ja
n
2-
fe
Profarma
17 v
-fe
3- v
m
18 ar
-m
a
2- r
ab
17 r
-a
b
2- r
m
17 ai
-m
a
1- i
ju
16 n
-ju
n
1-
ju
16 l
-ju
31 l
-
15 jul
-a
30 go
-a
g
14 o
-s
29 et
-s
14 et
-o
29 ut
-o
13 ut
-n
28 ov
-n
13 ov
-d
28 ez
-d
ez
16
17.
IR Contacts
Max Fischer
CFO and IR Director
Beatriz Diez
IR Coordenator
Telephone.: 55 (21) 4009 0276
E-mail: ri@profarma.com.br
www.profarma.com.br/ir