This document provides an overview of production theory, including:
1. It defines production as the transformation of inputs (capital, labor, etc.) into outputs (goods and services) and discusses technical vs. economic efficiency.
2. It introduces the concepts of economic efficiency (lowest cost to produce output) and technological efficiency (cannot increase output without increasing inputs).
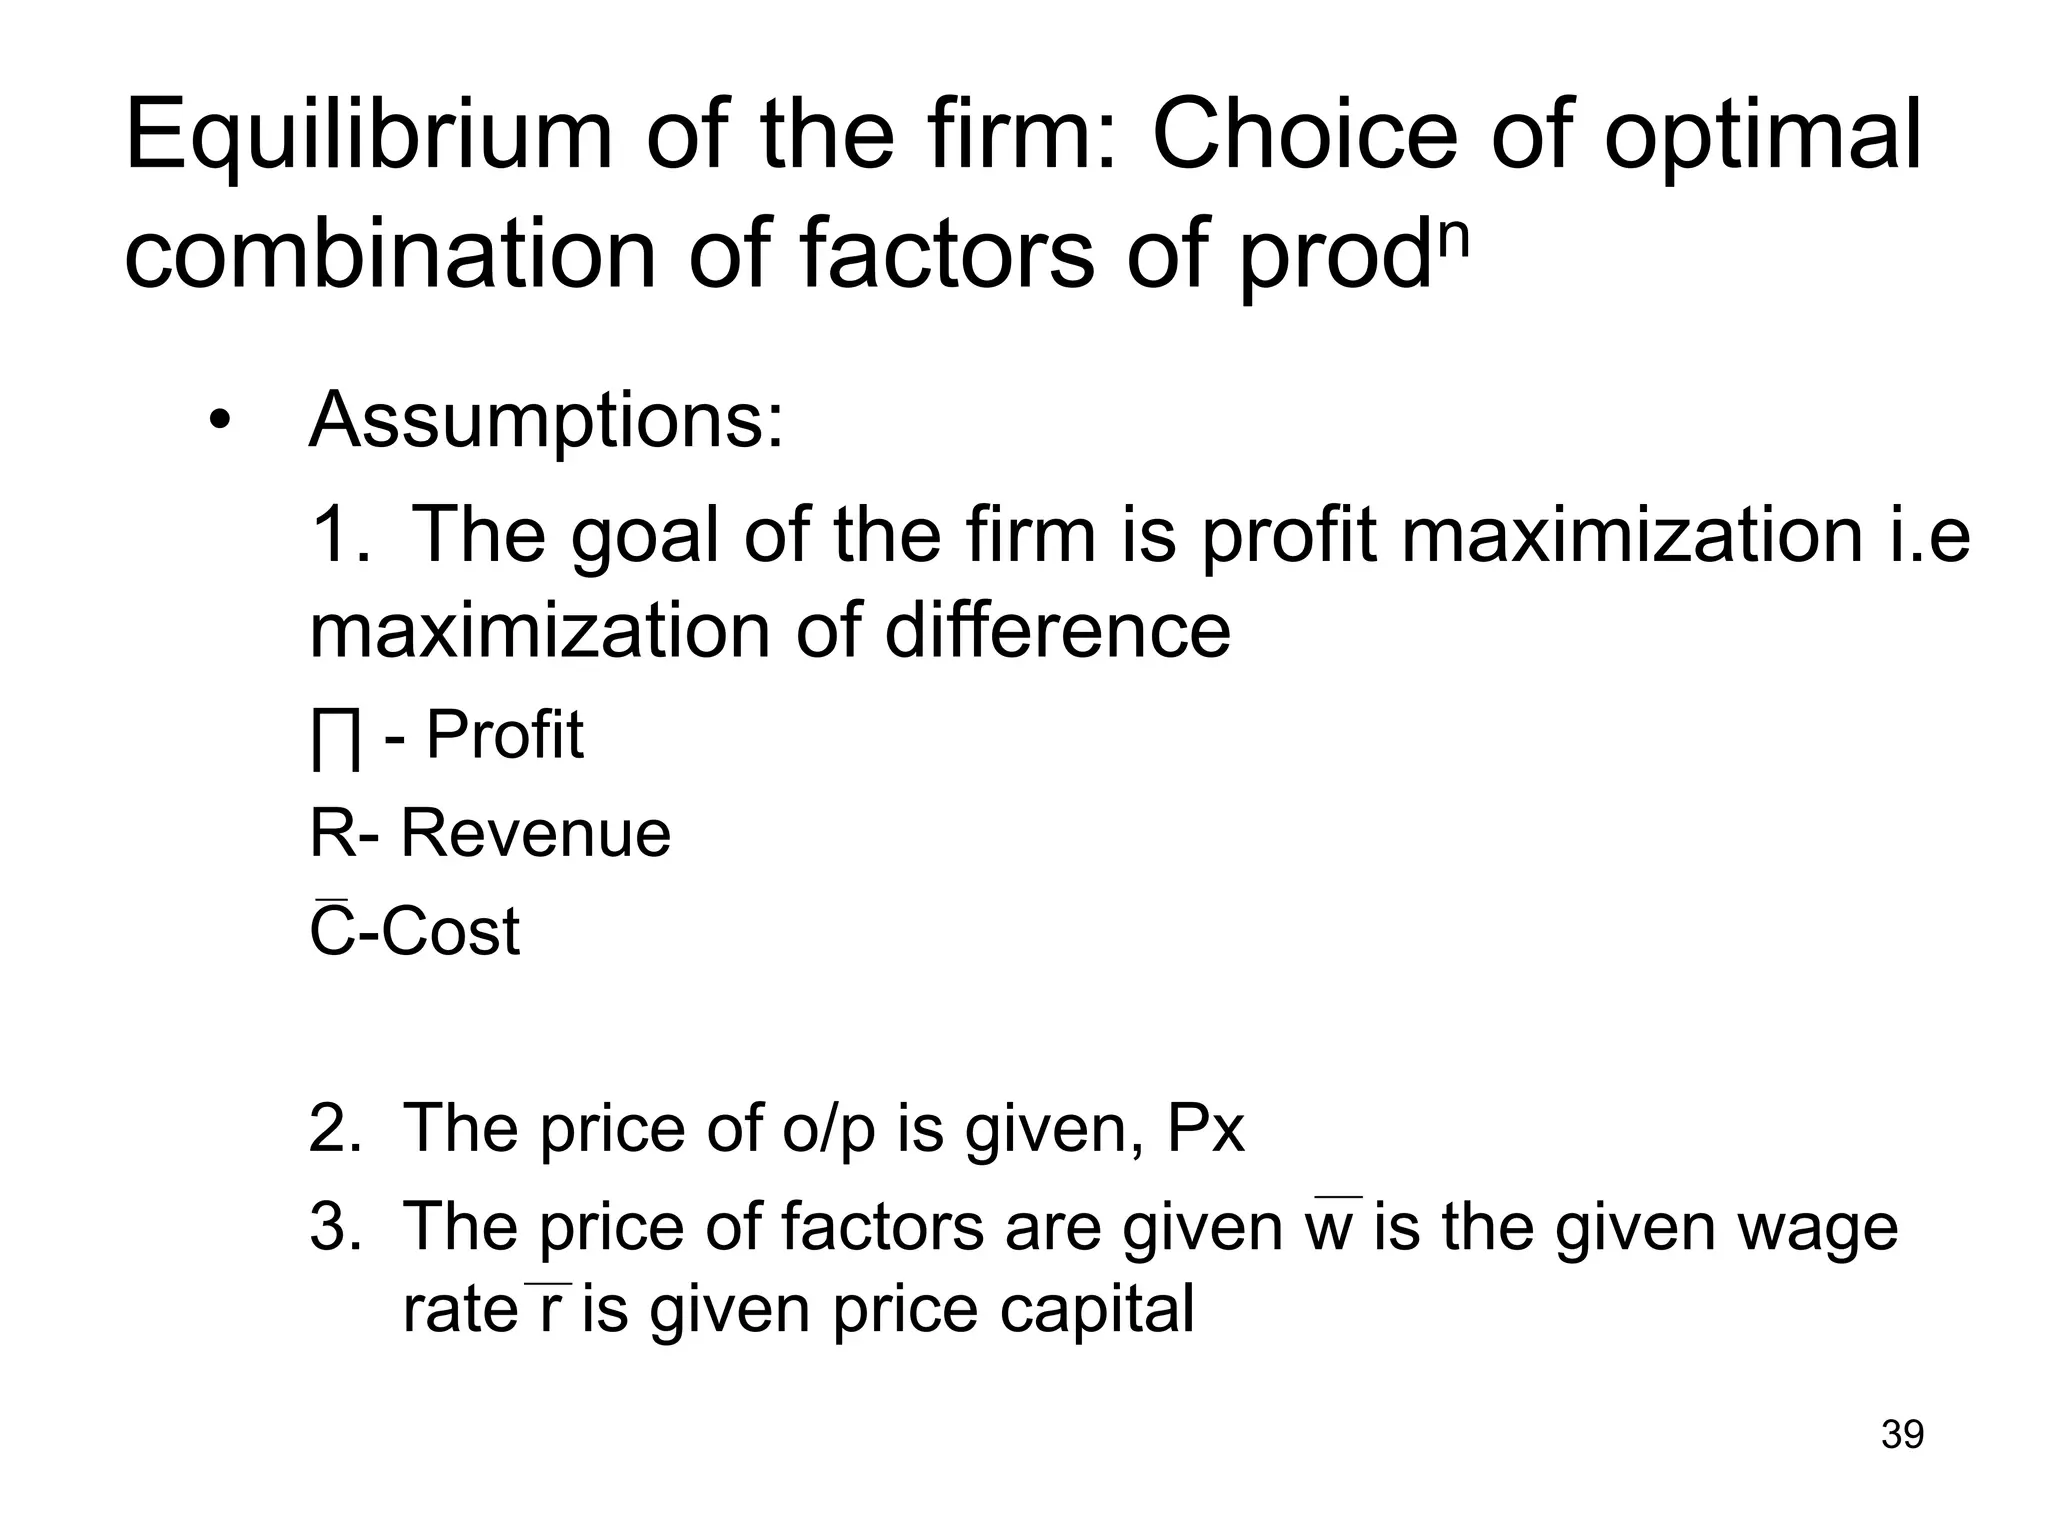
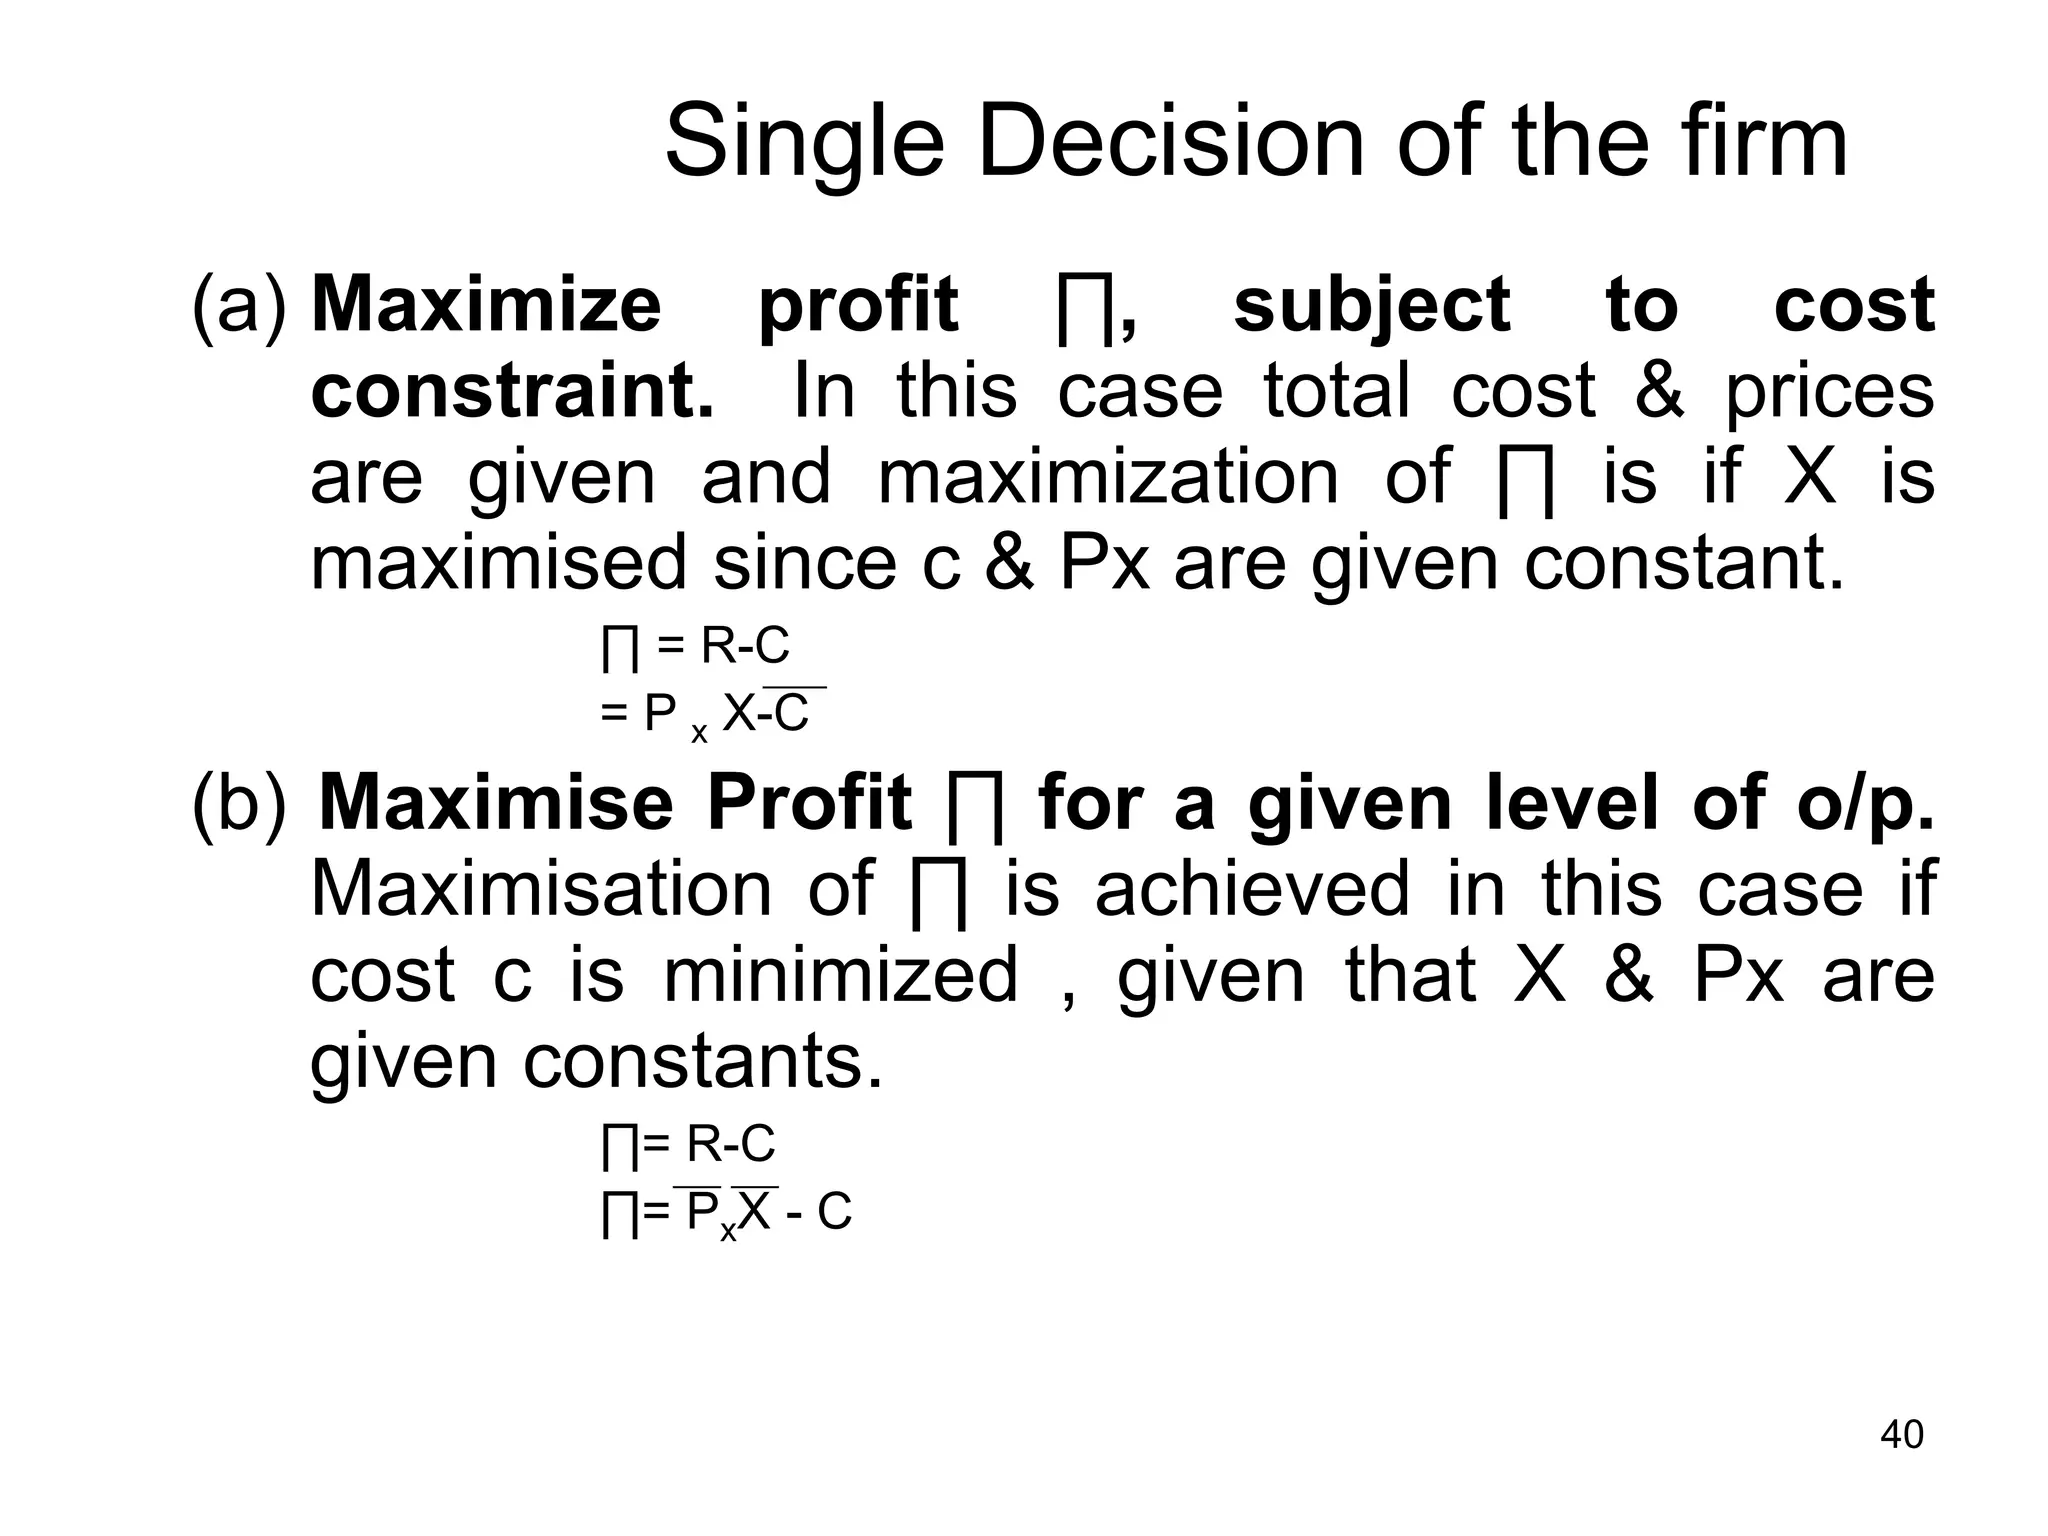
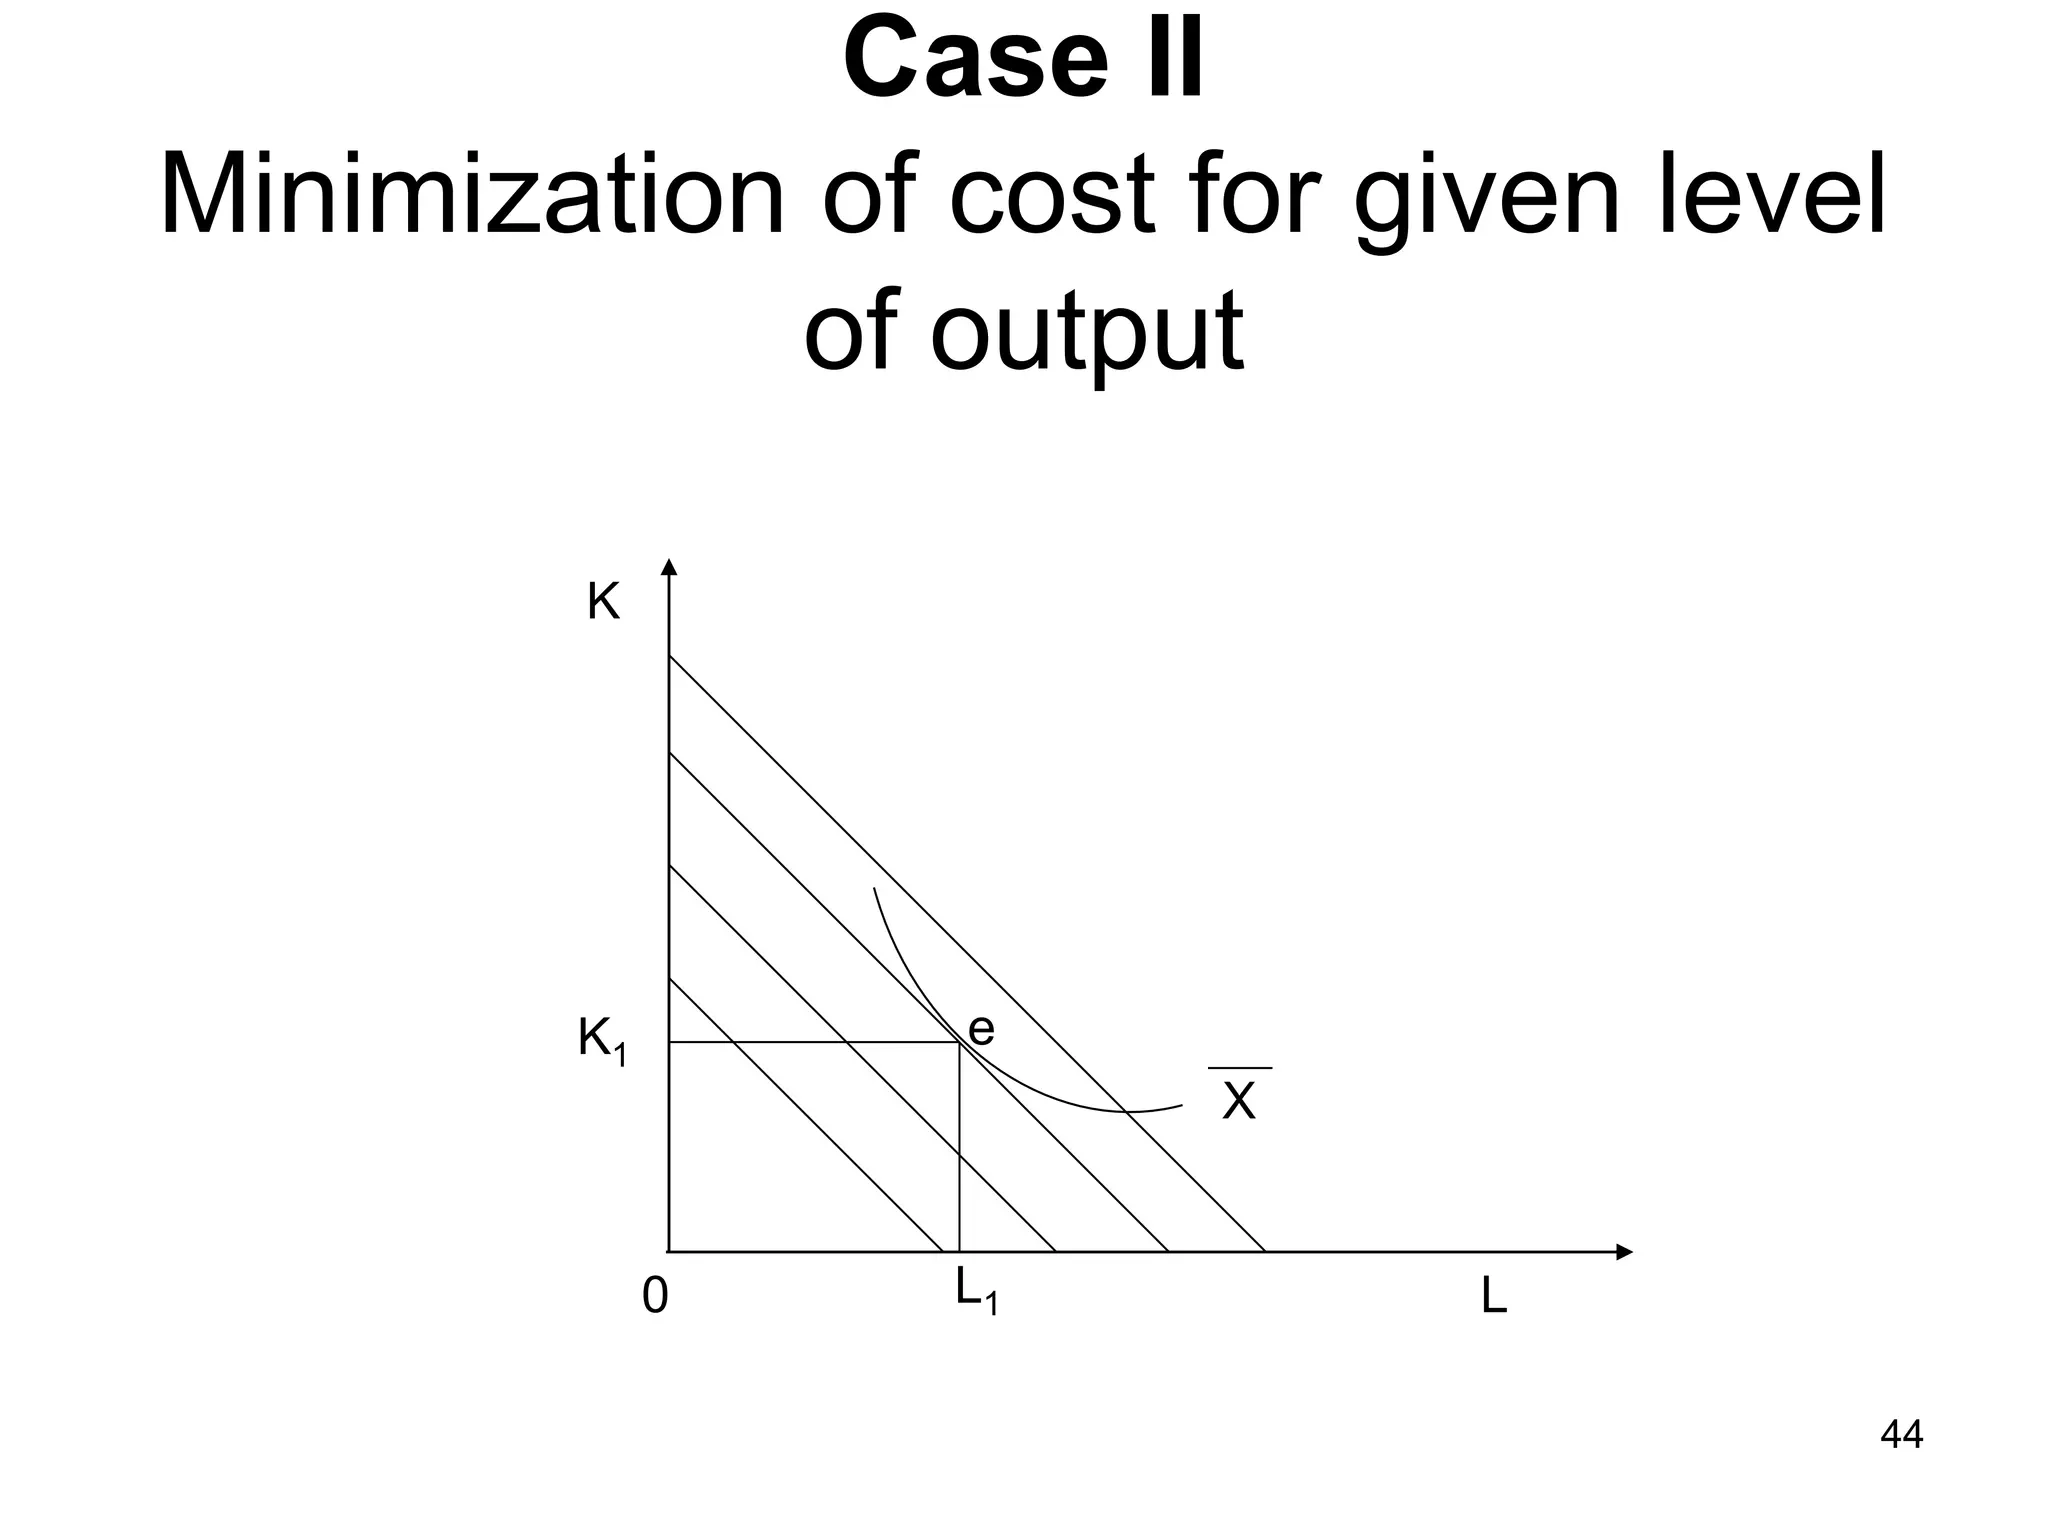
3. It explains that production theory applies the principles of constrained optimization, where firms aim to minimize costs or maximize output given constraints. This leads to the same rule for allocating inputs and technology choice.
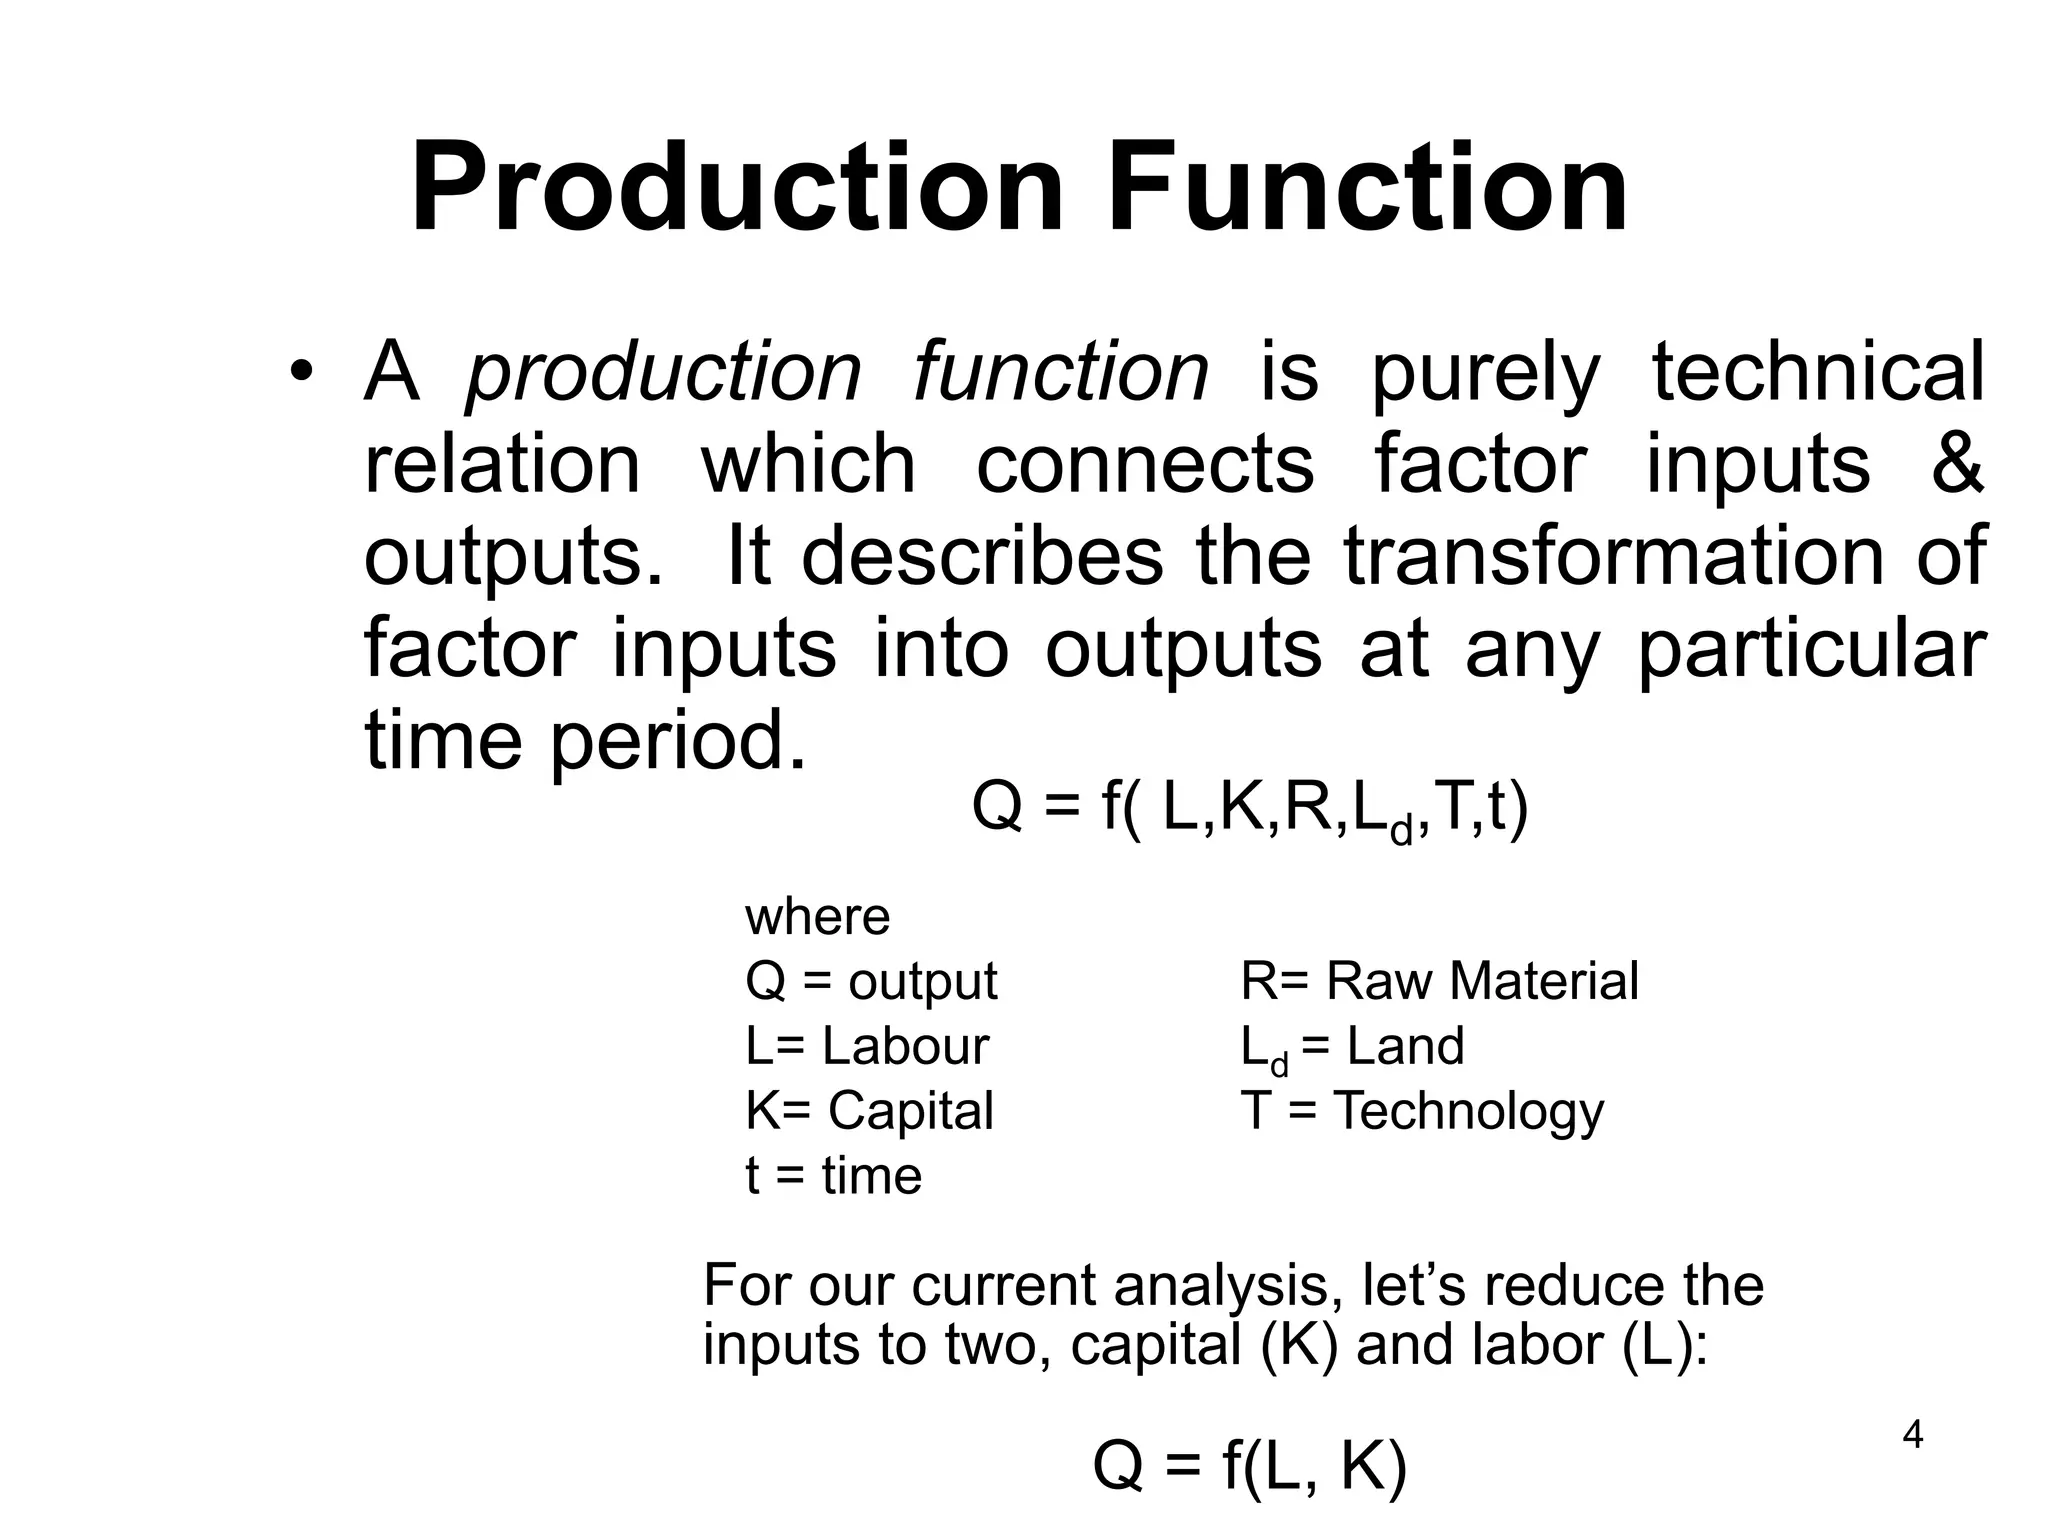
4. It provides examples and explanations of key production concepts like production functions, production tables, short-run vs. long-run production,
1. A production function shows the maximum output that can be produced from a given set of inputs over a period of time. It can be expressed as an equation, table, or graph.
2. The Cobb-Douglas production function is an important example that was formulated by Paul Douglas and Charles Cobb. It expresses output as a power function of labor and capital inputs.
3. The law of variable proportions states that as one variable input is increased, initially average and marginal products will increase until diminishing returns set in, after which average and marginal products will decrease.
1. The document outlines concepts related to production including production functions, efficiency, law of diminishing returns, short-run and long-run production, isoquants, and returns to scale. It provides examples and cases to illustrate these concepts.
2. Key concepts discussed include the production function relating inputs like capital, labor, and land to output. The law of diminishing returns states that adding more of a variable input while holding others fixed initially increases output at a decreasing rate.
3. Isoquants illustrate combinations of inputs that produce the same output level, and the marginal rate of technical substitution measures how inputs can be substituted in production. The document also discusses short-run and long-run analysis and
The document discusses key concepts from microeconomics relating to the theory of the firm, including:
1) It introduces the concept of a firm as an economic agent that uses inputs like labor and capital to produce outputs, and aims to minimize costs and maximize profits.
2) It covers production functions and the relationship between inputs and outputs, explaining concepts like marginal product, average product, and the law of diminishing returns.
3) It discusses isoquants as curves showing combinations of inputs that produce the same output level, and the marginal rate of technical substitution.
4) It examines returns to scale and how output changes as multiple inputs change together, as well as special production functions and technological progress.
This document discusses production functions and the laws of production. It defines production as the transformation of inputs into outputs of goods and services. There are two types of production functions - fixed and variable proportions. The law of variable proportions describes the relationship between varying input levels and output in the short run when one input is variable. Diminishing marginal returns typically occur as more of the variable input is added due to scarcity of the fixed inputs. Isoquants illustrate combinations of two variable inputs that produce the same output level.
The document discusses the theory of production, cost, and break-even analysis. It begins by defining production as the transformation of inputs into outputs. It then discusses the production function, which represents the relationship between inputs and outputs. The document outlines different types of production functions including the Cobb-Douglas, Leontief, and CES functions. It also covers the laws of variable proportions and returns to scale. Finally, it defines key cost concepts and the cost-output relationship.
The document discusses production concepts and cost analysis, including:
- Production functions show the relationship between inputs and outputs. Common types include Cobb-Douglas, CES, and Leontief functions.
- Total, average, and marginal products are defined for analyzing how output changes with variable inputs like labor.
- Short-run and long-run periods are distinguished based on whether inputs are fixed or variable.
- Isoquants and isocost lines are introduced to explain the concept of producer equilibrium between inputs.
Cost & Production Analysis For MBA Students.pptaviatordevendra
This document discusses key concepts related to production and cost analysis. It defines inputs, fixed and variable inputs, production functions, total product, average product, marginal product, and the law of diminishing marginal returns. It also covers production in the short run and long run, including isoquants, marginal rate of technical substitution, and returns to scale. The document analyzes costs including fixed, variable, and total costs. It discusses average and marginal costs, breakeven analysis, and economies of scale. Finally, it covers long run cost relationships including long run total cost, average cost, and marginal cost curves.
The document discusses key concepts related to production functions:
1. A production function specifies the optimal input combinations needed to produce a given output level, and depends on industry and technology.
2. Producers must determine production levels, capacity, input combinations, and prices to maximize profits and minimize costs.
3. Isoquants illustrate the different combinations of inputs that produce the same output amount, and become curved as substitutability decreases.
4. Marginal product and returns to scale analysis helps producers optimize input use in the stages of increasing, constant, and diminishing returns.
The document discusses theories of production, including:
1. It defines production function and outlines concepts like inputs, outputs, fixed vs variable inputs, and short vs long run.
2. It summarizes the law of variable proportions and returns to scale, and how they relate to costs via concepts like economies and diseconomies of scale.
3. It provides an overview of oligopoly market structure and models for price and output determination under conditions like collusion, price leadership, and kinked demand curves.
This document discusses production economics concepts including short-run and long-run production functions, marginal product, average product, returns to scale, and cost minimization. It provides examples of production functions, calculates elasticities of output, and discusses estimating production functions from data. Managers must choose production methods to minimize costs while economists use tools like production functions to evaluate efficiency.
This document discusses production functions and their properties. It begins by defining a production function as relating the maximum output that can be produced from a given set of inputs. It then discusses short-run and long-run production functions, the properties of average and marginal product, diminishing returns, and how to determine the optimal input mix by equalizing marginal products per dollar spent on each input. It also introduces Cobb-Douglas production functions and the concept of returns to scale.
This document discusses production and cost analysis concepts from a managerial economics textbook chapter. It defines key terms like total, average and marginal product, isoquants, isocosts, and different cost functions. It explains how firms determine optimal input levels by equalizing the value of marginal products with input prices to minimize costs. Firms produce at the point where the marginal rate of technical substitution equals the input price ratio. Cost functions are important for analyzing profit-maximizing behavior.
The document discusses production functions and the relationship between inputs and outputs. It defines key terms like production function, total productivity, average productivity, marginal productivity, short run vs long run production, returns to scale, isoquants, isocost lines, and the expansion path. The production function indicates the maximum output possible given inputs and technology. Inputs and their marginal products are illustrated graphically.
This document discusses production functions and the factors that influence them. It defines key concepts like total product, average product, marginal product, and different types of production functions.
The short-run production function, known as the law of variable proportions, describes how output changes as one input varies while others are held fixed. It outlines the three stages of increasing, decreasing, and negative returns. The long-run production function examines how output changes as all inputs vary, governed by laws of returns to scale. Constant, increasing, and decreasing returns to scale are defined. Isoquants and the marginal rate of technical substitution are also explained. The document concludes by discussing how production functions inform managerial decision making.
The document discusses key concepts related to production and returns to scale. It can be summarized as follows:
1. Production involves using factors of production like labor, capital, land, and raw materials to transform inputs into outputs. The relationship between inputs and outputs is represented by production functions.
2. In the short run, at least one factor is fixed while others can vary. This relationship is explained by the law of variable proportions, which outlines three stages of production - increasing, constant, and diminishing returns.
3. In the long run, all factors are variable. The behavior of output with changes in all inputs is known as returns to scale and can exhibit increasing, constant, or diminishing returns depending
This document provides an introduction to production concepts and analysis. It defines key terms like production function, inputs, outputs, isoquants, and marginal rate of technical substitution.
The production function expresses the relationship between various inputs (like labor, capital, land) and the level of output. Isoquants show the different combinations of two inputs (like labor and capital) that can produce the same level of output. The marginal rate of technical substitution measures how much one input must be reduced to compensate for an increase in another input while maintaining the same output level.
The document also discusses measures of production like total, average, and marginal products and how they are used to analyze changes in output from changes in a
The document discusses production functions and costs. It defines key concepts such as production functions, isoquants, returns to scale, fixed costs, variable costs, marginal costs, average costs, and opportunity costs. It provides examples and graphs to illustrate these concepts, including how marginal product and costs change with different levels of input. Production functions can take different forms depending on factor substitutability and returns to scale. Costs are classified as fixed, variable, marginal, average, accounting and economic. Opportunity costs should be considered rather than sunk costs in decision making.
Production Function is a statement of the relationship between a firm’s scarce resources (inputs) and the output that results from the use of these resources.
In mathematical terms, the PF can be expressed as:
Q= f (X1, X2…………Xk) where
Q=output, X1…………Xk=inputs used in the production process
This document defines production and costs, and discusses the theory of production and cost. It covers:
1) Definitions of production, inputs, production functions, and the relationship between inputs and output.
2) The characteristics of short-run and long-run production periods and production functions.
3) The measurement of total product, average product, and marginal product and how they relate at different stages of production.
4) Cost concepts including total, fixed, variable, marginal, average, and their relationships as depicted through cost curves.
The document discusses production functions and their key concepts. It defines a production function as the relationship between inputs and maximum output. It explains the three stages of production in the short-run and the law of diminishing returns. It also discusses optimal input usage, returns to scale, and the Cobb-Douglas production function.
This document discusses production functions and their types. It defines a production function as an equation, table, or graph that shows the maximum output a firm can produce from given inputs over a period of time. It identifies the key inputs as labor, capital, land, raw materials, and power. Fixed and variable inputs are explained, with fixed inputs remaining constant and variable inputs changing with output levels. The concepts of total, average, and marginal product are introduced. Different types of production functions are outlined, including fixed and variable proportion functions. The document also discusses production in the short run and long run. Isoquants and marginal rate of technical substitution are briefly explained.
production analysis by Neeraj Bhandari ( Surkhet.Nepal )Neeraj Bhandari
This document discusses key concepts in production analysis including the production possibility curve (PPC), inputs and outputs, fixed and variable inputs, and short and long run time periods. It also explains the production function and how total product, marginal product, and average product are determined by the quantity of labor input based on the law of variable proportions. Finally, it covers the different types of returns to scale including increasing, constant, and diminishing returns based on how total output changes with proportional increases in all factor inputs in the long run.
Production analysis by Neeraj Bhandari ( Surkhet.Nepal )Neeraj Bhandari
This document discusses key concepts in production analysis including the production possibility curve (PPC), inputs and outputs, fixed and variable inputs, and short and long run time periods. It also explains the production function and how total product, marginal product, and average product are determined by the quantity of labor input based on the law of variable proportions. Finally, it covers the concept of returns to scale and how total output can increase more than, equal to, or less than proportionately based on increasing, constant, and diminishing returns to scale respectively in the long run.
The document discusses production functions and the relationship between inputs and outputs in production. It defines key terms like production function, total productivity, marginal productivity, and average productivity. It explains the differences between short run and long run production and the concept of returns to scale. It also discusses the law of diminishing returns and how marginal productivity changes as inputs are varied. Isoquants, or curves showing equal levels of output from different input combinations, are introduced as a way to analyze productivity.
The document provides information on production theory and costs. It defines production as the process of converting inputs into outputs. The relationship between inputs and outputs is represented by the production function. There are laws of variable proportions that show how total product increases at different rates as variable inputs are added. Cost concepts like fixed, variable, total, average and marginal costs are introduced in the short run. Long run costs include economies of scale and different cost curves. Key economic principles like opportunity cost, sunk costs and accounting versus economic costs are also summarized.
Discover timeless style with the 2022 Vintage Roman Numerals Men's Ring. Crafted from premium stainless steel, this 6mm wide ring embodies elegance and durability. Perfect as a gift, it seamlessly blends classic Roman numeral detailing with modern sophistication, making it an ideal accessory for any occasion.
https://rb.gy/usj1a2
At Techbox Square, in Singapore, we're not just creative web designers and developers, we're the driving force behind your brand identity. Contact us today.
The 10 Most Influential Leaders Guiding Corporate Evolution, 2024.pdfthesiliconleaders
In the recent edition, The 10 Most Influential Leaders Guiding Corporate Evolution, 2024, The Silicon Leaders magazine gladly features Dejan Štancer, President of the Global Chamber of Business Leaders (GCBL), along with other leaders.
Anny Serafina Love - Letter of Recommendation by Kellen Harkins, MS.AnnySerafinaLove
This letter, written by Kellen Harkins, Course Director at Full Sail University, commends Anny Love's exemplary performance in the Video Sharing Platforms class. It highlights her dedication, willingness to challenge herself, and exceptional skills in production, editing, and marketing across various video platforms like YouTube, TikTok, and Instagram.
SATTA MATKA SATTA FAST RESULT KALYAN TOP MATKA RESULT KALYAN SATTA MATKA FAST RESULT MILAN RATAN RAJDHANI MAIN BAZAR MATKA FAST TIPS RESULT MATKA CHART JODI CHART PANEL CHART FREE FIX GAME SATTAMATKA ! MATKA MOBI SATTA 143 spboss.in TOP NO1 RESULT FULL RATE MATKA ONLINE GAME PLAY BY APP SPBOSS
Easily Verify Compliance and Security with Binance KYCAny kyc Account
Use our simple KYC verification guide to make sure your Binance account is safe and compliant. Discover the fundamentals, appreciate the significance of KYC, and trade on one of the biggest cryptocurrency exchanges with confidence.
How to Implement a Real Estate CRM SoftwareSalesTown
To implement a CRM for real estate, set clear goals, choose a CRM with key real estate features, and customize it to your needs. Migrate your data, train your team, and use automation to save time. Monitor performance, ensure data security, and use the CRM to enhance marketing. Regularly check its effectiveness to improve your business.
❼❷⓿❺❻❷❽❷❼❽ Dpboss Matka Result Satta Matka Guessing Satta Fix jodi Kalyan Final ank Satta Matka Dpbos Final ank Satta Matta Matka 143 Kalyan Matka Guessing Final Matka Final ank Today Matka 420 Satta Batta Satta 143 Kalyan Chart Main Bazar Chart vip Matka Guessing Dpboss 143 Guessing Kalyan night
[To download this presentation, visit:
https://www.oeconsulting.com.sg/training-presentations]
This PowerPoint compilation offers a comprehensive overview of 20 leading innovation management frameworks and methodologies, selected for their broad applicability across various industries and organizational contexts. These frameworks are valuable resources for a wide range of users, including business professionals, educators, and consultants.
Each framework is presented with visually engaging diagrams and templates, ensuring the content is both informative and appealing. While this compilation is thorough, please note that the slides are intended as supplementary resources and may not be sufficient for standalone instructional purposes.
This compilation is ideal for anyone looking to enhance their understanding of innovation management and drive meaningful change within their organization. Whether you aim to improve product development processes, enhance customer experiences, or drive digital transformation, these frameworks offer valuable insights and tools to help you achieve your goals.
INCLUDED FRAMEWORKS/MODELS:
1. Stanford’s Design Thinking
2. IDEO’s Human-Centered Design
3. Strategyzer’s Business Model Innovation
4. Lean Startup Methodology
5. Agile Innovation Framework
6. Doblin’s Ten Types of Innovation
7. McKinsey’s Three Horizons of Growth
8. Customer Journey Map
9. Christensen’s Disruptive Innovation Theory
10. Blue Ocean Strategy
11. Strategyn’s Jobs-To-Be-Done (JTBD) Framework with Job Map
12. Design Sprint Framework
13. The Double Diamond
14. Lean Six Sigma DMAIC
15. TRIZ Problem-Solving Framework
16. Edward de Bono’s Six Thinking Hats
17. Stage-Gate Model
18. Toyota’s Six Steps of Kaizen
19. Microsoft’s Digital Transformation Framework
20. Design for Six Sigma (DFSS)
To download this presentation, visit:
https://www.oeconsulting.com.sg/training-presentations
Navigating the world of forex trading can be challenging, especially for beginners. To help you make an informed decision, we have comprehensively compared the best forex brokers in India for 2024. This article, reviewed by Top Forex Brokers Review, will cover featured award winners, the best forex brokers, featured offers, the best copy trading platforms, the best forex brokers for beginners, the best MetaTrader brokers, and recently updated reviews. We will focus on FP Markets, Black Bull, EightCap, IC Markets, and Octa.
Event Report - SAP Sapphire 2024 Orlando - lots of innovation and old challengesHolger Mueller
Holger Mueller of Constellation Research shares his key takeaways from SAP's Sapphire confernece, held in Orlando, June 3rd till 5th 2024, in the Orange Convention Center.
Building Your Employer Brand with Social MediaLuanWise
Presented at The Global HR Summit, 6th June 2024
In this keynote, Luan Wise will provide invaluable insights to elevate your employer brand on social media platforms including LinkedIn, Facebook, Instagram, X (formerly Twitter) and TikTok. You'll learn how compelling content can authentically showcase your company culture, values, and employee experiences to support your talent acquisition and retention objectives. Additionally, you'll understand the power of employee advocacy to amplify reach and engagement – helping to position your organization as an employer of choice in today's competitive talent landscape.
IMPACT Silver is a pure silver zinc producer with over $260 million in revenue since 2008 and a large 100% owned 210km Mexico land package - 2024 catalysts includes new 14% grade zinc Plomosas mine and 20,000m of fully funded exploration drilling.
Part 2 Deep Dive: Navigating the 2024 Slowdownjeffkluth1
Introduction
The global retail industry has weathered numerous storms, with the financial crisis of 2008 serving as a poignant reminder of the sector's resilience and adaptability. However, as we navigate the complex landscape of 2024, retailers face a unique set of challenges that demand innovative strategies and a fundamental shift in mindset. This white paper contrasts the impact of the 2008 recession on the retail sector with the current headwinds retailers are grappling with, while offering a comprehensive roadmap for success in this new paradigm.
Top mailing list providers in the USA.pptxJeremyPeirce1
Discover the top mailing list providers in the USA, offering targeted lists, segmentation, and analytics to optimize your marketing campaigns and drive engagement.
1. 1
• Production involves transformation
of inputs such as capital,
equipment, labor, and land into
output - goods and services
• In this production process, the
manager is concerned with
efficiency in the use of the inputs
- technical vs. economical efficiency
THE THEORY OF
PRODUCTION
2. 2
Two Concepts of Efficiency
• Economic efficiency:
– occurs when the cost of producing a
given output is as low as possible
• Technological efficiency:
– occurs when it is not possible to
increase output without increasing
inputs
3. 3
You will see that basic production
theory is simply an application of
constrained optimization:
the firm attempts either to minimize
the cost of producing a given level
of output
or
to maximize the output attainable
with a given level of cost.
Both optimization problems lead to
same rule for the allocation of
inputs and choice of technology
4. 4
Production Function
• A production function is purely technical
relation which connects factor inputs &
outputs. It describes the transformation of
factor inputs into outputs at any particular
time period.
Q = f( L,K,R,Ld,T,t)
where
Q = output R= Raw Material
L= Labour Ld = Land
K= Capital T = Technology
t = time
For our current analysis, let’s reduce the
inputs to two, capital (K) and labor (L):
Q = f(L, K)
5. 5
Production Table
Units of K
Employed Output Quantity (Q)
8 37 60 83 96 107 117 127 128
7 42 64 78 90 101 110 119 120
6 37 52 64 73 82 90 97 104
5 31 47 58 67 75 82 89 95
4 24 39 52 60 67 73 79 85
3 17 29 41 52 58 64 69 73
2 8 18 29 39 47 52 56 52
1 4 8 14 20 27 24 21 17
1 2 3 4 5 6 7 8
Units of L Employed
Same Q can be produced with different combinations of
inputs, e.g. inputs are substitutable in some degree
6. 6
Short-Run and Long-Run
Production
• In the short run some inputs are
fixed and some variable
– e.g. the firm may be able to vary the
amount of labor, but cannot change
the amount of capital
– in the short run we can talk about
factor productivity / law of variable
proportion/law of diminishing returns
7. 7
• In the long run all inputs
become variable
– e.g. the long run is the period
in which a firm can adjust all
inputs to changed conditions
– in the long run we can talk
about returns to scale
8. 8
Short-Run Changes in
Production
Factor Productivity
Units of K
Employed Output Quantity (Q)
8 37 60 83 96 107 117 127 128
7 42 64 78 90 101 110 119 120
6 37 52 64 73 82 90 97 104
5 31 47 58 67 75 82 89 95
4 24 39 52 60 67 73 79 85
3 17 29 41 52 58 64 69 73
2 8 18 29 39 47 52 56 52
1 4 8 14 20 27 24 21 17
1 2 3 4 5 6 7 8
Units of L Employed
How much does the quantity of Q change,
when the quantity of L is increased?
9. 9
Long-Run Changes in
Production
Returns to Scale
Units of K
Employed Output Quantity (Q)
8 37 60 83 96 107 117 127 128
7 42 64 78 90 101 110 119 120
6 37 52 64 73 82 90 97 104
5 31 47 58 67 75 82 89 95
4 24 39 52 60 67 73 79 85
3 17 29 41 52 58 64 69 73
2 8 18 29 39 47 52 56 52
1 4 8 14 20 27 24 21 17
1 2 3 4 5 6 7 8
Units of L Employed
How much does the quantity of Q change, when
the quantity of both L and K is increased?
10. 10
Relationship Between Total,
Average, and Marginal Product:
Short-Run Analysis
• Total Product (TP) = total quantity
of output
• Average Product (AP) = total
product per total input
• Marginal Product (MP) = change
in quantity when one additional
unit of input used
11. 11
The Marginal Product of
Labor
• The marginal product of labor is the
increase in output obtained by adding
1 unit of labor but holding constant the
inputs of all other factors
Marginal Product of L:
MPL= Q/L (holding K constant)
= Q/L
Average Product of L:
APL= Q/L (holding K constant)
12. 12
Law of Diminishing
Returns
(Diminishing Marginal
Product)
The law of diminishing returns states that when more
and more units of a variable input are applied to a
given quantity of fixed inputs, the total output may
initially increase at an increasing rate and then at a
constant rate but it will eventually increases at
diminishing rates.
Assumptions. The law of diminishing returns is based
on the following assumptions: (i) the state of technology
is given (ii) labour is homogenous and (iii) input prices
are given.
13. 13
Short-Run Analysis of Total,
Average, and Marginal Product
• If MP > AP then
AP is rising
• If MP < AP then
AP is falling
• MP = AP when
AP is
maximized
• TP maximized
when MP = 0
14. 14
Three Stages of Production in
Short Run
AP,MP
X
Stage I Stage II Stage III
APX
MPX
•TPL Increases at
increasing rate.
•MP Increases at
decreasing rate.
•AP is increasing
and reaches its
maximum at the
end of stage I
•TPL Increases at
Diminshing rate.
•MPL Begins to decline.
•TP reaches maximum
level at the end of
stage II, MP = 0.
•APL declines
• TPL begins to
decline
•MP becomes
negative
•AP continues to
decline
15. 15
Three Stages of Production
Stages
Labor Total Average Marginal of
Unit Product Product Product Production
(X) (Q or TP) (AP) (MP)
1 24 24 24
2 72 36 48 I
3 138 46 66 Increasing
4 216 54 78 Returns
5 300 60 84
6 384 64 84
7 462 66 78
8 528 66 66 II
9 576 64 48 Diminishing
10 600 60 24 Returns
11 594 54 -6 III
12 552 46 -42 Negative Returns
16. 16
Application of Law of
Diminishing Returns:
• It helps in identifying the rational
and irrational stages of
operations.
• It gives answers to question –
How much to produce?
What number of workers to apply
to a given fixed inputs so that the
output is maximum?
17. 17
Production in the
Long-Run
– All inputs are now considered to
be variable (both L and K in our
case)
– How to determine the optimal
combination of inputs?
To illustrate this case we will use
production isoquants.
An isoquant is a locus of all
technically efficient methods or all
possible combinations of inputs for
producing a given level of output.
18. 18
Production Table
Units of K
Employed Output Quantity (Q)
8 37 60 83 96 107 117 127 128
7 42 64 78 90 101 110 119 120
6 37 52 64 73 82 90 97 104
5 31 47 58 67 75 82 89 95
4 24 39 52 60 67 73 79 85
3 17 29 41 52 58 64 69 73
2 8 18 29 39 47 52 56 52
1 4 8 14 20 27 24 21 17
1 2 3 4 5 6 7 8
Units of K Employed
of L
Isoquant
Units of K
Employed
20. 20
There exists some degree of
substitutability between inputs.
Different degrees of substitution:
Sugar
a) Linear Isoquant
(Perfect substitution)
b) Input – Output/ L-
Shaped Isoquant
(Perfect
complementarity)
All other
ingredients
Natural
flavoring
Q
Q
Capital
Labor
L1 L2 L3 L4
K
1
K
2
K
3
K
4
Sugar
Cane
syrup
c) Kinked/Acitivity
Analysis Isoquant –
(Limited substitutability)
Types of Isoquant
21. 21
• The degree of imperfection in
substitutability is measured with
marginal rate of technical
substitution (MRTS- Slope of
Isoquant):
MRTS = L/K
(in this MRTS some of L is removed
from the production and substituted
by K to maintain the same level of
output)
Marginal Rate of Technical
Substitution MRTS
22. 22
Properties of Isoquants
• Isoquants have a negative slope.
• Isoquants are convex to the origin.
• Isoquants cannot intersect or be tangent to
each other.
• Upper Isoquants represents higher level of
output
23. 23
Isoquant Map
• Isoquant map is a set
of isoquants
presented on a two
dimensional plain.
Each isoquant shows
various combinations
of two inputs that can
be used to produce a
given level of output.
Figure : Isoquant Map
Labour X
Capital
Y
Y
O X
IQ4
IQ3
IQ2
IQ1
24. 24
Laws of Returns to Scale
• It explains the behavior of output in response
to a proportional and simultaneous change in
input.
• When a firm increases both the inputs, there
are three technical possibilities –
(i) TP may increase more than proportionately –
Increasing RTS
(ii) TP may increase proportionately – constant
RTS
(iii) TP may increase less than proportionately –
diminishing RTS
28. 28
Elasticity of Factor Substitution
• ( ) is formally defined as the percentage change in the capital
labour ratios (K/L) divided by the percentage change in
marginal rate of technical substitution (MRTS), i.e
Percentage change in K/L
( )=
Percentage change in MRTS
д(K/L) / (K/L)
( )=
д(MRTS) / (MRTS)
29. 29
Cobb – Dougles Production
function: -
X= b0 Lb1 Kb2
X= Out put
L = qty of Labour
K = qty of Capital
bo , b1 , b2 Coefficient
b1 - Labour
b2 - Capital
30. 30
Characteristics of Cobb – Dougles Prodn
function: -
1. The Marginal Product of Factor:
(a) MP L = dx/dl
X = b0Lb1Kb2
dx/dl = b0 b1 Lb1-1Kb2
= b1 (boLb1 K b2) L-1
= b1 X/L
= b1 (AP L)
APL Average Product of Labour
Similarly
(b) MP K = dx/dk
= b2 b0Lb1Kb2-1
= b2 ( b0 Lb1 Kb2) K-1
= b2 X/K
APk Average Product of Capital
31. 31
2. The Marginal rate of technical substitution
MRTS L.K = MPL
MPK
= dx/dL = b1(X/L)
dx/dk b2(X/K)
MRTS LK = b1 K
b2 L
32. 32
3. The Elasticity of Substitution
σ = d k/L / k/l
dMRTS / MRTS
= dK/L/k/L
b1 dk b1 k
b2 L b2 L
EOS =1
This function is perfectly substitutable
function.
33. 33
4.Factor intensity: -
In cobb-Douglas function factor intensity is
measured by ratio b1/b2. The higher is the ratio
(b1/b2), the more labour intensive is the
technique. Similarly, the lower the ratio (b1/b2)
the more capital intensive is the technique.
OR
b1/b2 labour intensive
b1/b2 capital intensive
34. 34
5. Returns to scale:-
In cobb – Dougles production function RTS is
measured by the sum of the coefficients
b1+b2 = V
x 0= f (L,K)
X*= f(kL, KK)
A homogenous function is a function such that if
each of the inputs is multiplied by K i.e ‘K’ can
the completely factored out. ‘K’ also has a
power V which is called the degree of
homogeneity and it measures RTS.
35. 35
X*= Kv f(x0)
X0 = b0 L b1 K b2
X* = b0 (kL) b1 (kK)b2
= Kb1+b2 (bo L b1 K b2)
=Kv f (X0)
(V=b1 + b2)
X* = K v f (Xo)
In case when
V=1 we have constant RTS
V>1 we have increasing RTS
V<1 we have decreasing RTS
36. 36
6.Efficiency of Production
The efficiency in the organization of the factor of
production is measured by the coefficient b0 :-
If two firms have the same K, L, b1, b2 and still
produce different quantities of output, the
difference can be due to superior organization
and entrepreneurship of one of the firms, which
results in different effectiveness.
The more efficient firm will have a larger b0 than
the less efficient one.
b0 More efficient is firm
37. 37
Constant Elasticity Substitution
(CES) Production Functions
• The CES production function is expressed as
1. ‘A’ is the efficiency parameter and shows the scale
effect. It indicates state of technology and
entrepreneurial organizational aspects of production.
Higher Value of A higher output (given same inputs)
parameters
three
the
are
and
A,
and
capital,
K
labour,
-
L
where
-1)
,
1
0
,
0
(A
Subject to
)
1
( /
and
L
K
A
Q
38. 38
2. is the capital intensity factor coefficient and (1-
) is the labour intensity of coefficient . The value
of indicates the relative contribution of capital
input and labour input to total output.
3. Value of Elasticity of Substitution ( ) depends
upon the value of substitution parameter ‘β’
4. The parameter v represents degree of returns to
scale.
5. Marginal Products of labour and capital are
always positive if we assume constant return to
scale.
1
1
39. 39
Equilibrium of the firm: Choice of optimal
combination of factors of prodn
• Assumptions:
1. The goal of the firm is profit maximization i.e
maximization of difference
∏ - Profit
R- Revenue
C-Cost
2. The price of o/p is given, Px
3. The price of factors are given w is the given wage
rate r is given price capital
40. 40
Single Decision of the firm
(a) Maximize profit ∏, subject to cost
constraint. In this case total cost & prices
are given and maximization of ∏ is if X is
maximised since c & Px are given constant.
∏ = R-C
= P x X-C
(b) Maximise Profit ∏ for a given level of o/p.
Maximisation of ∏ is achieved in this case if
cost c is minimized , given that X & Px are
given constants.
∏= R-C
∏= PxX - C
41. 41
We will use isoquant map (1) and
isoquant line (2)
Figure : Isoquant Line (2)
K
O L
C/W
C/r
B
A
Figure : Isoquant Map (1)
Capital
Y
K
O L
3x
2x
x1
The cost line is defined by cost equation
C= (r) (k) + (w) (L)
W wage rate r= price of capital service
43. 43
Condition for Equilibrium
• At point of tendency slope of isocost line
(w/r ) = slope of isoquant. (MPL/MPK)
• The isoquants should be convex to origin